Report: Capital Structure Analysis of AMP Limited (Finance Module)

Verified

Added on  2023/06/04

|9
|1953
|263
Report
AI Summary
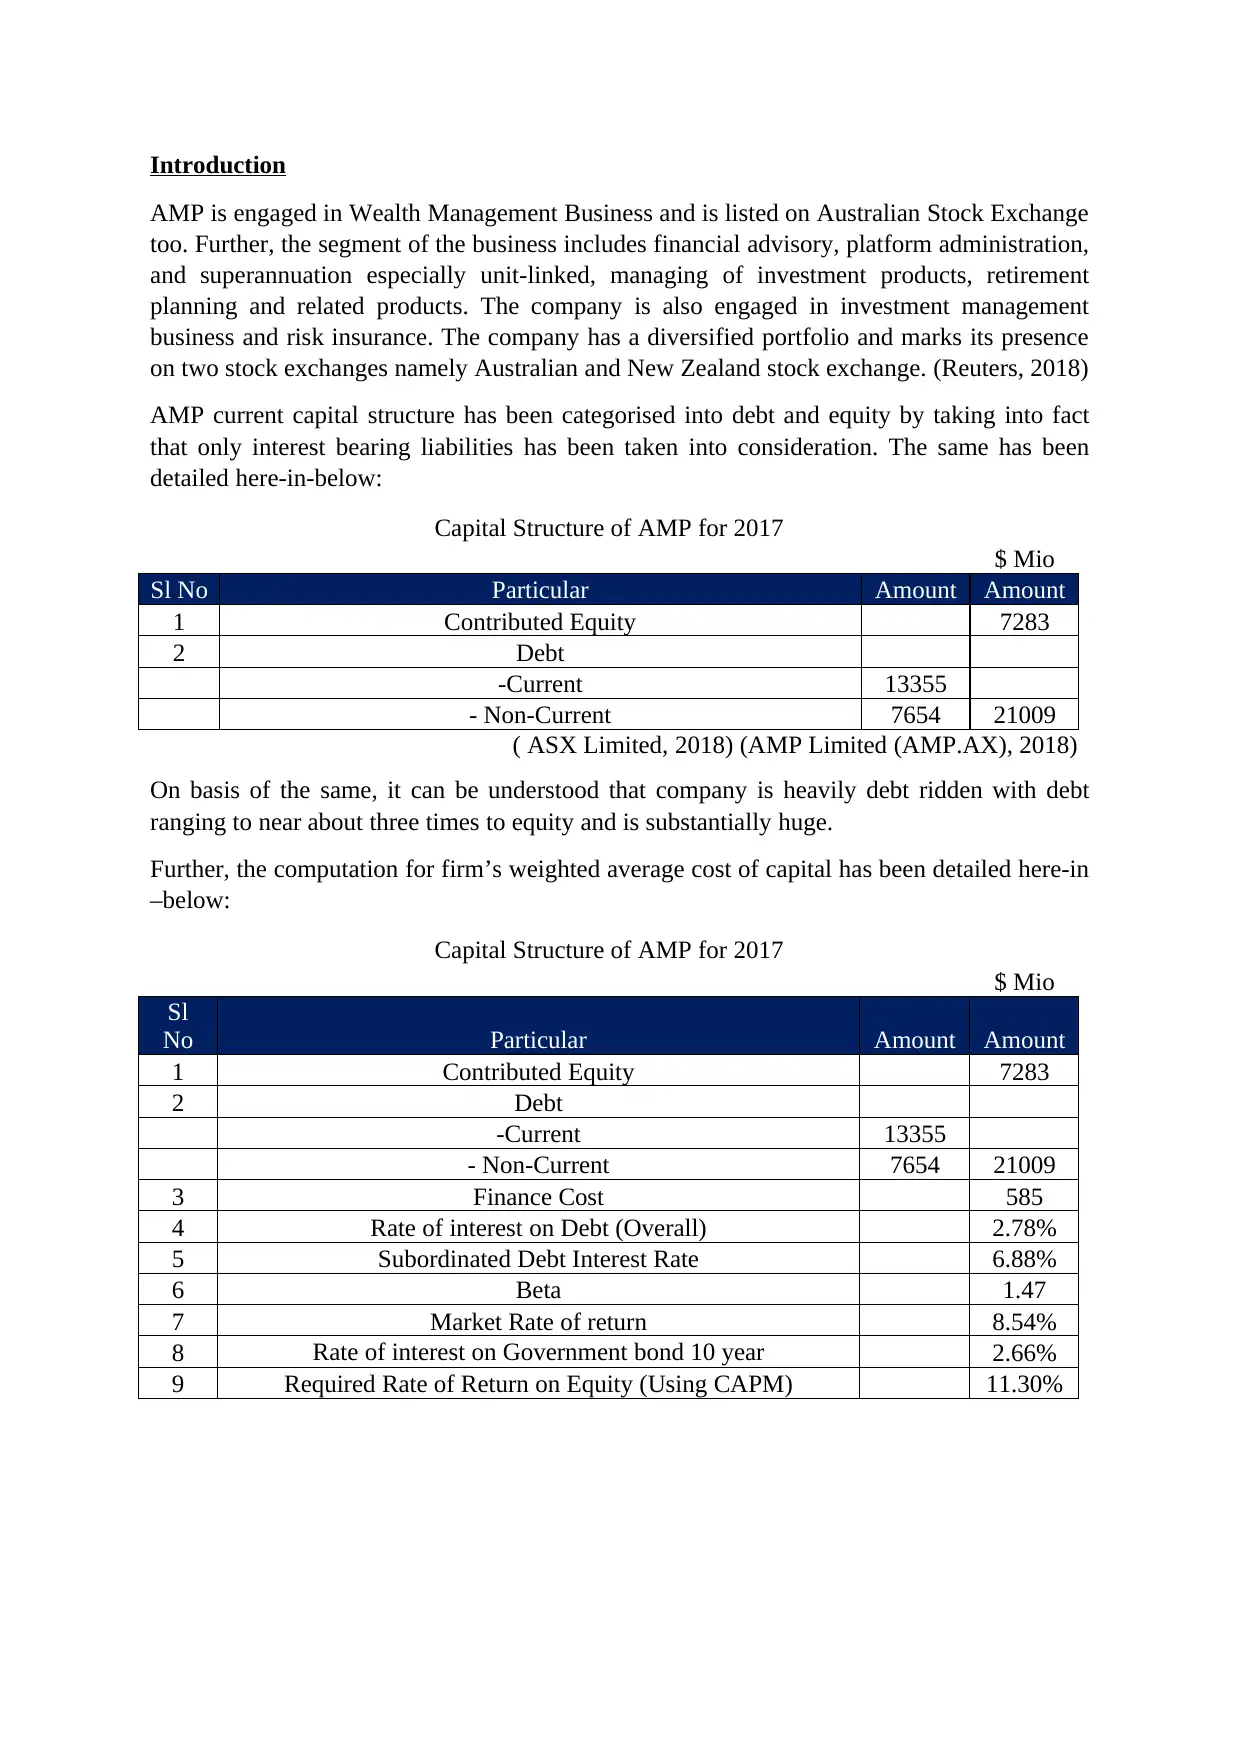
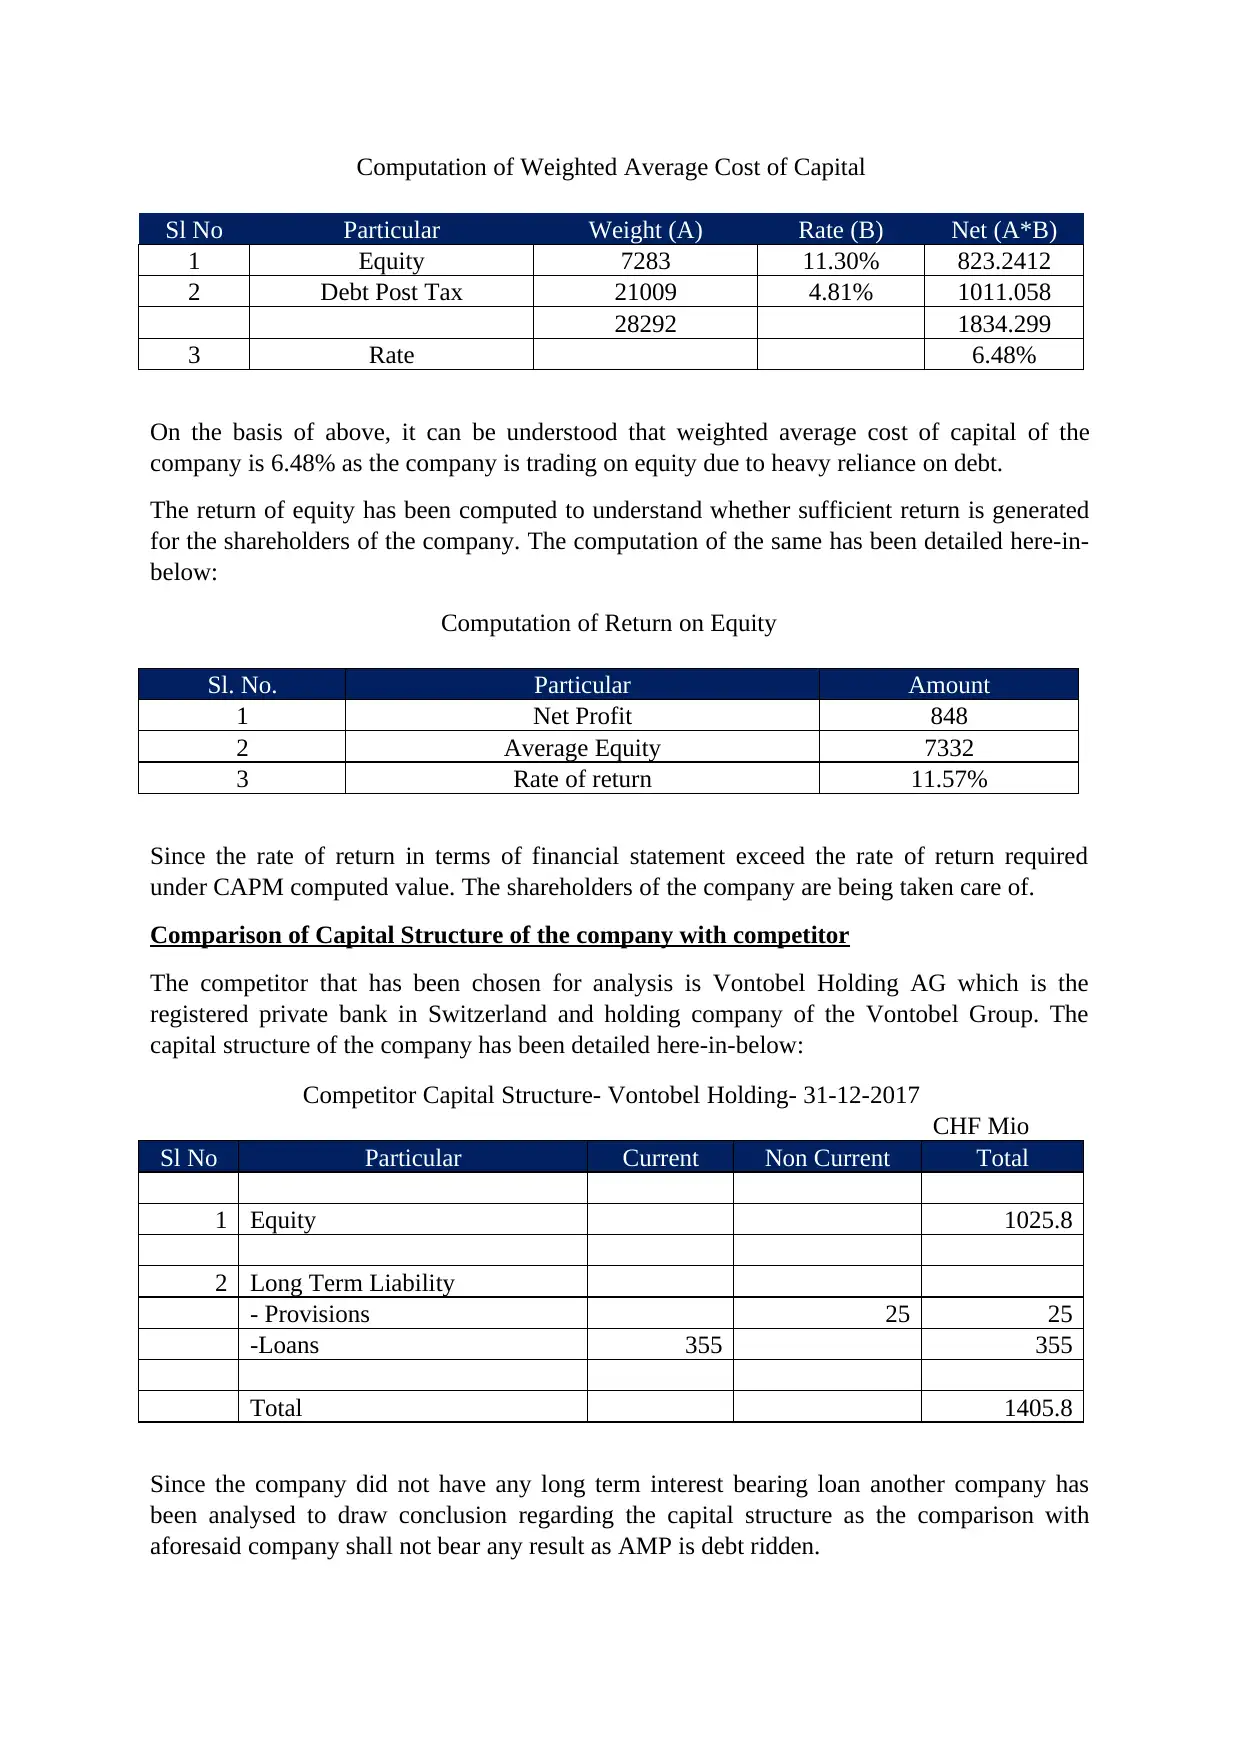
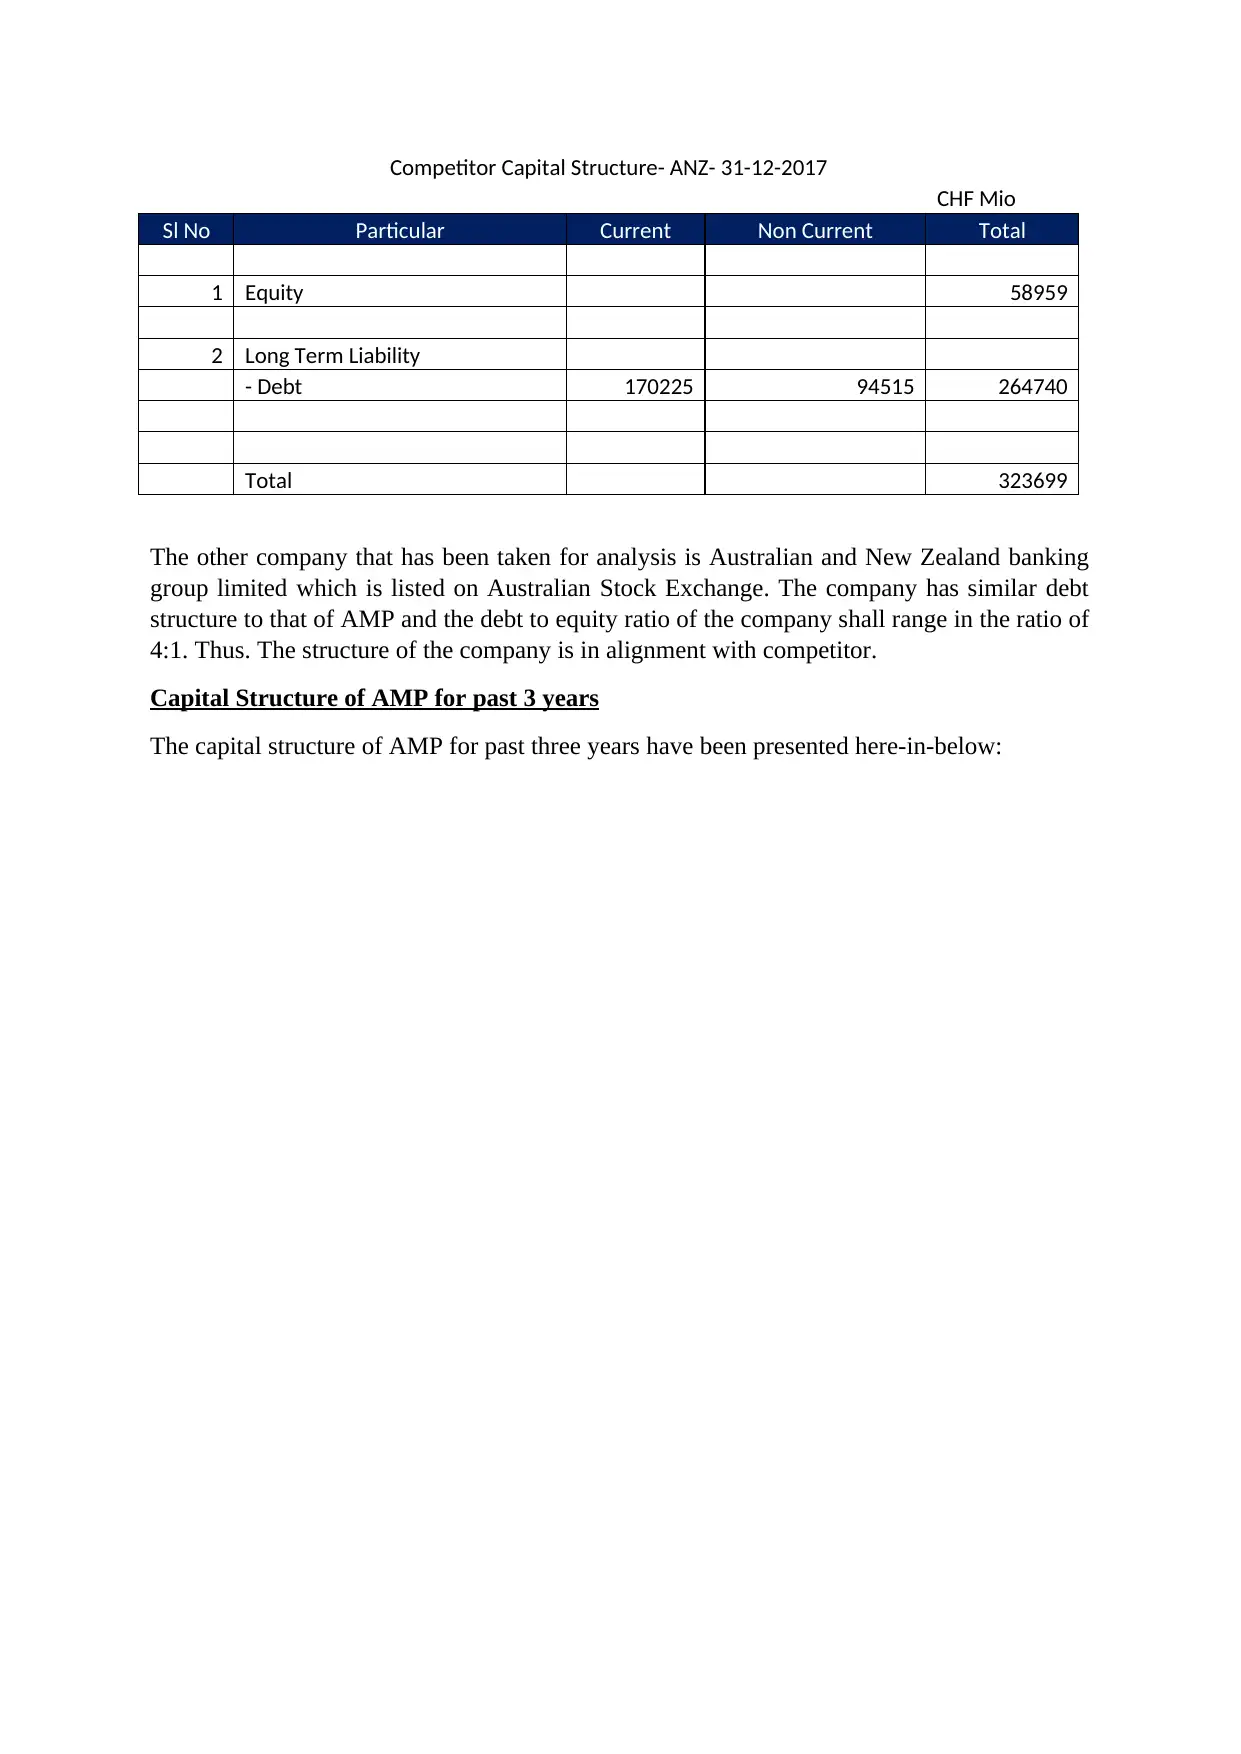
This report provides a comprehensive financial analysis of AMP Limited, a financial services company listed on the Australian Stock Exchange. The analysis begins with an executive summary and introduction, followed by a detailed examination of AMP's capital structure, including debt and equity components. The report calculates the Weighted Average Cost of Capital (WACC) and Return on Equity (ROE) to assess financial performance and shareholder returns. A comparative analysis of AMP's capital structure with a competitor, Vontobel Holding AG and ANZ, is conducted to benchmark its financial position. Key financial ratios are computed and evaluated, with data sourced from Yahoo Finance. The report also identifies and assesses the company's risk management strategies, including strategic, credit, market, insurance, liquidity, concentration, and operational risks. The effectiveness of AMP's risk management tools is evaluated, with a focus on the company's ability to maximize wealth for its shareholders. The report concludes with an overall assessment of AMP's financial health and strategic direction, referencing the company's annual reports and external financial data.
Document Page
ACCOUNTING AND FINANCE
Executive Summary
The report has been prepared to analyse the financial of AMP, an entity listed on Australian
Stock Exchange. The analysis includes the following subject matter:
(a) Capital Structure of AMP for December ended 2017 accounts;
(b) Computation of Weighted Average Cost of Capital of the company;
(c) Computation the rate of return on equity;
(d) Comparison of capital structure of the company with the competitor;
(e) Analysis of Key ratios of AMP and
(f) Analysis of the change in Capital structure of the company over three year;
(g) Identification of material weakness and how company has managed the same to
generate wealth.
tabler-icon-diamond-filled.svg

Paraphrase This Document

Need a fresh take? Get an instant paraphrase of this document with our AI Paraphraser
Document Page
Introduction
AMP is engaged in Wealth Management Business and is listed on Australian Stock Exchange
too. Further, the segment of the business includes financial advisory, platform administration,
and superannuation especially unit-linked, managing of investment products, retirement
planning and related products. The company is also engaged in investment management
business and risk insurance. The company has a diversified portfolio and marks its presence
on two stock exchanges namely Australian and New Zealand stock exchange. (Reuters, 2018)
AMP current capital structure has been categorised into debt and equity by taking into fact
that only interest bearing liabilities has been taken into consideration. The same has been
detailed here-in-below:
Capital Structure of AMP for 2017
$ Mio
Sl No Particular Amount Amount
1 Contributed Equity 7283
2 Debt
-Current 13355
- Non-Current 7654 21009
( ASX Limited, 2018) (AMP Limited (AMP.AX), 2018)
On basis of the same, it can be understood that company is heavily debt ridden with debt
ranging to near about three times to equity and is substantially huge.
Further, the computation for firm’s weighted average cost of capital has been detailed here-in
–below:
Capital Structure of AMP for 2017
$ Mio
Sl
No Particular Amount Amount
1 Contributed Equity 7283
2 Debt
-Current 13355
- Non-Current 7654 21009
3 Finance Cost 585
4 Rate of interest on Debt (Overall) 2.78%
5 Subordinated Debt Interest Rate 6.88%
6 Beta 1.47
7 Market Rate of return 8.54%
8 Rate of interest on Government bond 10 year 2.66%
9 Required Rate of Return on Equity (Using CAPM) 11.30%
Document Page
Computation of Weighted Average Cost of Capital
Sl No Particular Weight (A) Rate (B) Net (A*B)
1 Equity 7283 11.30% 823.2412
2 Debt Post Tax 21009 4.81% 1011.058
28292 1834.299
3 Rate 6.48%
On the basis of above, it can be understood that weighted average cost of capital of the
company is 6.48% as the company is trading on equity due to heavy reliance on debt.
The return of equity has been computed to understand whether sufficient return is generated
for the shareholders of the company. The computation of the same has been detailed here-in-
below:
Computation of Return on Equity
Sl. No. Particular Amount
1 Net Profit 848
2 Average Equity 7332
3 Rate of return 11.57%
Since the rate of return in terms of financial statement exceed the rate of return required
under CAPM computed value. The shareholders of the company are being taken care of.
Comparison of Capital Structure of the company with competitor
The competitor that has been chosen for analysis is Vontobel Holding AG which is the
registered private bank in Switzerland and holding company of the Vontobel Group. The
capital structure of the company has been detailed here-in-below:
Competitor Capital Structure- Vontobel Holding- 31-12-2017
CHF Mio
Sl No Particular Current Non Current Total
1 Equity 1025.8
2 Long Term Liability
- Provisions 25 25
-Loans 355 355
Total 1405.8
Since the company did not have any long term interest bearing loan another company has
been analysed to draw conclusion regarding the capital structure as the comparison with
aforesaid company shall not bear any result as AMP is debt ridden.
Document Page
Competitor Capital Structure- ANZ- 31-12-2017
CHF Mio
Sl No Particular Current Non Current Total
1 Equity 58959
2 Long Term Liability
- Debt 170225 94515 264740
Total 323699
The other company that has been taken for analysis is Australian and New Zealand banking
group limited which is listed on Australian Stock Exchange. The company has similar debt
structure to that of AMP and the debt to equity ratio of the company shall range in the ratio of
4:1. Thus. The structure of the company is in alignment with competitor.
Capital Structure of AMP for past 3 years
The capital structure of AMP for past three years have been presented here-in-below:
tabler-icon-diamond-filled.svg

Paraphrase This Document

Need a fresh take? Get an instant paraphrase of this document with our AI Paraphraser
Document Page
Capital Structure of Past 3 years
2017 2016 2015
Sl
No Particular
Curren
t
Non
Current
Tota
l
Curren
t
Non
Current
Tota
l
Curren
t
Non
Current
Tota
l
1 AMP Bank
-Deposits 9627 28
965
5 8614 38
865
2 6499 179
667
8
-Other 3382 5437
881
9 3145 3516
666
1 3123 3801
692
4
2 Corporate Entity Borrowings
-6.875% GBP Subordinated Guaranteed Bonds 69 69 71 71 82 82
-AMP Subordinated 324 324 322 322 321 321
-Floating Rate Subordinated Unsecured Notes 601 601
-AMP Wholesale Capital Notes 276 276 276 276 276 276
-AMP Capital Notes-2015 264 264 263 263 262 262
-AMP Capital Notes-2017 250 250 0
- Syndicated Loan Facility 497 497 500 500
-Commercial Paper 229 229 114 114
-Other 28 1 29 6 6 271 271
Borrowings within investment entities controlled
by AMP's life statutory funds 89 508 597 98 255 353 565 1472
203
7
3 Contributed Equity 7283
728
3 7541
754
1 8895
889
5
Document Page
On perusal of the above table one can understand that deposit of the bank has increased over the years creating additional liability while the
contributed equity of the company has fallen over the year on account of losses in 2015 and reduction in minority interest and other related
events. Further, company has borrowed additional amount through notes this year and borrowing within investment entities have fallen
drastically.
Document Page
Analysis of Key Ratios for AMP
The key ratios of AMP have been computed and also has been taken from Yahoo finance and
there is discrepancy in the same on account of difference in time period. The computation has
been made on the basis of balance sheet figures on 31-12-2017. The same has been tabulated
here-in-below:
Key ratios (Data- Yahoo Finance)
Sl No Particular Briefs Computed Figure
1 Enterprise Value/ Revenue -4.86 1.77
2 Enterprise Value/ EBITDA -50.6 14.47
3 Profit Margin 2.89% 5%
4 Operating margin (ttm) 9.49% 12%
5 Return on Assets(ttm) 0.73% 0.59%
6 Return on Equity(ttm) 7.55% 12.12%
7 Revenue Per Share (ttm) 6.22 6.29
On perusal of the above, it can be seen that company is not earning substantive profit with
profit margin of 5% which is substantially low for survival of business. However, the same
may be good compared to losses in the past year. Further, the return of equity is good as the
company is trading on equity and revenue per share is greater than the share price which is
good.
Maximising Wealth for Shareholders
The seven risk that have been identified by the management includes the following:-
(a) Strategic Risk : This risk includes risk associated with decisions of strategic nature and
timely changes in the company to respond to dynamic industry;
(b) Credit Risk : This risk includes non-payment by counter party;
(c) Market Risk : The change is economic conditions which may change the large position
of the market;
(d) Insurance Risk: the Risk includes change in behaviour of policy holder, development
of morbidity rates;
(e) Liquidity Risk: The risk of inability to meet debt requirement on account of liquidity
crunch;
(f) Concentration Risk: The risk is on account of credit concentration, market correlation,
cross risk types etc;
(g) Operational Risk: Risk of failure of internal system and process or from events external
in nature.
How company is managing the same
tabler-icon-diamond-filled.svg

Paraphrase This Document

Need a fresh take? Get an instant paraphrase of this document with our AI Paraphraser
Document Page
The company has established effective risk management team as fundamental to long-term
sustainability. Further, keeping in pace with changes in regulatory law to avoid any penalty
and fine to avoid any insurance risk helps organisation to survive the risk.
The company has established risk committee and three line defence mechanism to manage
the aforesaid risk. Further Enterprise Risk Management is established to identity, assess,
monitor and review the risk.
Effectiveness of risk managing tool
On perusal the financial statement of the company, it may be understood that the company is
performing strategically better compared to previous year on account of earning on 29 Cents
this year per share compared to loss of 11.7 cents per share previous year.
Further, interest rate risk has been managed by the company by entering into floating to fixed
interest rate. On perusal of the table presented in page 82 of Annual Report 2017 of the
company it can be seen that company is able to control to market risk to certain extent as
represented by the table. However, the sensitivity of currency risk is still substantial.
On analysing the liquidity risk, it may be seen that for major chunk of capital structure the
repayment exceeds 5 year. However, the next larger chunk falls in the range of 1 year or no
term and the same exceeds the cash pool of the company and thus it can be seen that
company is not effective in solving this risk. (Page 83 of Annual Report, 2017).
For Credit risk, it may be seen that the loan and advance due but not impaired has decreased.
However, the amount which has been due but not impaired for days greater than 91 days has
increased by 25%. Thus, company has achieved fairly in this regard.
The company is performing better compared to past years and since no sign of failure is
detected in annual report and other websites, it may be concluded that company is able to
control Operating risk and strategic risk;
Concentration risk has been tried to be restricted by entering into credit default swap to hedge
the risk and has been restricted to limits set in the AMP concentration & Credit default policy
risk as stated in Page 84 of Annual report 2017.
Conclusion
The company has fared well compared to past year and is relying heavily on debt for its
survival.
Document Page
References:
ASX Limited. (2018). AMP LIMITED. Retrieved September 26, 2018, from search.asx.com.au:
https://search.asx.com.au/s/search.html?query=AMP&collection=asx-meta&profile=web
AMP Limited (AMP.AX). (2018, September 25). Retrieved September 26, 2018, from
au.finance.yahoo.com: https://au.finance.yahoo.com/quote/AMP.AX?p=AMP.AX
Reuters. (2018). AMP Ltd (AMP.AX). Retrieved September 26, 2018, from in.reuters.com:
https://in.reuters.com/finance/stocks/company-profile/AMP.AX
chevron_up_icon
1 out of 9
circle_padding
hide_on_mobile
zoom_out_icon
[object Object]