AMP Limited: Capital Structure, Financial Ratios, and Risk Analysis
VerifiedAdded on 2023/06/04
|17
|2888
|53
Report
AI Summary
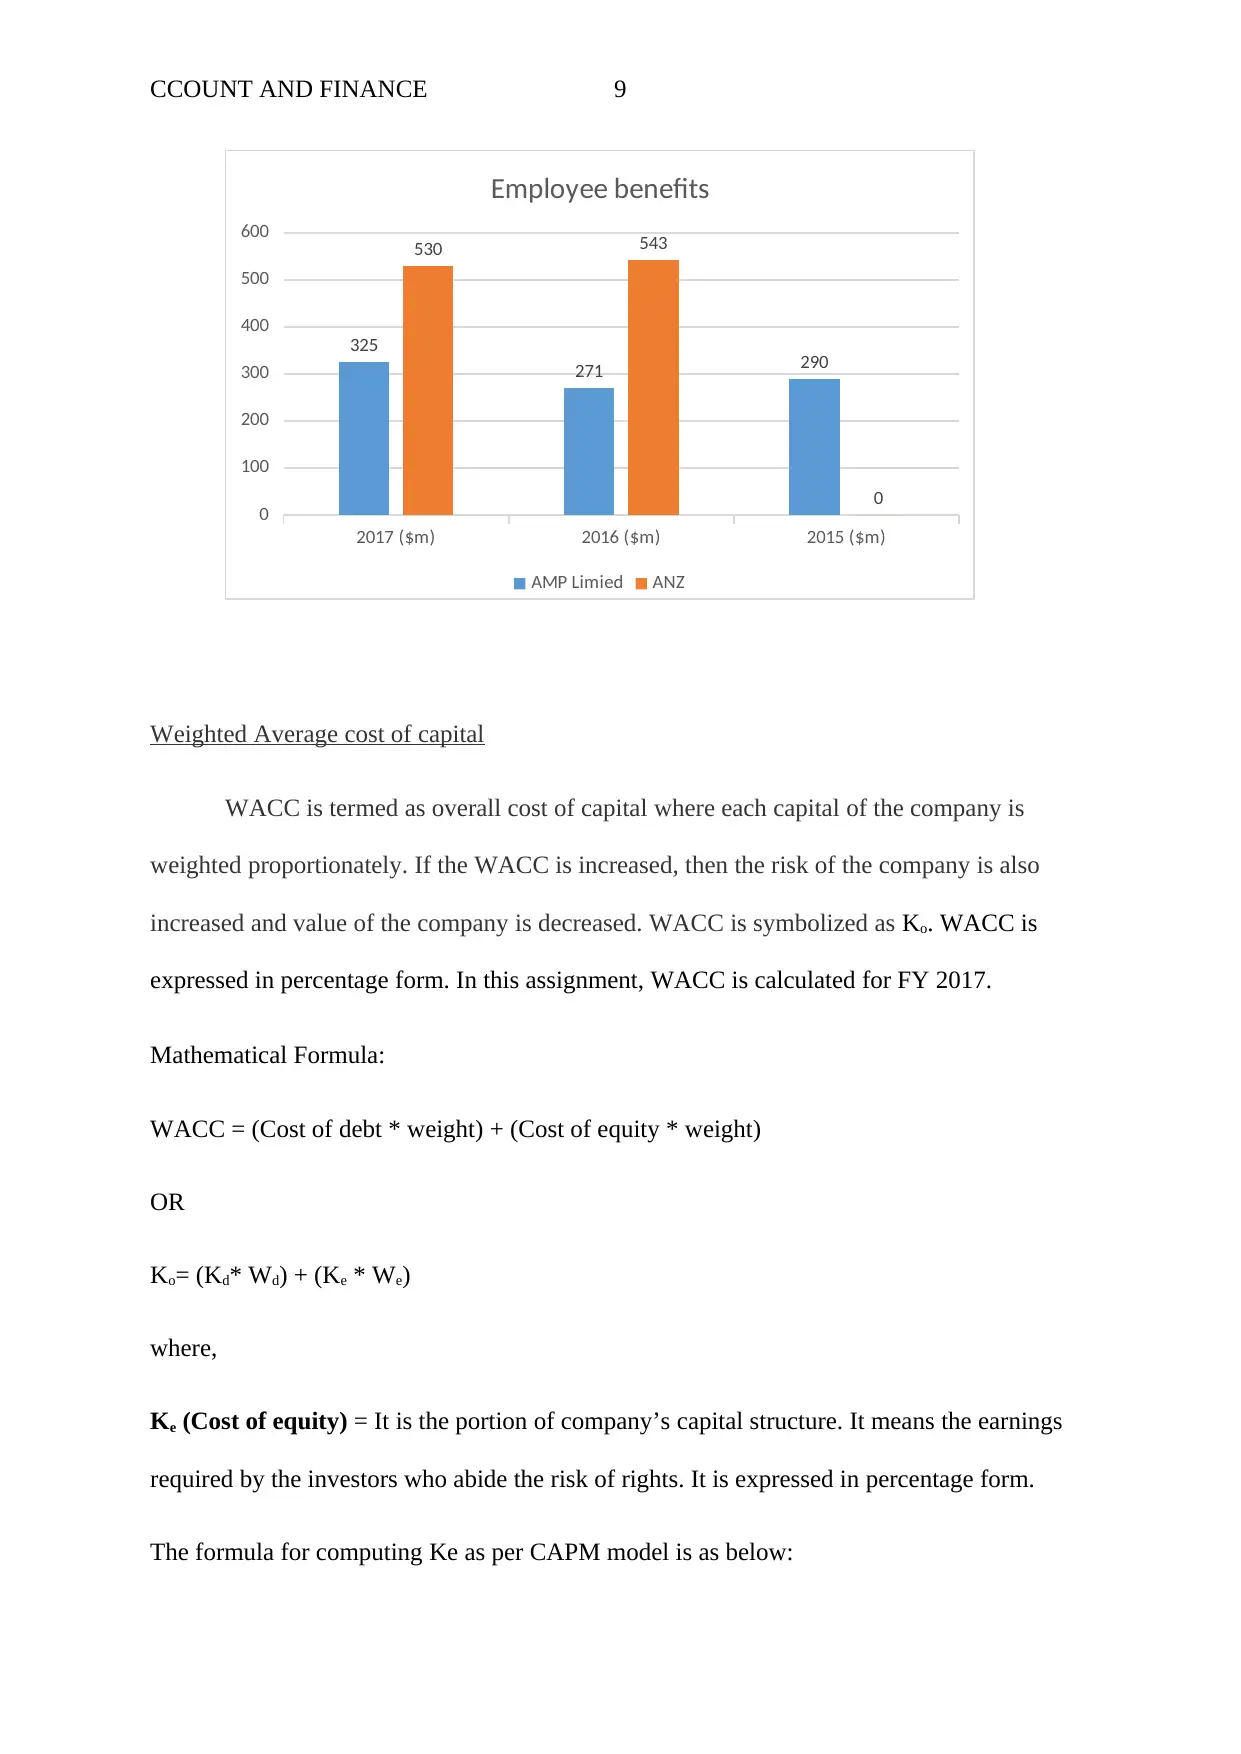
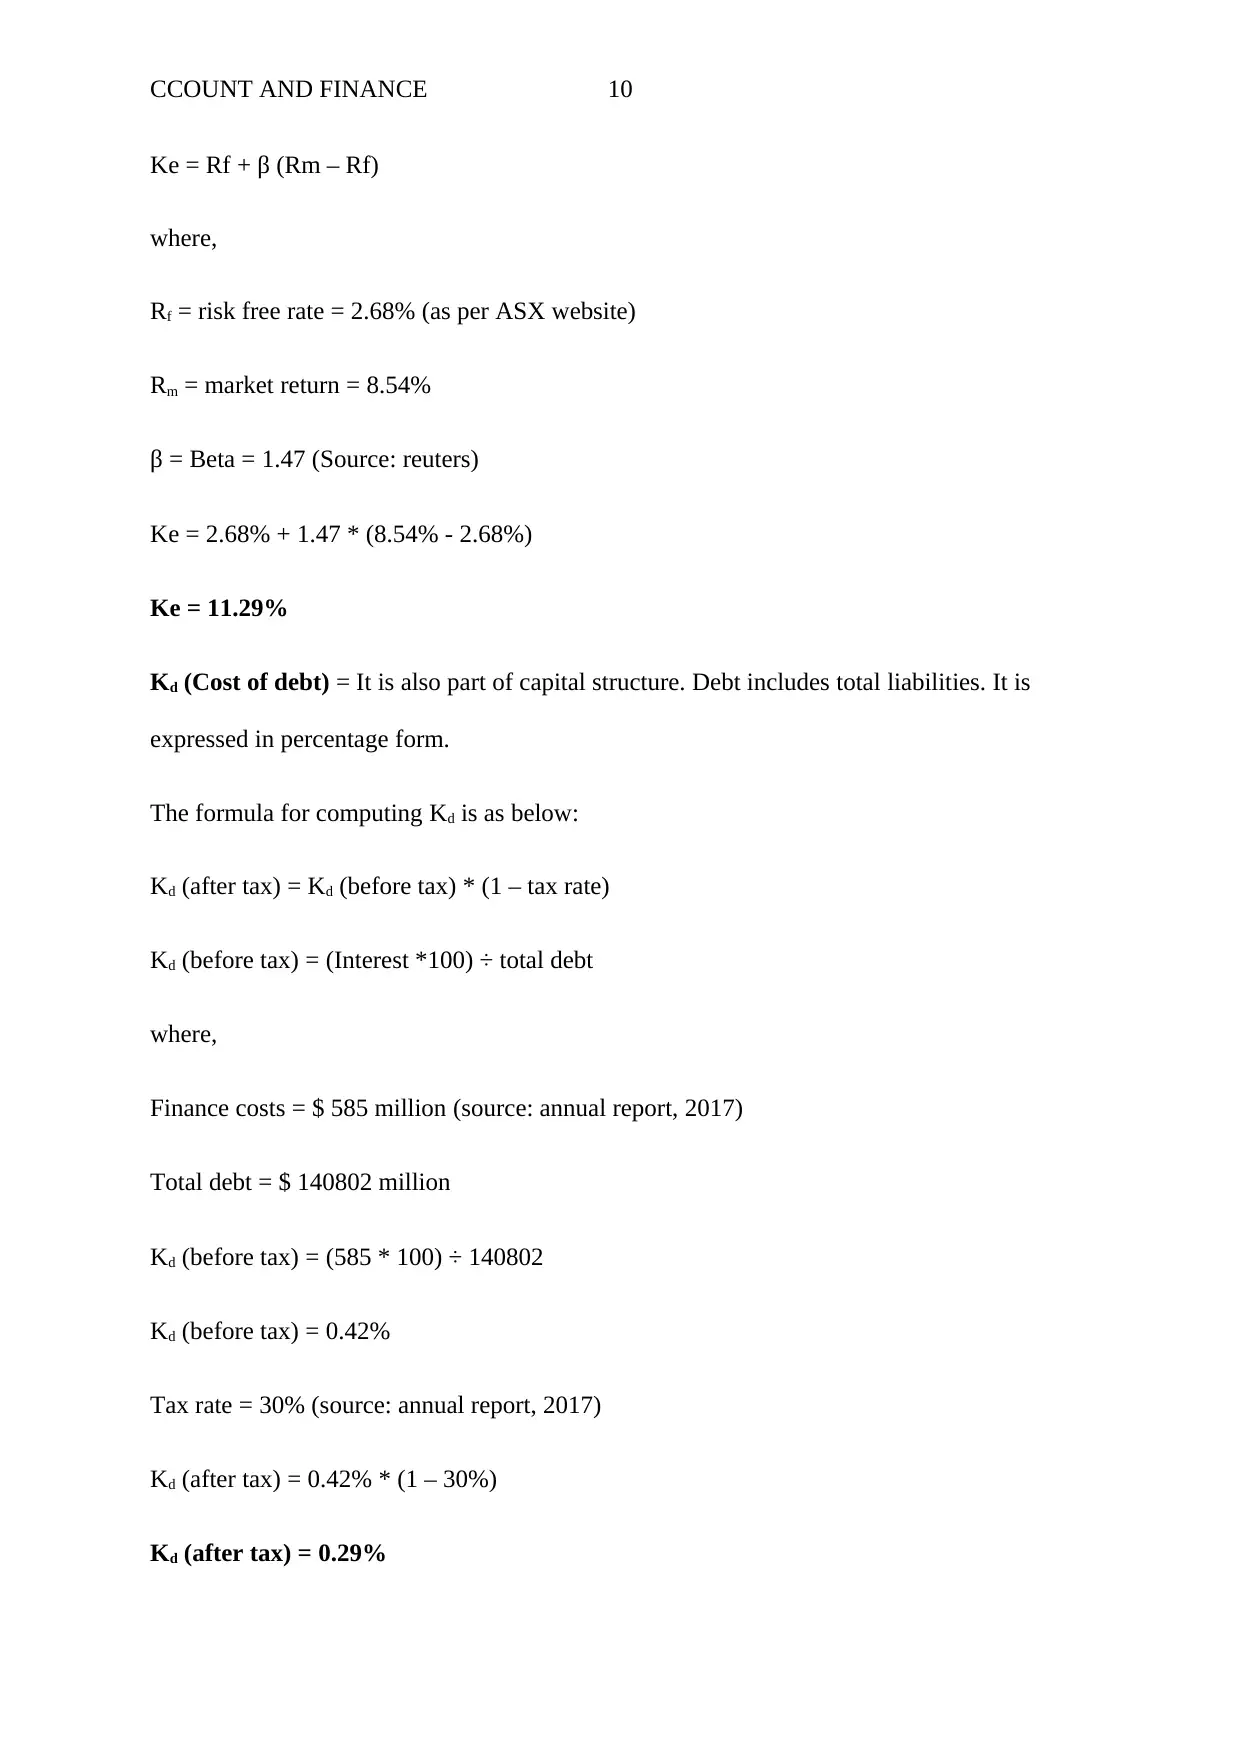
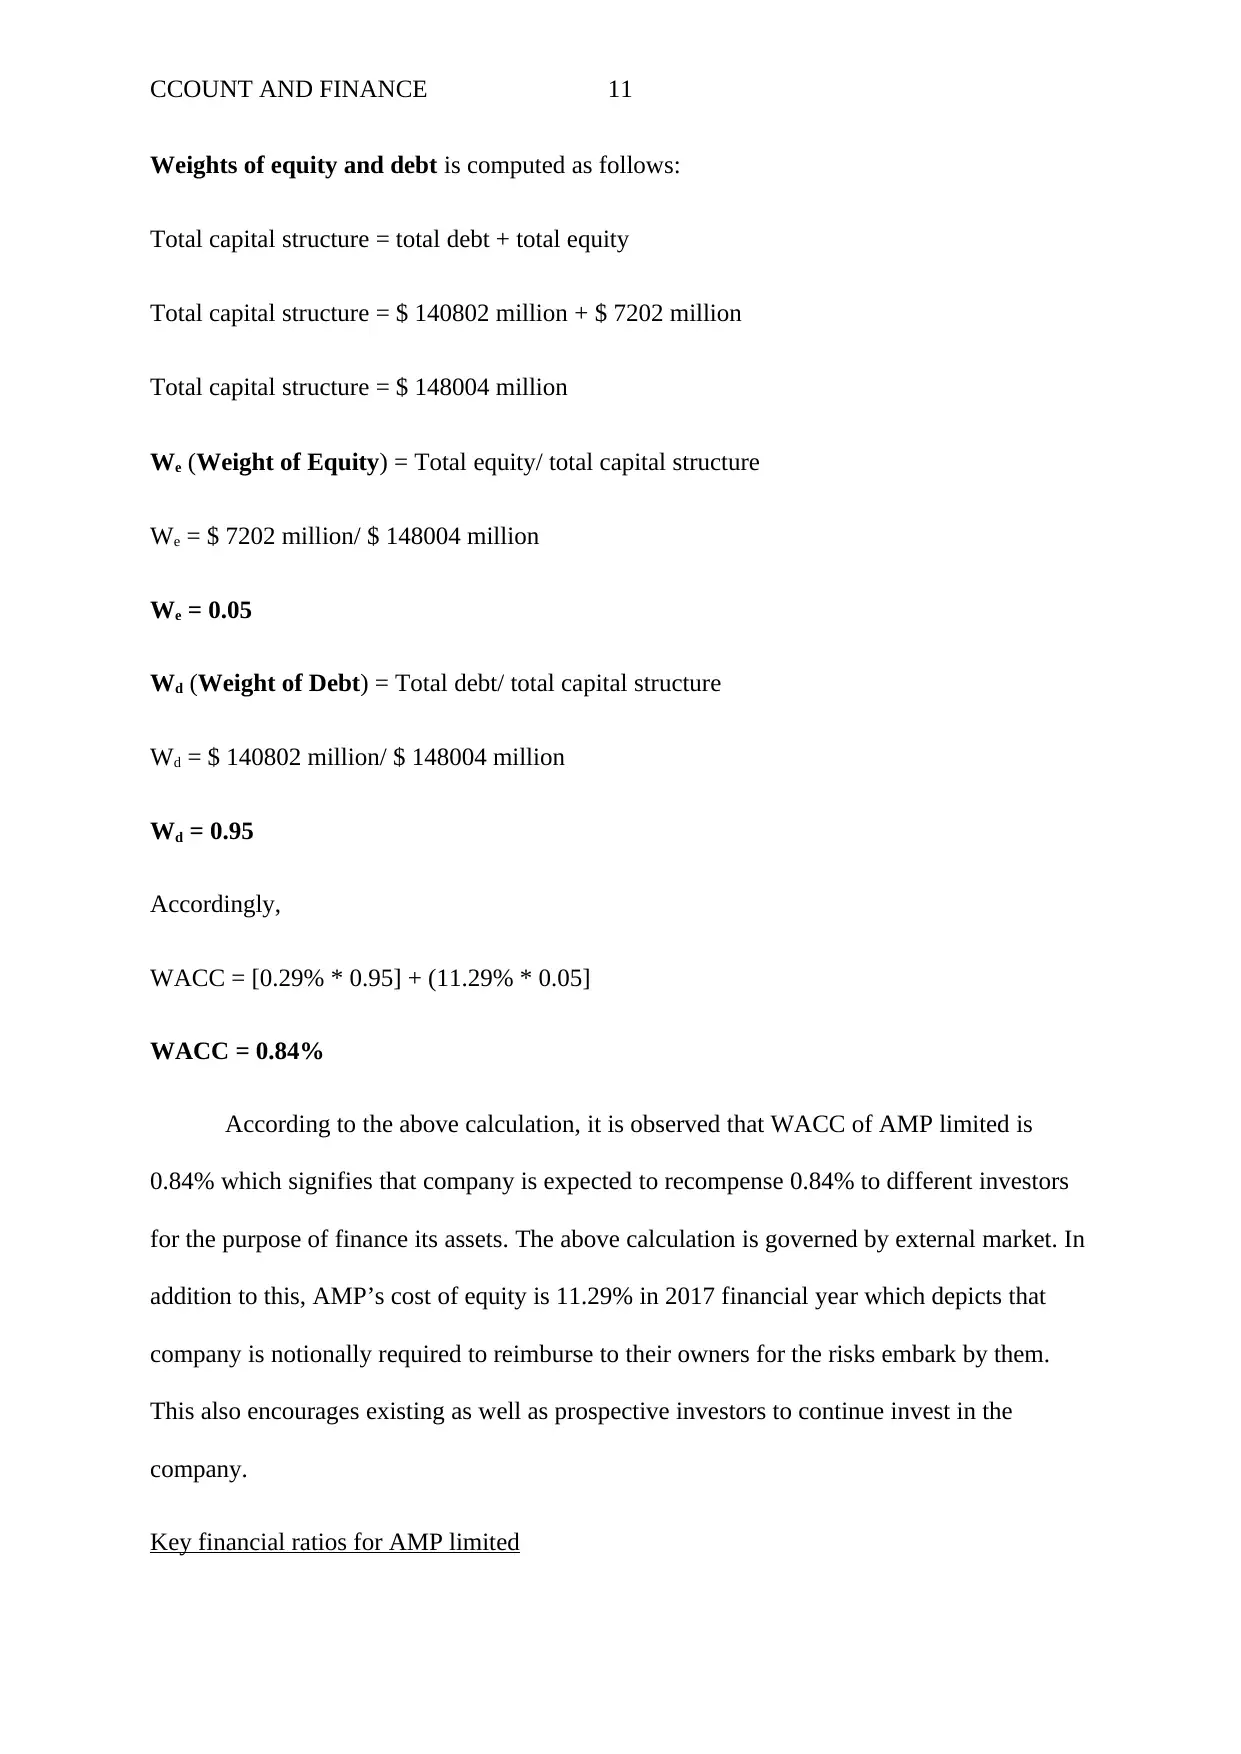
This report provides an analysis of AMP Limited's capital structure, categorizing it into debt and equity, and computes the firm's after-tax weighted average cost of capital (WACC). It assesses the company's financial performance over three years (2017, 2016, and 2015) and compares its capital structure with Australia and New Zealand Banking Group (ANZ). The analysis includes critical financial ratios such as current ratio, net profit ratio, return on equity (ROE), and debt ratio, to evaluate the company's ability to meet short-term obligations, profitability, returns to shareholders, and long-term solvency. The report also identifies and discusses material risks, including market risk and liquidity risk, and concludes that AMP Limited has been successful in managing risks and maximizing wealth generation for shareholders in the past three years.

RUNNING HEAD: ACCOUNT AND FINANCE
ACCOUNT AND FINANCE
ACCOUNT AND FINANCE
Paraphrase This Document
Need a fresh take? Get an instant paraphrase of this document with our AI Paraphraser

CCOUNT AND FINANCE 1
Executive Summary
This assignment covers a report on the capital structure of AMP limited through
categorisation of capital structure into debt and equity portion. AMP Limited is established in
1849 and dealing in providing financial services. In the year 1998, it is listed in Australian
Stock exchange. The company is operated in Australia and New Zealand and providing
financial services including banking, wealth management, superannuation services and
financial planning to the customers. Further this report also covers the computation of firm’s
after tax weighted average cost of capital and on the basis of return on equity it is evaluated
that the company is providing sound returns to the shareholders. In addition to this, the
capital structure of the company is assessed for the previous three years such as 2017, 2016
and 2015 and also comparison is made with Australia and New Zealand Banking Group.
This assignment further provides critical analysis of key financial ratios and this report ends
with providing the conclusion mentioning that AMP limited is successful in managing risks
and wealth generation of the shareholders is also maximised in the past three years.

CCOUNT AND FINANCE 2
Contents
PART B...................................................................................................................................................3
Introduction.......................................................................................................................................3
Conclusion.......................................................................................................................................15
References.......................................................................................................................................16
⊘ This is a preview!⊘
Do you want full access?
Subscribe today to unlock all pages.

Trusted by 1+ million students worldwide

CCOUNT AND FINANCE 3
PART B
Introduction
AMP limited is an Australian based company offering services and solutions across
financial advice, retirement service, lending, capital management, investing, retirement
income and life insurance. AMP was established in Australia in the year 1849 with an
objective that every people should govern their life. Currently the company offers services
globally covering 11 nations in Middle east, Asia, UK, Europe and North America (AMP,
2018).
Further AMP limited has 750000 investors and covering over 3.8 million clients in
New Zealand and Australia and 100000 AMP bank customers (AMP, 2018).
In this assignment, Debt and equity portion is computed for previous years that is
2017, 2016 and 2015. Capital structure is also compared with Australia and New Zealand
Banking Group. Further in this assignment weighted average cost of capital and key financial
ratios are computed (AMP, 2018).
Categorisation of Debt and Equity of AMP limited
Capital Structure of AMP Limited is categorised into Debt and Equity. The figures of
2017, 2016 and 2015 are as follows:
AMP Limited
For the year ended 31st December
Particulars 2017 ($m) 2016 ($m) 2015 ($m)
Debt
Payables 1,752.00 1,852.00 2,031.00
Current tax liabilities 71.00 55.00 271.00
Paraphrase This Document
Need a fresh take? Get an instant paraphrase of this document with our AI Paraphraser

CCOUNT AND FINANCE 4
Provisions 153.00 205.00 197.00
Employee benefits 325.00 271.00 290.00
Other financial liabilities 591.00 1,342.00 1,108.00
Interest-bearing liabilities 21,009.00 17,218.00 17,452.00
Deferred tax liabilities 2,190.00 1,946.00 2,076.00
External unitholder liabilities 14,468.00 13,252.00 13,571.00
Life insurance contract liabilities 23,683.00 24,225.00 23,871.00
Investment contract liabilities 75,235.00 71,579.00 69,848.00
Reinsurance liability – ceded life insurance
contracts 1,296.00 530.00 -
Defined benefit plan liabilities 29.00 44.00 98.00
Total Debt 1,40,802.00 1,32,519.00 1,30,813.00
Equity
Contributed Equity 9,376.00 9,619.00 9,566.00
Reserves -2,010.00 -1,972.00 -1,866.00
Retained Earnings -164.00 -185.00 819.00
Total Equity 7,202.00 7,462.00 8,519.00
(Annual report, 2017; 2016; 2015).
Critical Analysis
1. According to above table, it is observed that in FY 2017 payables are least in
comparison to both previous years. In other words, payables are decreased by 5%
from 2016 and 14% from 2015.
2. Considering employee benefits of AMP limited, it was highest in 2017 as compared to
2016 and 2015 figures which means company has focussed on more benefits on their

CCOUNT AND FINANCE 5
employee welfares. The figures are increased by 20% and 12% from 2016 and 2015
respectively.
3. Further we have observed that life insurance contract and investment contract
obligations are highest in 2017 means figures are increased by 3.25% and 5.55% from
2016 and 2015 respectively.
4. Total equity of AMP limited is lowest in financial year 2017 as compared to 2016 and
2015 figures. The total equity is decreased by 3% from 2016 and 15% from 2015.
Comparison from Australia and New Zealand Banking Group
Capital Structure of Australia and New Zealand Banking Group is categorised into
Debt and Equity. The figures of 2017, 2016 and 2015 are as follows:
ANZ
For the year ended 30th September
Particulars 2017 ($m) 2016 ($m) 2015 ($m)
Debt
Settlement balances owed by ANZ 9,914.00 10,625.00 11,250.00
Collateral received 5,919.00 6,386.00 7,829.00
Deposits and other borrowings 5,95,611.00 5,88,195.00 5,70,794.00
Derivative financial instruments 62,252.00 88,725.00 81,270.00
Current tax liabilities 241.00 188.00 267.00
Deferred tax liabilities
⊘ This is a preview!⊘
Do you want full access?
Subscribe today to unlock all pages.

Trusted by 1+ million students worldwide

CCOUNT AND FINANCE 6
257.00 227.00 249.00
Liabilities held for sale 4,693.00 -
Policy liabilities 37,448.00 36,145.00 35,401.00
External unit holder liabilities (life
insurance funds) 4,435.00 3,333.00 3,291.00
Payables and other liabilities 8,350.00 8,865.00 10,366.00
Employee entitlements 530.00 543.00 -
Other provisions 628.00 666.00 1,074.00
Debt issuances 1,07,973.00 1,13,044.00 1,10,756.00
Total Debt 8,38,251.00 8,56,942.00 8,32,547.00
Equity
Ordinary share capital 29,088.00 28,765.00 28,367.00
Reserves 37.00 1,078.00 1,571.00
Retained Earnings 29,834.00 27,975.00 27,309.00
Total Equity
Paraphrase This Document
Need a fresh take? Get an instant paraphrase of this document with our AI Paraphraser

CCOUNT AND FINANCE 7
58,959.00 57,818.00 57,247.00
(Annual report, 2017; 2016; 2015).
1. Comparing total equity, it is seen that AMP limited has very less equity amount in
comparison to ANZ. The reason is due to negative reserves and retained earnings in
AMP limited of $ 2010 million and $164 million in all the three years.
2017 ($m) 2016 ($m) 2015 ($m)
0
100
200
300
400
500
600
325
271 290
530 543
0
Equity
AMP Limied ANZ
2. The AMP limited has reported current liabilities amounting $ 71 million whereas
ANZ has reported $ 241 million in 2017 whereas deferred tax liabilities was relatively
high in AMP limited as compare to ANZ limited.

CCOUNT AND FINANCE 8
2017 ($m) 2016 ($m) 2015 ($m)
0
100
200
300
400
500
600
325
271 290
530 543
0
Current tax liabilities
AMP Limied ANZ
2017 ($m) 2016 ($m) 2015 ($m)
0
100
200
300
400
500
600
325
271 290
530 543
0
Deferred tax liabilities
AMP Limied ANZ
3. Benefits given to employees are also very low in AMP limited as compared to
entitlements given by ANZ to their employees.
2017 ($m) 2016 ($m) 2015 ($m)
0
100
200
300
400
500
600
325
271 290
530 543
0
Current tax liabilities
AMP Limied ANZ
2017 ($m) 2016 ($m) 2015 ($m)
0
100
200
300
400
500
600
325
271 290
530 543
0
Deferred tax liabilities
AMP Limied ANZ
3. Benefits given to employees are also very low in AMP limited as compared to
entitlements given by ANZ to their employees.
⊘ This is a preview!⊘
Do you want full access?
Subscribe today to unlock all pages.

Trusted by 1+ million students worldwide

CCOUNT AND FINANCE 9
2017 ($m) 2016 ($m) 2015 ($m)
0
100
200
300
400
500
600
325
271 290
530 543
0
Employee benefits
AMP Limied ANZ
Weighted Average cost of capital
WACC is termed as overall cost of capital where each capital of the company is
weighted proportionately. If the WACC is increased, then the risk of the company is also
increased and value of the company is decreased. WACC is symbolized as Ko. WACC is
expressed in percentage form. In this assignment, WACC is calculated for FY 2017.
Mathematical Formula:
WACC = (Cost of debt * weight) + (Cost of equity * weight)
OR
Ko= (Kd* Wd) + (Ke * We)
where,
Ke (Cost of equity) = It is the portion of company’s capital structure. It means the earnings
required by the investors who abide the risk of rights. It is expressed in percentage form.
The formula for computing Ke as per CAPM model is as below:
Paraphrase This Document
Need a fresh take? Get an instant paraphrase of this document with our AI Paraphraser

CCOUNT AND FINANCE 10
Ke = Rf + β (Rm – Rf)
where,
Rf = risk free rate = 2.68% (as per ASX website)
Rm = market return = 8.54%
β = Beta = 1.47 (Source: reuters)
Ke = 2.68% + 1.47 * (8.54% - 2.68%)
Ke = 11.29%
Kd (Cost of debt) = It is also part of capital structure. Debt includes total liabilities. It is
expressed in percentage form.
The formula for computing Kd is as below:
Kd (after tax) = Kd (before tax) * (1 – tax rate)
Kd (before tax) = (Interest *100) ÷ total debt
where,
Finance costs = $ 585 million (source: annual report, 2017)
Total debt = $ 140802 million
Kd (before tax) = (585 * 100) ÷ 140802
Kd (before tax) = 0.42%
Tax rate = 30% (source: annual report, 2017)
Kd (after tax) = 0.42% * (1 – 30%)
Kd (after tax) = 0.29%

CCOUNT AND FINANCE 11
Weights of equity and debt is computed as follows:
Total capital structure = total debt + total equity
Total capital structure = $ 140802 million + $ 7202 million
Total capital structure = $ 148004 million
We (Weight of Equity) = Total equity/ total capital structure
We = $ 7202 million/ $ 148004 million
We = 0.05
Wd (Weight of Debt) = Total debt/ total capital structure
Wd = $ 140802 million/ $ 148004 million
Wd = 0.95
Accordingly,
WACC = [0.29% * 0.95] + (11.29% * 0.05]
WACC = 0.84%
According to the above calculation, it is observed that WACC of AMP limited is
0.84% which signifies that company is expected to recompense 0.84% to different investors
for the purpose of finance its assets. The above calculation is governed by external market. In
addition to this, AMP’s cost of equity is 11.29% in 2017 financial year which depicts that
company is notionally required to reimburse to their owners for the risks embark by them.
This also encourages existing as well as prospective investors to continue invest in the
company.
Key financial ratios for AMP limited
⊘ This is a preview!⊘
Do you want full access?
Subscribe today to unlock all pages.

Trusted by 1+ million students worldwide
1 out of 17
Related Documents

Your All-in-One AI-Powered Toolkit for Academic Success.
+13062052269
info@desklib.com
Available 24*7 on WhatsApp / Email
Unlock your academic potential
Copyright © 2020–2025 A2Z Services. All Rights Reserved. Developed and managed by ZUCOL.