Financial Analysis: AMP and CBA Share Prices and Capital Budgeting
VerifiedAdded on 2023/06/07
|17
|3828
|250
Report
AI Summary
This report provides a financial analysis of AMP and CBA share prices, examining their performance over a five-year period. It delves into key financial metrics, including daily changes, volume, market capitalization, and dividend information. The report explores the impact of the Royal Commission on the financial institutions, discussing the challenges of misalignment between customers and financial service providers, loss of trust, and potential risks within the financial system. The report then transitions into capital budgeting techniques, providing an overview of the Required Rate of Return (RRR), Internal Rate of Return (IRR), and Net Present Value (NPV). It includes the decision rules associated with each method and demonstrates calculations of NPV and IRR for two hypothetical projects, assessing their viability based on the given financial data. The report concludes by highlighting the significance of these financial tools in investment decision-making.

AMP AND CBA SHARE PRICES 1
AMP and CBA share price and Capital budget
By (Student’s Name)
Course
Tutor
University
[Date Submitted]
AMP and CBA share price and Capital budget
By (Student’s Name)
Course
Tutor
University
[Date Submitted]
Paraphrase This Document
Need a fresh take? Get an instant paraphrase of this document with our AI Paraphraser
AMP AND CBA SHARE PRICES 2
Part A
1. AMP located in Australia and New Zealand and headquartered in Sydney is a corporation that
provides superannuation and investment products, financial plans and counsel, insurances and
banking service.
The commonwealth bank of Australia located in the regions; New Zealand, Asia, US and UK are
multinational banking service provider dealing with retail, business and institutional banking
services, management of funding’s, superannuation, insurance, brokering and investing.
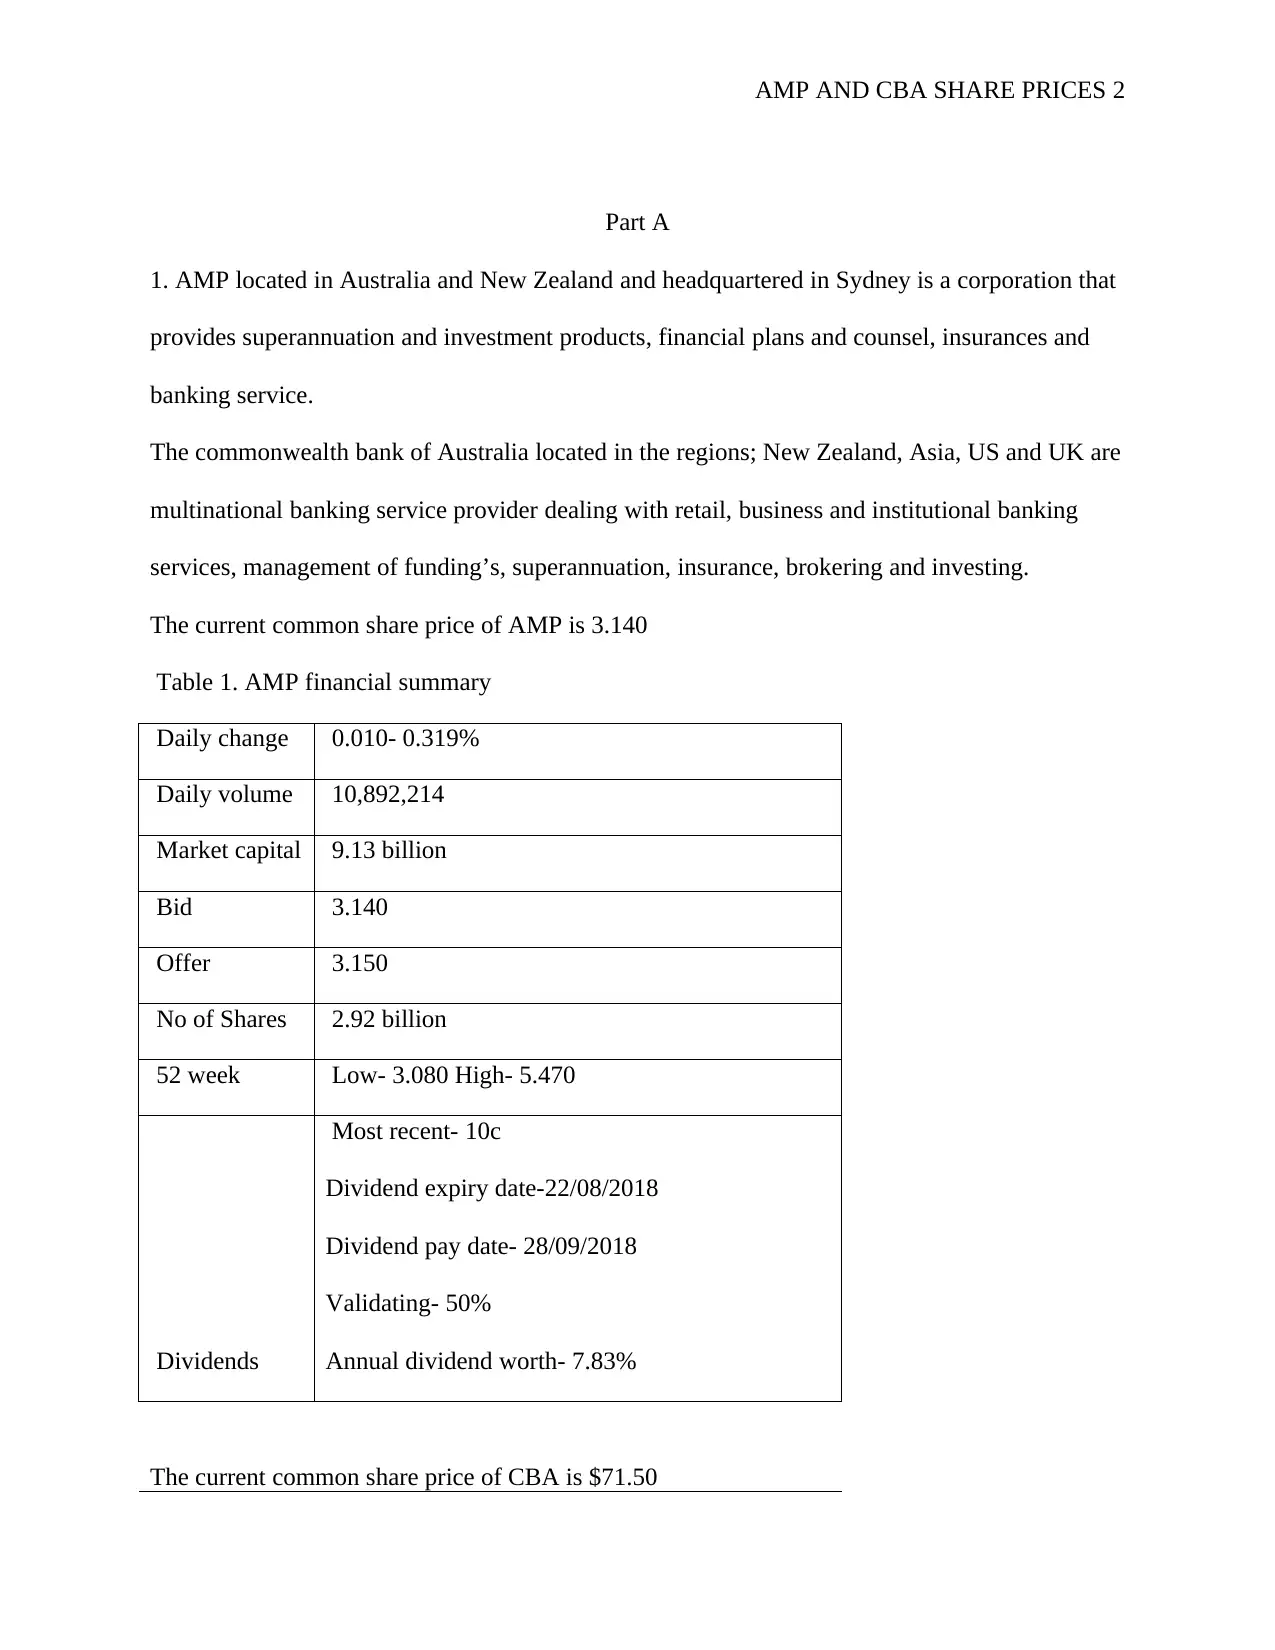
The current common share price of AMP is 3.140
Table 1. AMP financial summary
Daily change 0.010- 0.319%
Daily volume 10,892,214
Market capital 9.13 billion
Bid 3.140
Offer 3.150
No of Shares 2.92 billion
52 week Low- 3.080 High- 5.470
Dividends
Most recent- 10c
Dividend expiry date-22/08/2018
Dividend pay date- 28/09/2018
Validating- 50%
Annual dividend worth- 7.83%
The current common share price of CBA is $71.50
Part A
1. AMP located in Australia and New Zealand and headquartered in Sydney is a corporation that
provides superannuation and investment products, financial plans and counsel, insurances and
banking service.
The commonwealth bank of Australia located in the regions; New Zealand, Asia, US and UK are
multinational banking service provider dealing with retail, business and institutional banking
services, management of funding’s, superannuation, insurance, brokering and investing.
The current common share price of AMP is 3.140
Table 1. AMP financial summary
Daily change 0.010- 0.319%
Daily volume 10,892,214
Market capital 9.13 billion
Bid 3.140
Offer 3.150
No of Shares 2.92 billion
52 week Low- 3.080 High- 5.470
Dividends
Most recent- 10c
Dividend expiry date-22/08/2018
Dividend pay date- 28/09/2018
Validating- 50%
Annual dividend worth- 7.83%
The current common share price of CBA is $71.50
14.5
0
10
20
30
2016201520142013 2017
12.5
14
14
14.5
13.5
14
14
26
28
28
29
11.5 11.5 23
201 5 201742013201
6201
$884m
m
$972m
$848m
$672m
0
250
500
750
1,000
1,250
0
250
500
750
1,000
1,250
201520142013 2016 2017
$1,045m
$1,120m
$486m
$1,040m
$849m
AMP AND CBA SHARE PRICES 3
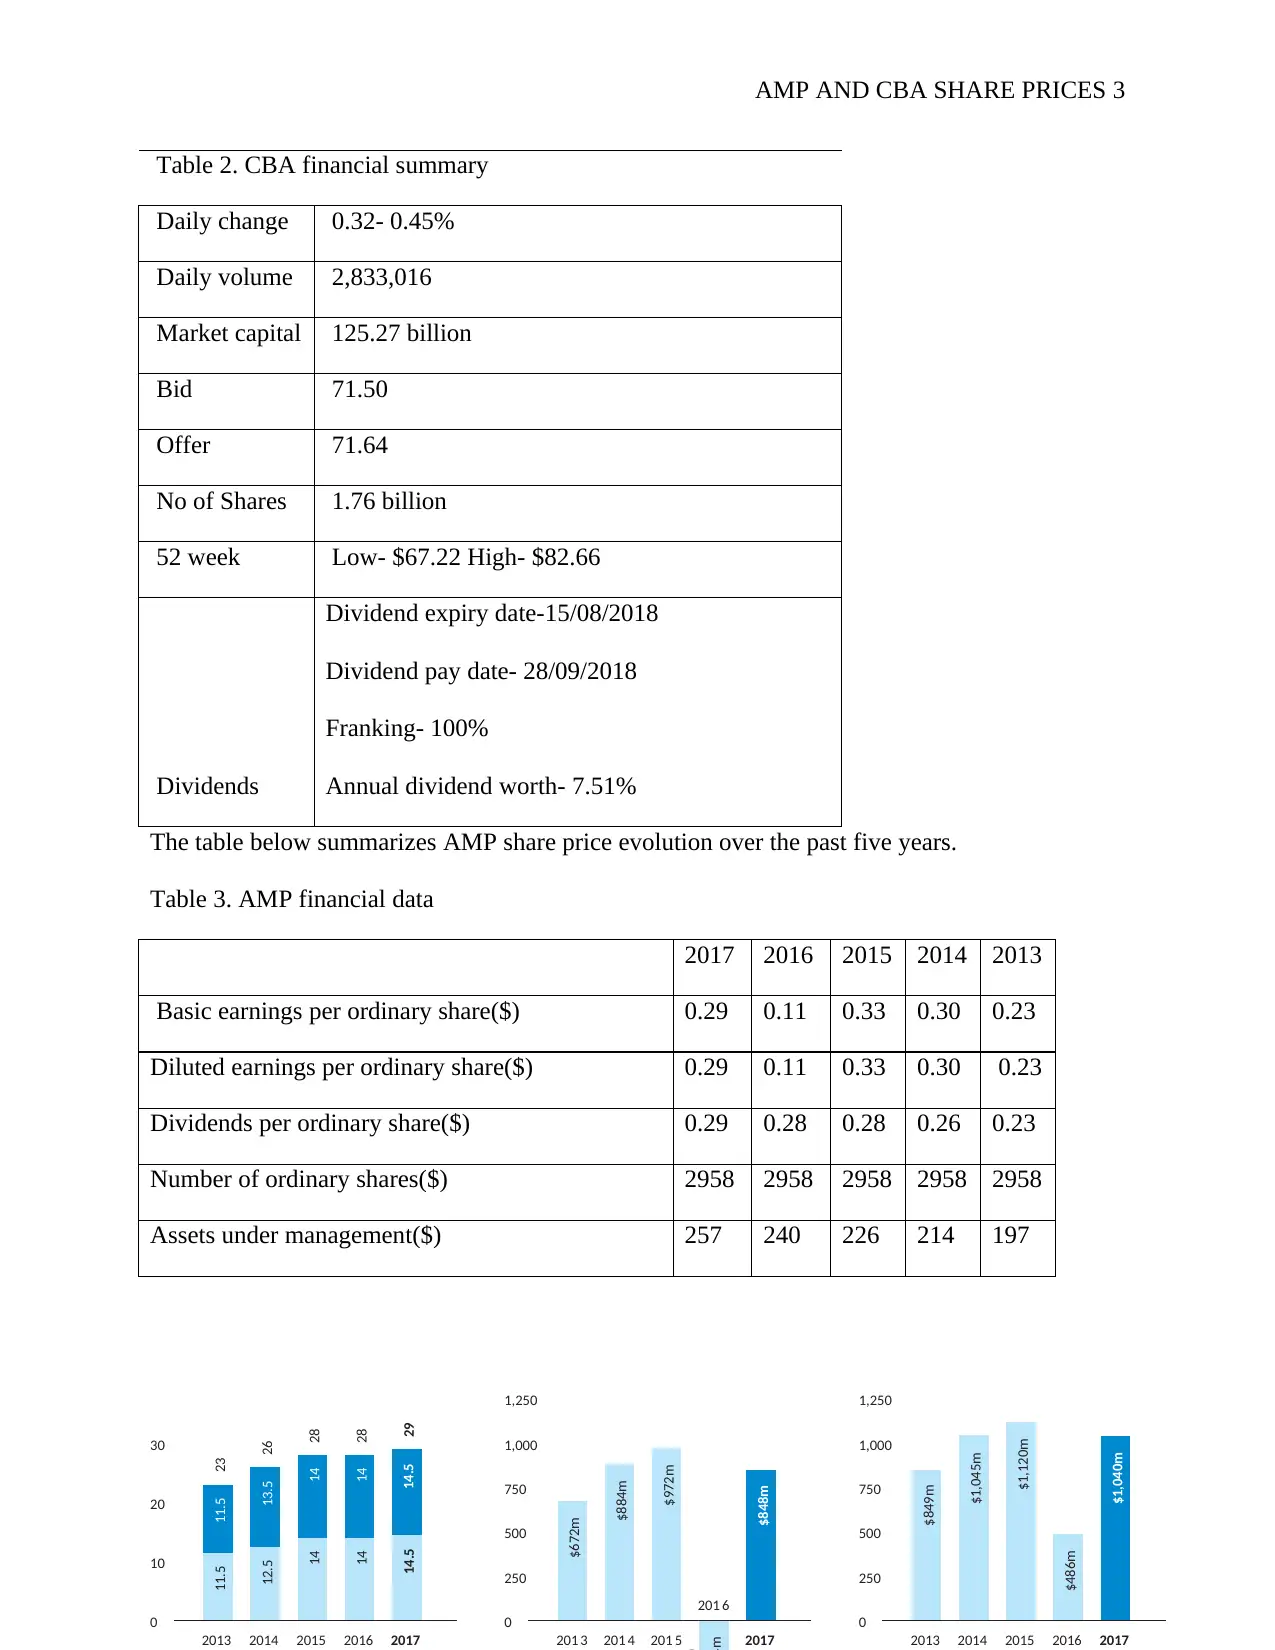
Table 2. CBA financial summary
Daily change 0.32- 0.45%
Daily volume 2,833,016
Market capital 125.27 billion
Bid 71.50
Offer 71.64
No of Shares 1.76 billion
52 week Low- $67.22 High- $82.66
Dividends
Dividend expiry date-15/08/2018
Dividend pay date- 28/09/2018
Franking- 100%
Annual dividend worth- 7.51%
The table below summarizes AMP share price evolution over the past five years.
Table 3. AMP financial data
2017 2016 2015 2014 2013
Basic earnings per ordinary share($) 0.29 0.11 0.33 0.30 0.23
Diluted earnings per ordinary share($) 0.29 0.11 0.33 0.30 0.23
Dividends per ordinary share($) 0.29 0.28 0.28 0.26 0.23
Number of ordinary shares($) 2958 2958 2958 2958 2958
Assets under management($) 257 240 226 214 197
0
10
20
30
2016201520142013 2017
12.5
14
14
14.5
13.5
14
14
26
28
28
29
11.5 11.5 23
201 5 201742013201
6201
$884m
m
$972m
$848m
$672m
0
250
500
750
1,000
1,250
0
250
500
750
1,000
1,250
201520142013 2016 2017
$1,045m
$1,120m
$486m
$1,040m
$849m
AMP AND CBA SHARE PRICES 3
Table 2. CBA financial summary
Daily change 0.32- 0.45%
Daily volume 2,833,016
Market capital 125.27 billion
Bid 71.50
Offer 71.64
No of Shares 1.76 billion
52 week Low- $67.22 High- $82.66
Dividends
Dividend expiry date-15/08/2018
Dividend pay date- 28/09/2018
Franking- 100%
Annual dividend worth- 7.51%
The table below summarizes AMP share price evolution over the past five years.
Table 3. AMP financial data
2017 2016 2015 2014 2013
Basic earnings per ordinary share($) 0.29 0.11 0.33 0.30 0.23
Diluted earnings per ordinary share($) 0.29 0.11 0.33 0.30 0.23
Dividends per ordinary share($) 0.29 0.28 0.28 0.26 0.23
Number of ordinary shares($) 2958 2958 2958 2958 2958
Assets under management($) 257 240 226 214 197
⊘ This is a preview!⊘
Do you want full access?
Subscribe today to unlock all pages.
Trusted by 1+ million students worldwide
(
AMP AND CBA SHARE PRICES 4
The dividend of 14.5 cents/share was due on 28/03/2018 and will have a franking of 90%.
$837m returned to shareholders was in the form of dividends and there were dividend
reinvestment plan shares in 2017. (Manager, 2018)
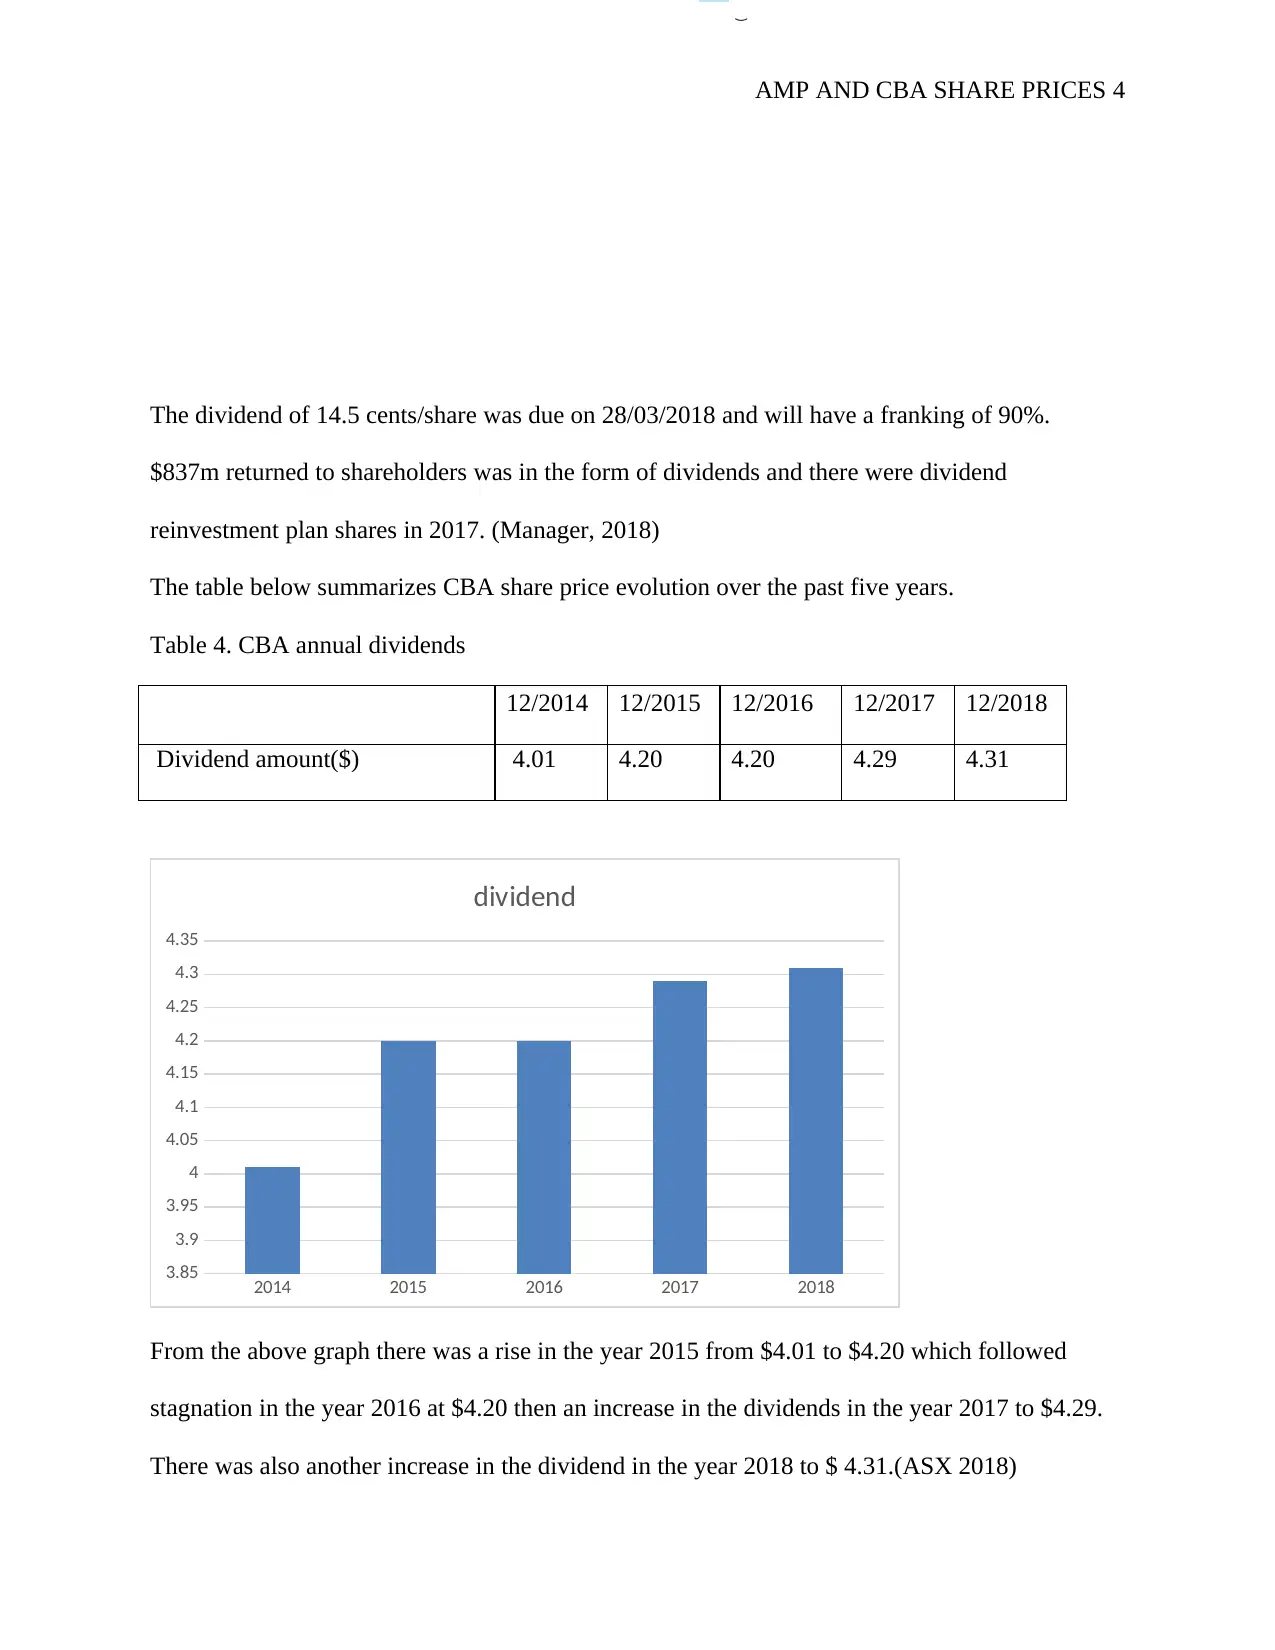
The table below summarizes CBA share price evolution over the past five years.
Table 4. CBA annual dividends
12/2014 12/2015 12/2016 12/2017 12/2018
Dividend amount($) 4.01 4.20 4.20 4.29 4.31
2014 2015 2016 2017 2018
3.85
3.9
3.95
4
4.05
4.1
4.15
4.2
4.25
4.3
4.35
dividend
From the above graph there was a rise in the year 2015 from $4.01 to $4.20 which followed
stagnation in the year 2016 at $4.20 then an increase in the dividends in the year 2017 to $4.29.
There was also another increase in the dividend in the year 2018 to $ 4.31.(ASX 2018)
AMP AND CBA SHARE PRICES 4
The dividend of 14.5 cents/share was due on 28/03/2018 and will have a franking of 90%.
$837m returned to shareholders was in the form of dividends and there were dividend
reinvestment plan shares in 2017. (Manager, 2018)
The table below summarizes CBA share price evolution over the past five years.
Table 4. CBA annual dividends
12/2014 12/2015 12/2016 12/2017 12/2018
Dividend amount($) 4.01 4.20 4.20 4.29 4.31
2014 2015 2016 2017 2018
3.85
3.9
3.95
4
4.05
4.1
4.15
4.2
4.25
4.3
4.35
dividend
From the above graph there was a rise in the year 2015 from $4.01 to $4.20 which followed
stagnation in the year 2016 at $4.20 then an increase in the dividends in the year 2017 to $4.29.
There was also another increase in the dividend in the year 2018 to $ 4.31.(ASX 2018)
Paraphrase This Document
Need a fresh take? Get an instant paraphrase of this document with our AI Paraphraser
AMP AND CBA SHARE PRICES 5
2. Royal commission objective was to restore trust and confidence and maintain the already
existing stability in the economic sector. Banks are vulnerable to economic fluctuations because
of their reliance on higher financial leverage. Banks are opaque to most of their customers
therefore the royal commission results in loss of confidence hence expected less deposits. This
may be because the royal commission inquiries into the following matters.
First is misconduct in financial service providers. Secondly is any conduct by a financial service
provider that stoops below the population’s expectations and also superannuation of an
individual retirement savings that do not coordinate with the community’s expectations among
others.
From the royal commission the following can be observed from both the systematic and
unsystematic risk.
First there is a challenge of misalignment in relation to the customer and their financial service
provider.
There is loss of trust in the financial system due to less effective powers in the tackling of illegal
behaviors.
Lastly there is a potential risk that of negative sentiment spilling in the larger finances system.
The main aim of royal commission is tackling misconduct which includes fairness and
fulfillment of a community’s expectations. Complaints resulting from financial counsel will and
insurance claims will result in compensations and this will also elevate ASIC
Inquiring by the royal commission has led to attacks on the banks by political principles. .
The impactful role by the royal commission is regarding the costs placed on consumers,
competition and financial stability of the system is key in provision of financial counsel and
insurance matters and it is most impactful when it comes to loans.
AMP AND CBA SHARE PRICES 6
The royal commission’s findings by Hayne could result in permanent damage of AMP’s
franchise. There was a fall in stock by 4.4% which will lead to a price of $4.55. $600 billion as
deleted from the company’s asset worth 13 billion having recently traded 18 million shares.
From the finding a cost less than $4 million was utilized in the company’s customer remediating
procedure. The company also faced a major challenge as 15000 of its clients were being charged
not following the protocol while giving financial counsel. There were also charges of charging
for services not rendered.
There is a possibility of long-term scar on the AMP’ image resulting from Hayne’s findings.
AMP require major changes which fall among the responsibilities of the new.
The royal commission has produced evidence indicating that CBA has been charging already
dead clientele for financial counsel which has been done for the past ten years. The executive
general manager also recently admitted that the CBA financial planning still kept accepting
commissions from clients registered after July 2013 although the Fofa laws had been enacted.
Findings by the royal commission also revealed that there were ignored complaints by customers
about services not rendered being charged for over six years. This followed by CBA admitting to
charging for financial advice not given. From this revelation it is clear that both CBA and AMP’s
images have been tarnished and there is unexpected reduction in their share prices in the near
future.
Part B
Overview of Required Rate of Return (RRR) and the Internal Rate of Return (IRR)
Both are metrics used to account for the performance of particular investment overtime (Robson,
2017). In as much as they sound similar, it is worth noting that they describe the investment
performance in very different terms altogether. In simple terms, the RRR is the least return that a
⊘ This is a preview!⊘
Do you want full access?
Subscribe today to unlock all pages.
Trusted by 1+ million students worldwide
AMP AND CBA SHARE PRICES 7
particular company requires on its investments or projects that compensates them for a given
level of risk before proceeding with such investments. It is also known as the hurdle rate.
Essentially, the required rate of return is often an arbitrary figure that often differs from company
to company. Nevertheless, the required rate of return is often unrelated to the cost of funds
(Robson, 2017). On the other hand, the internal rate of return is the discount rate that when
functional to a series of cash flows outcome in a net present value of zero.
Decision Rule of RRR and IRR
There are certain decision rules that are used hand in hand with the RRR and the IRR. In essence,
the decision rule in the required rate of return is such that if the NPV of the required rate of
return is greater than zero for a given project, then the project passes the test and hence qualifies
to be evaluated further, if the RRR is a lesser amount than zero then the project fails the test and
hence is discarded in as much as it could be a great project. On the other hand, the rule that is
used as decision in the IRR is such that when the computed internal rate of return is greater than
the cost of capital, then the project should be taken and if the IRR is the same to the cost of
capital, then the managers should be indifferent, and if the IRR is a lesser amount of than the cost
of capital, then the project should be cast off. Hence, while selecting two projects that are equally
elite, the one with the highest internal rate of return ought to be chosen as long as the computed
rate is more than the cost of capital.
Overview of Net Present Value (NPV)
The Net Present Value (NPV) is a metric used to indicate the expected impact of a particular
project on the value of a firm or company (Zen Wealth, 2016). Essentially, projects with a
positive NPV are viewed with the expectation that they shall increase the value of the firm while
Paraphrase This Document
Need a fresh take? Get an instant paraphrase of this document with our AI Paraphraser
AMP AND CBA SHARE PRICES 8
those with a negative NPV are considered to be of a negative impact on the firm’s value (Zen
Wealth, 2016). Thus, the NPV decision rule is such that all independent projects whose NPV is
positive should be accepted. Nevertheless, when faced with the decision to choose among
projects that are mutually exclusive, the project that generates the largest/highest (positive)
should be chosen.
Calculation of Net Present Value (NPV)
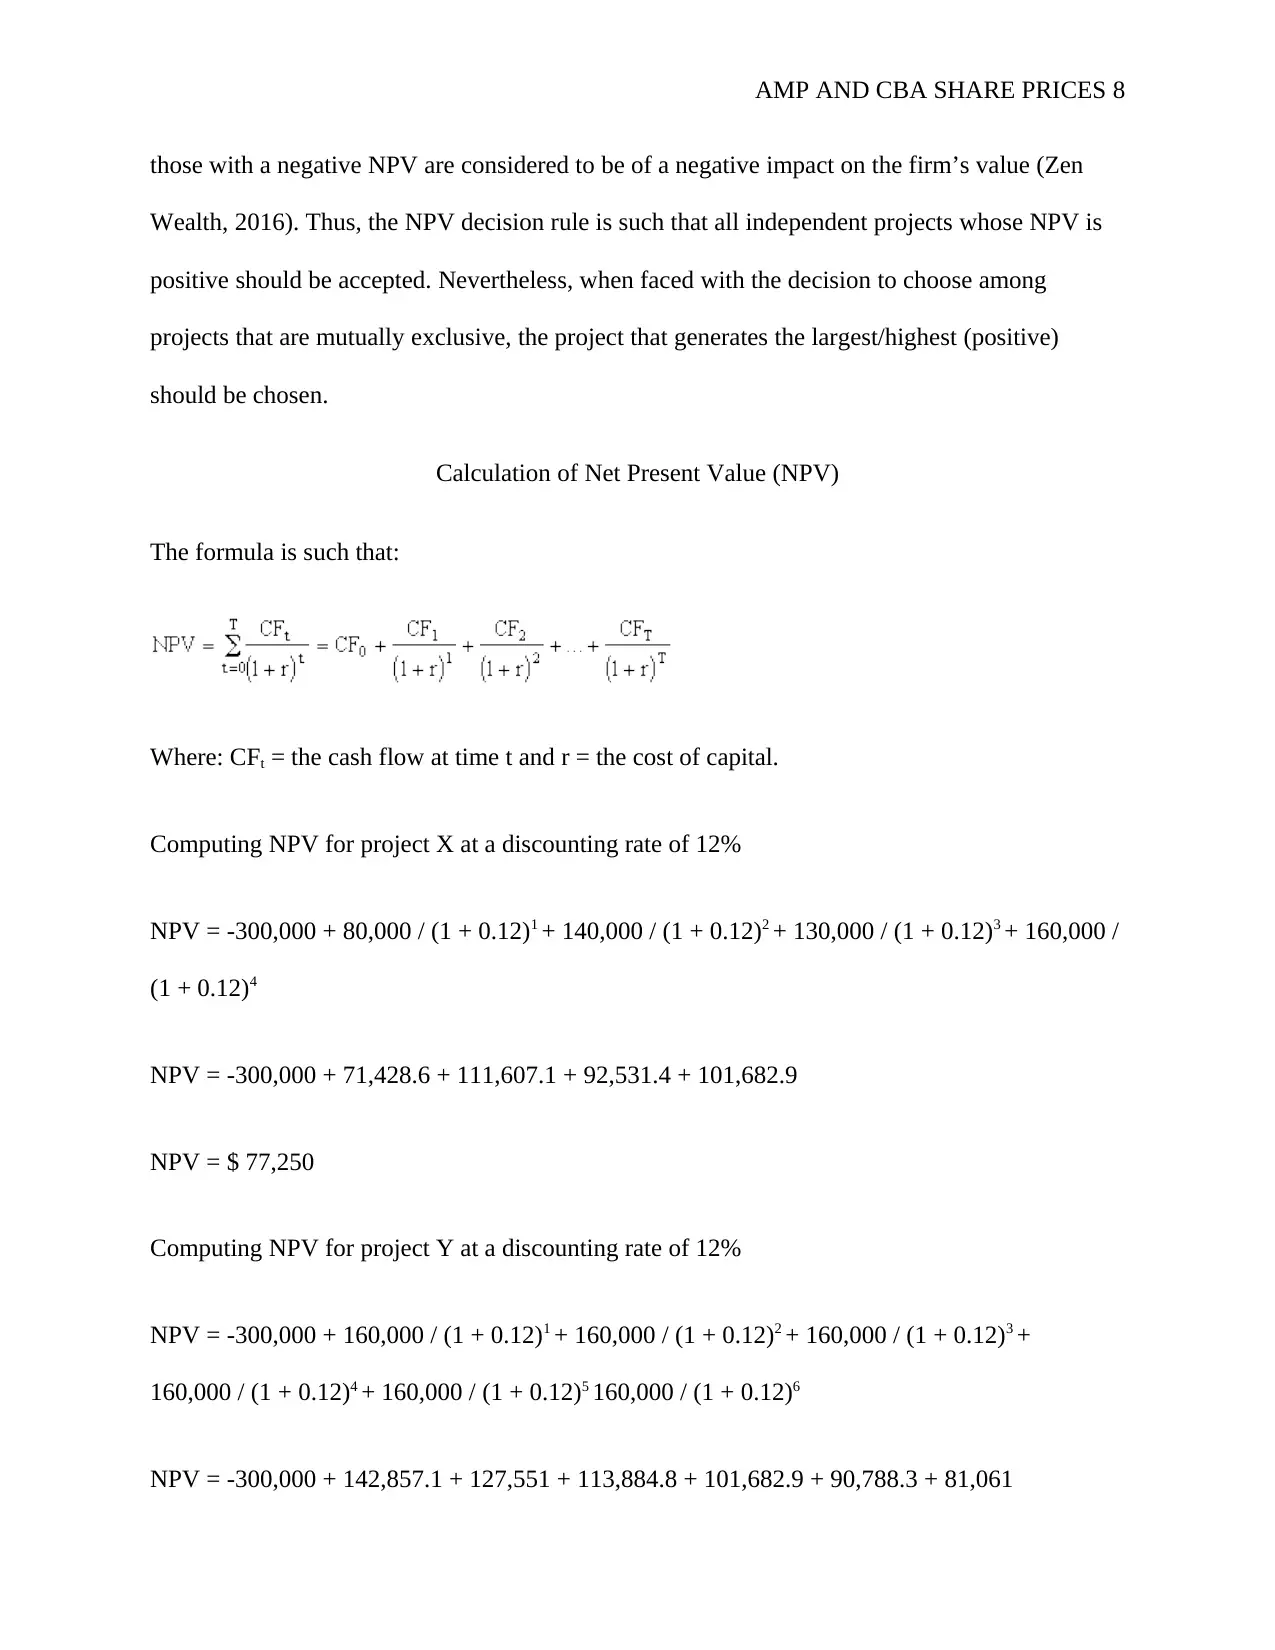
The formula is such that:
Where: CFt = the cash flow at time t and r = the cost of capital.
Computing NPV for project X at a discounting rate of 12%
NPV = -300,000 + 80,000 / (1 + 0.12)1 + 140,000 / (1 + 0.12)2 + 130,000 / (1 + 0.12)3 + 160,000 /
(1 + 0.12)4
NPV = -300,000 + 71,428.6 + 111,607.1 + 92,531.4 + 101,682.9
NPV = $ 77,250
Computing NPV for project Y at a discounting rate of 12%
NPV = -300,000 + 160,000 / (1 + 0.12)1 + 160,000 / (1 + 0.12)2 + 160,000 / (1 + 0.12)3 +
160,000 / (1 + 0.12)4 + 160,000 / (1 + 0.12)5 160,000 / (1 + 0.12)6
NPV = -300,000 + 142,857.1 + 127,551 + 113,884.8 + 101,682.9 + 90,788.3 + 81,061
those with a negative NPV are considered to be of a negative impact on the firm’s value (Zen
Wealth, 2016). Thus, the NPV decision rule is such that all independent projects whose NPV is
positive should be accepted. Nevertheless, when faced with the decision to choose among
projects that are mutually exclusive, the project that generates the largest/highest (positive)
should be chosen.
Calculation of Net Present Value (NPV)
The formula is such that:
Where: CFt = the cash flow at time t and r = the cost of capital.
Computing NPV for project X at a discounting rate of 12%
NPV = -300,000 + 80,000 / (1 + 0.12)1 + 140,000 / (1 + 0.12)2 + 130,000 / (1 + 0.12)3 + 160,000 /
(1 + 0.12)4
NPV = -300,000 + 71,428.6 + 111,607.1 + 92,531.4 + 101,682.9
NPV = $ 77,250
Computing NPV for project Y at a discounting rate of 12%
NPV = -300,000 + 160,000 / (1 + 0.12)1 + 160,000 / (1 + 0.12)2 + 160,000 / (1 + 0.12)3 +
160,000 / (1 + 0.12)4 + 160,000 / (1 + 0.12)5 160,000 / (1 + 0.12)6
NPV = -300,000 + 142,857.1 + 127,551 + 113,884.8 + 101,682.9 + 90,788.3 + 81,061
AMP AND CBA SHARE PRICES 9
NPV = $357,825.1 ≈ $357,825
Decision Rule of NPV:
Both projects should be accepted because they yield a positive Net Present Value as calculated
above.
Calculation of IRR
The IRR formula is such that:
IRR = lower rate + [(NPV at the lower rate) / (Absolute sum of NPVs)] x Difference in the rates
Here, we already have the NPV at 12% for both projects. Hence, we can calculate the NPV at a
lower rate of 7% and also NPV at a higher rate of 16%.
NPV at a lower rate of 7%
PROJECT X:
NPV @ 7% = -300,000 + 80,000 / (1 + 0.07)1 + 140,000 / (1 + 0.07)2 + 130,000 / (1 + 0.07)3 +
160,000 / (1 + 0.07)4
NPV = -300,000 + 74,766.4 + 122,281.4 + 106,118.7 + 122,063.2
NPV = $ 125,229.7 ≈ $125,230
PROJECT Y
⊘ This is a preview!⊘
Do you want full access?
Subscribe today to unlock all pages.
Trusted by 1+ million students worldwide
AMP AND CBA SHARE PRICES 10
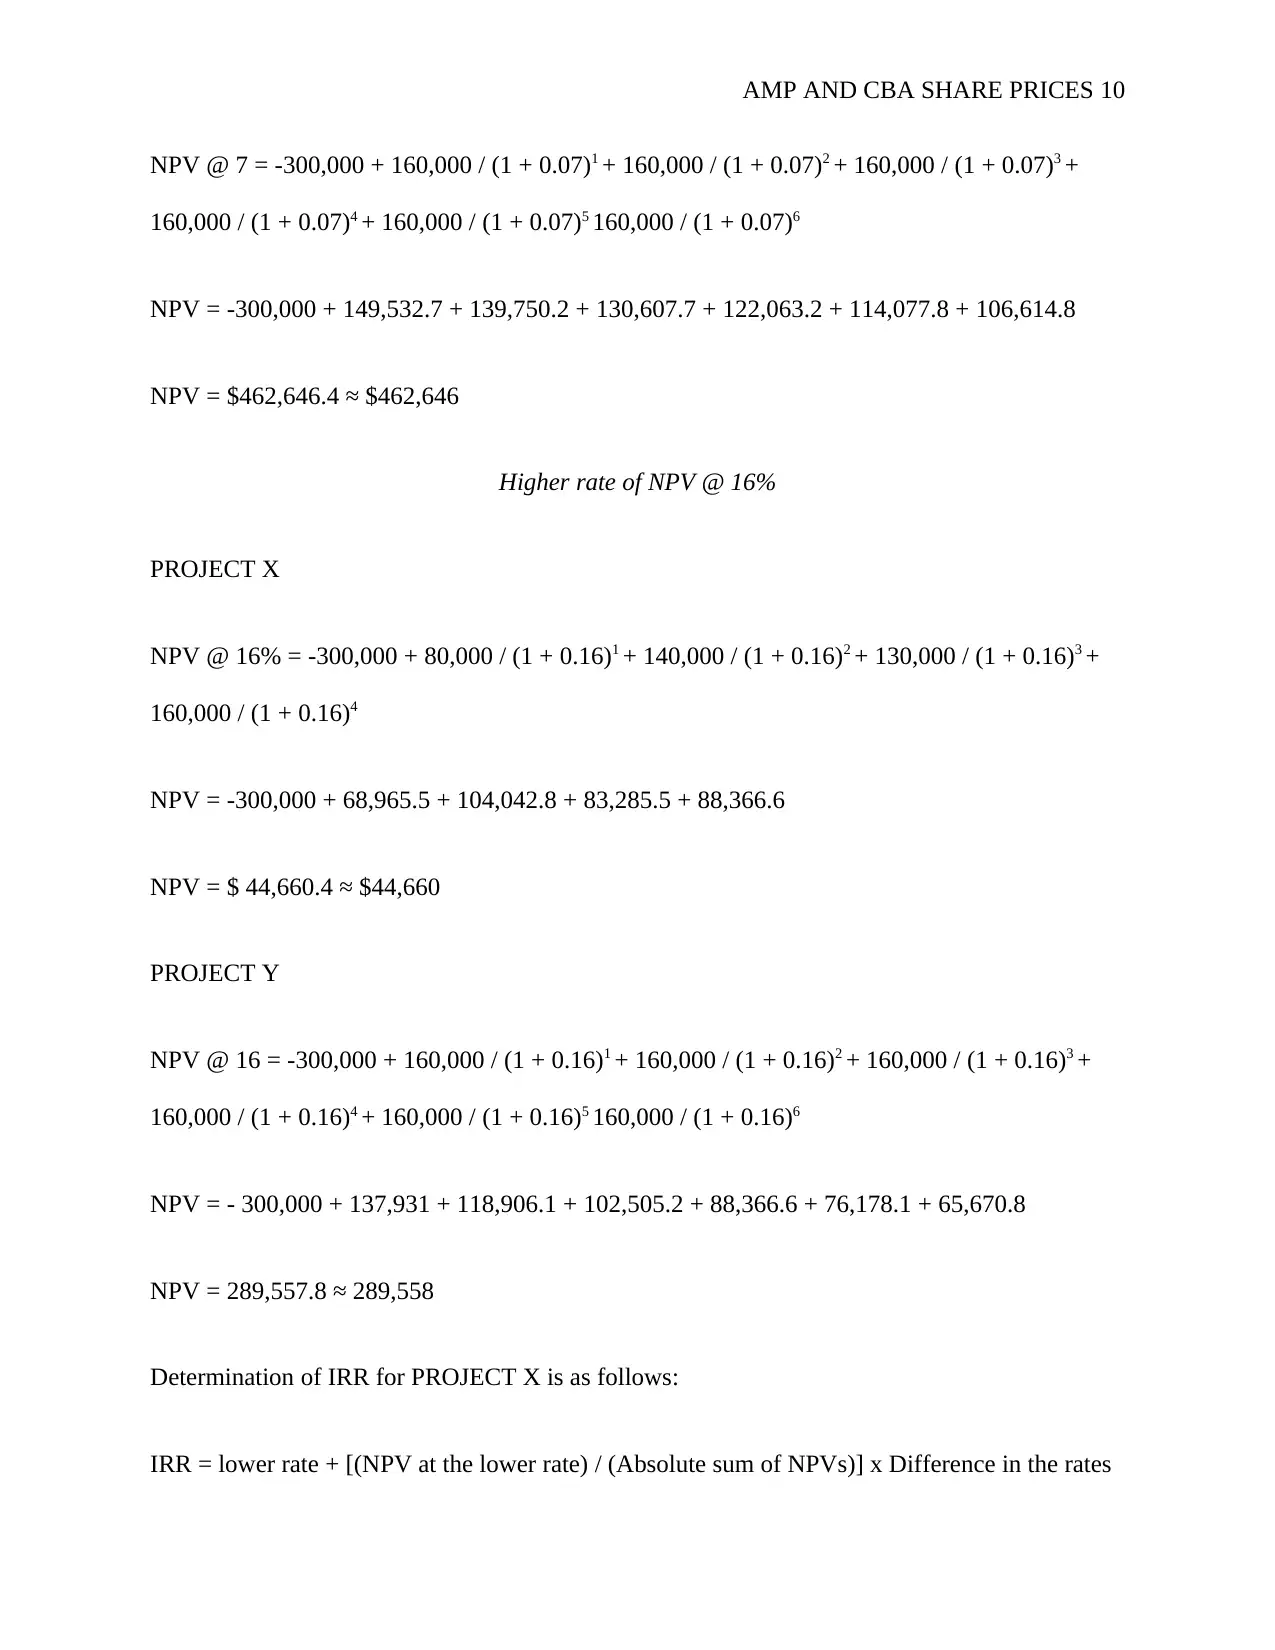
NPV @ 7 = -300,000 + 160,000 / (1 + 0.07)1 + 160,000 / (1 + 0.07)2 + 160,000 / (1 + 0.07)3 +
160,000 / (1 + 0.07)4 + 160,000 / (1 + 0.07)5 160,000 / (1 + 0.07)6
NPV = -300,000 + 149,532.7 + 139,750.2 + 130,607.7 + 122,063.2 + 114,077.8 + 106,614.8
NPV = $462,646.4 ≈ $462,646
Higher rate of NPV @ 16%
PROJECT X
NPV @ 16% = -300,000 + 80,000 / (1 + 0.16)1 + 140,000 / (1 + 0.16)2 + 130,000 / (1 + 0.16)3 +
160,000 / (1 + 0.16)4
NPV = -300,000 + 68,965.5 + 104,042.8 + 83,285.5 + 88,366.6
NPV = $ 44,660.4 ≈ $44,660
PROJECT Y
NPV @ 16 = -300,000 + 160,000 / (1 + 0.16)1 + 160,000 / (1 + 0.16)2 + 160,000 / (1 + 0.16)3 +
160,000 / (1 + 0.16)4 + 160,000 / (1 + 0.16)5 160,000 / (1 + 0.16)6
NPV = - 300,000 + 137,931 + 118,906.1 + 102,505.2 + 88,366.6 + 76,178.1 + 65,670.8
NPV = 289,557.8 ≈ 289,558
Determination of IRR for PROJECT X is as follows:
IRR = lower rate + [(NPV at the lower rate) / (Absolute sum of NPVs)] x Difference in the rates
Paraphrase This Document
Need a fresh take? Get an instant paraphrase of this document with our AI Paraphraser
AMP AND CBA SHARE PRICES 11
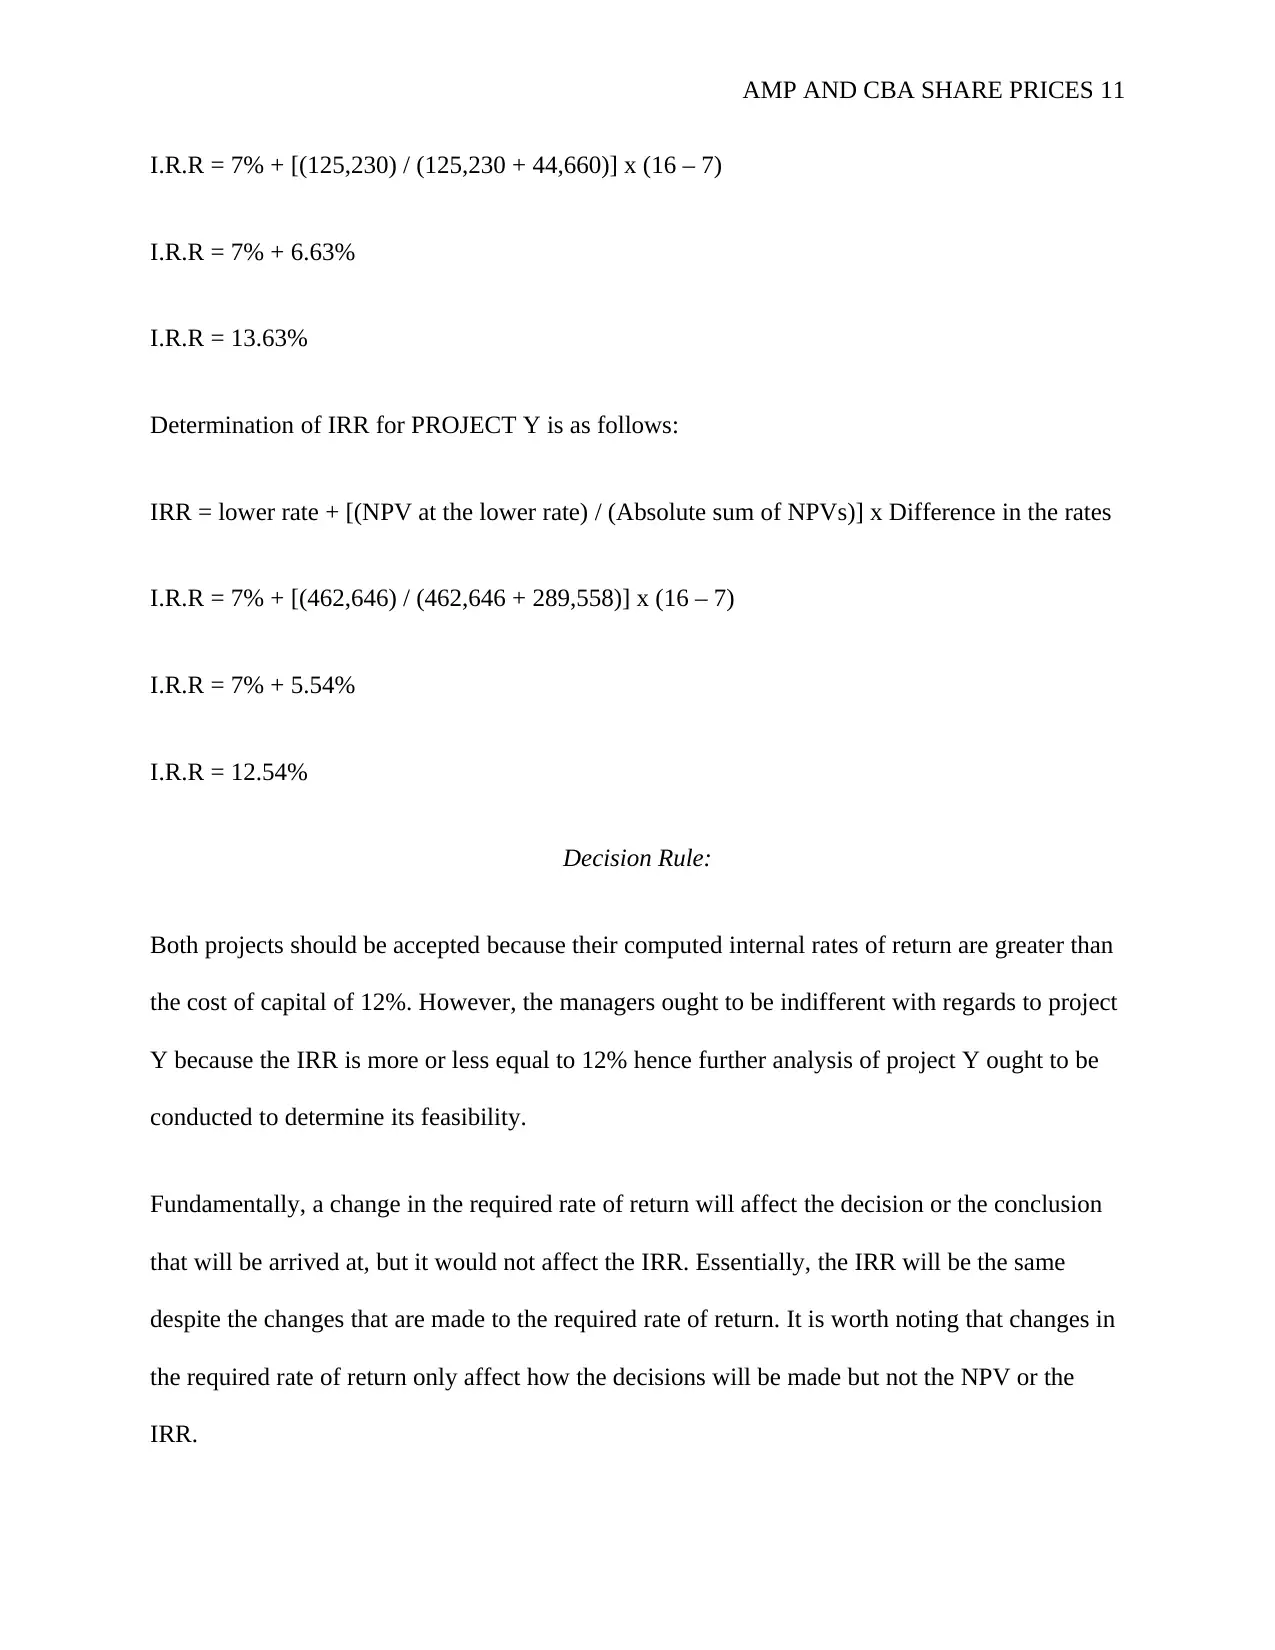
I.R.R = 7% + [(125,230) / (125,230 + 44,660)] x (16 – 7)
I.R.R = 7% + 6.63%
I.R.R = 13.63%
Determination of IRR for PROJECT Y is as follows:
IRR = lower rate + [(NPV at the lower rate) / (Absolute sum of NPVs)] x Difference in the rates
I.R.R = 7% + [(462,646) / (462,646 + 289,558)] x (16 – 7)
I.R.R = 7% + 5.54%
I.R.R = 12.54%
Decision Rule:
Both projects should be accepted because their computed internal rates of return are greater than
the cost of capital of 12%. However, the managers ought to be indifferent with regards to project
Y because the IRR is more or less equal to 12% hence further analysis of project Y ought to be
conducted to determine its feasibility.
Fundamentally, a change in the required rate of return will affect the decision or the conclusion
that will be arrived at, but it would not affect the IRR. Essentially, the IRR will be the same
despite the changes that are made to the required rate of return. It is worth noting that changes in
the required rate of return only affect how the decisions will be made but not the NPV or the
IRR.
AMP AND CBA SHARE PRICES 12
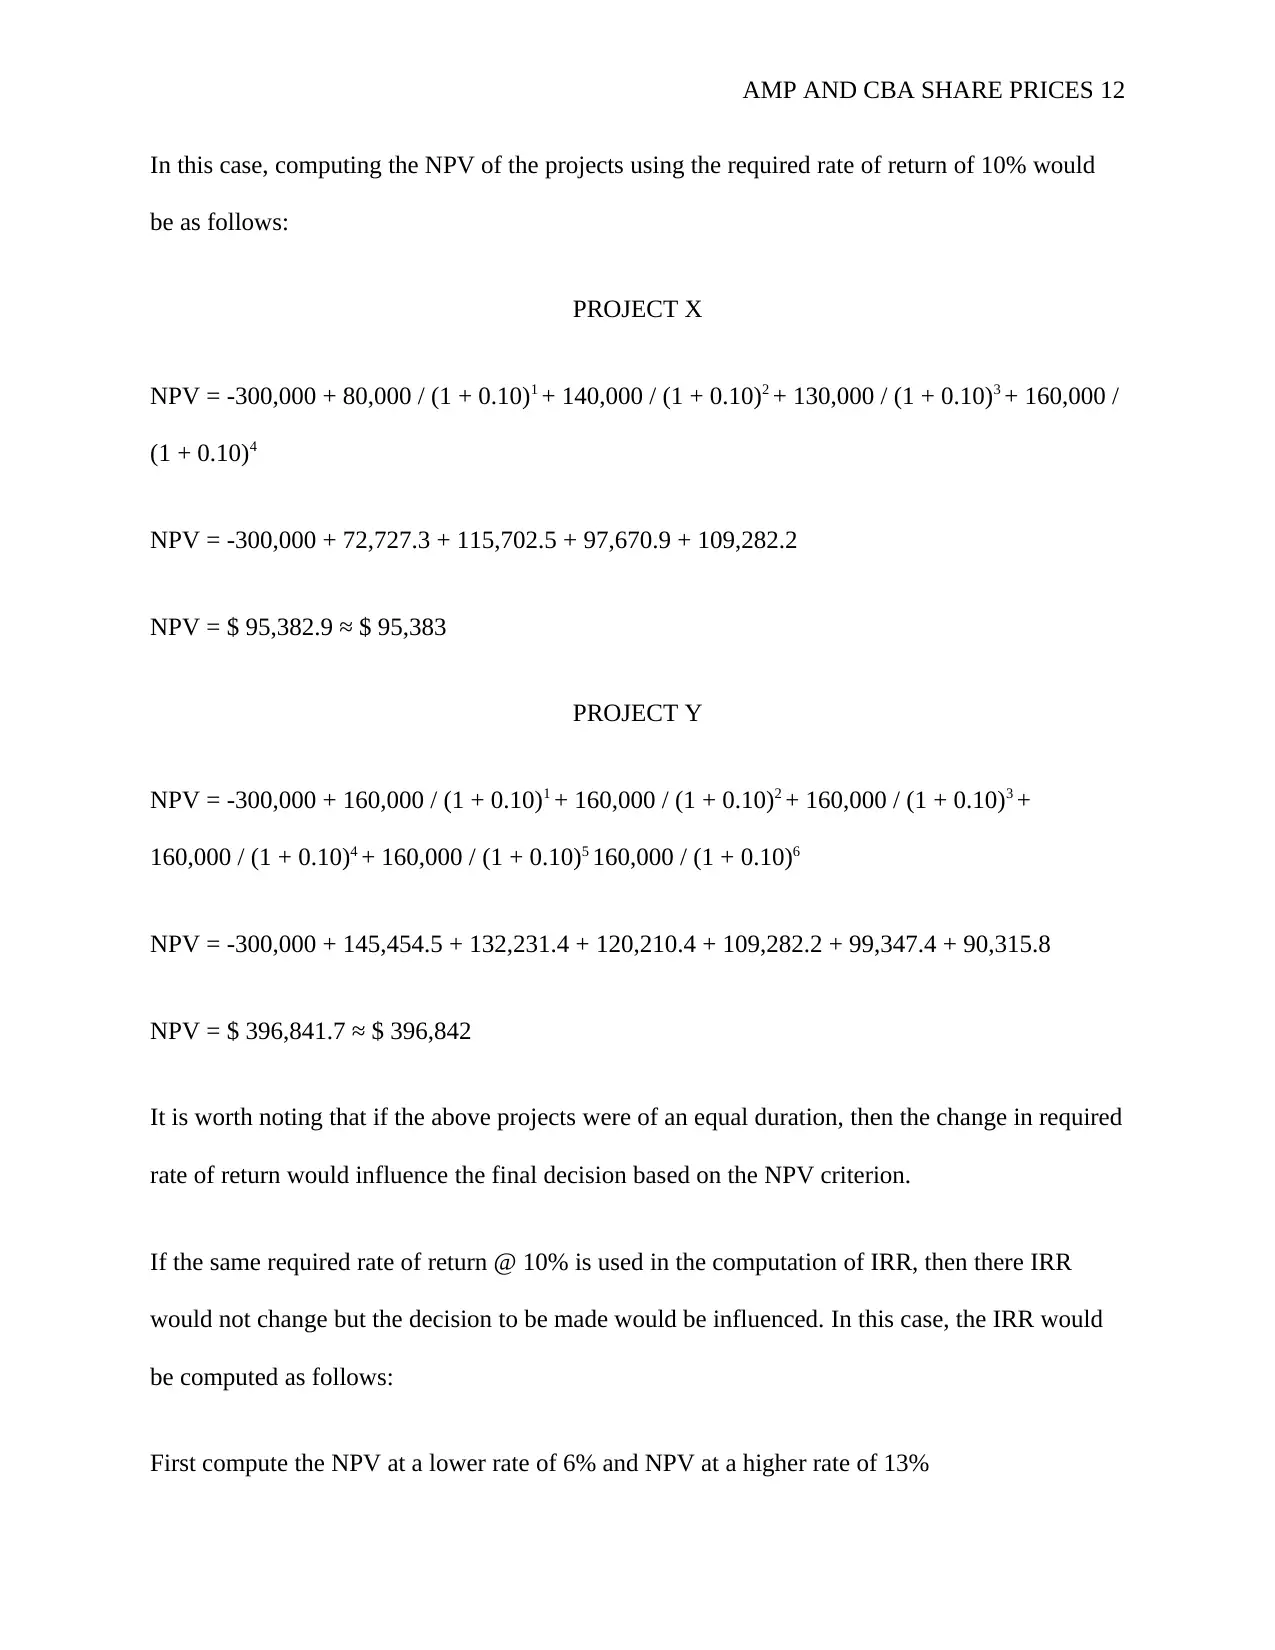
In this case, computing the NPV of the projects using the required rate of return of 10% would
be as follows:
PROJECT X
NPV = -300,000 + 80,000 / (1 + 0.10)1 + 140,000 / (1 + 0.10)2 + 130,000 / (1 + 0.10)3 + 160,000 /
(1 + 0.10)4
NPV = -300,000 + 72,727.3 + 115,702.5 + 97,670.9 + 109,282.2
NPV = $ 95,382.9 ≈ $ 95,383
PROJECT Y
NPV = -300,000 + 160,000 / (1 + 0.10)1 + 160,000 / (1 + 0.10)2 + 160,000 / (1 + 0.10)3 +
160,000 / (1 + 0.10)4 + 160,000 / (1 + 0.10)5 160,000 / (1 + 0.10)6
NPV = -300,000 + 145,454.5 + 132,231.4 + 120,210.4 + 109,282.2 + 99,347.4 + 90,315.8
NPV = $ 396,841.7 ≈ $ 396,842
It is worth noting that if the above projects were of an equal duration, then the change in required
rate of return would influence the final decision based on the NPV criterion.
If the same required rate of return @ 10% is used in the computation of IRR, then there IRR
would not change but the decision to be made would be influenced. In this case, the IRR would
be computed as follows:
First compute the NPV at a lower rate of 6% and NPV at a higher rate of 13%
⊘ This is a preview!⊘
Do you want full access?
Subscribe today to unlock all pages.
Trusted by 1+ million students worldwide
1 out of 17
Your All-in-One AI-Powered Toolkit for Academic Success.
+13062052269
info@desklib.com
Available 24*7 on WhatsApp / Email
![[object Object]](/_next/static/media/star-bottom.7253800d.svg)
Unlock your academic potential
Copyright © 2020–2026 A2Z Services. All Rights Reserved. Developed and managed by ZUCOL.