Analysis of AMP Limited's Financial Performance (2018-2019)
VerifiedAdded on 2022/08/22
|10
|1591
|30
Report
AI Summary
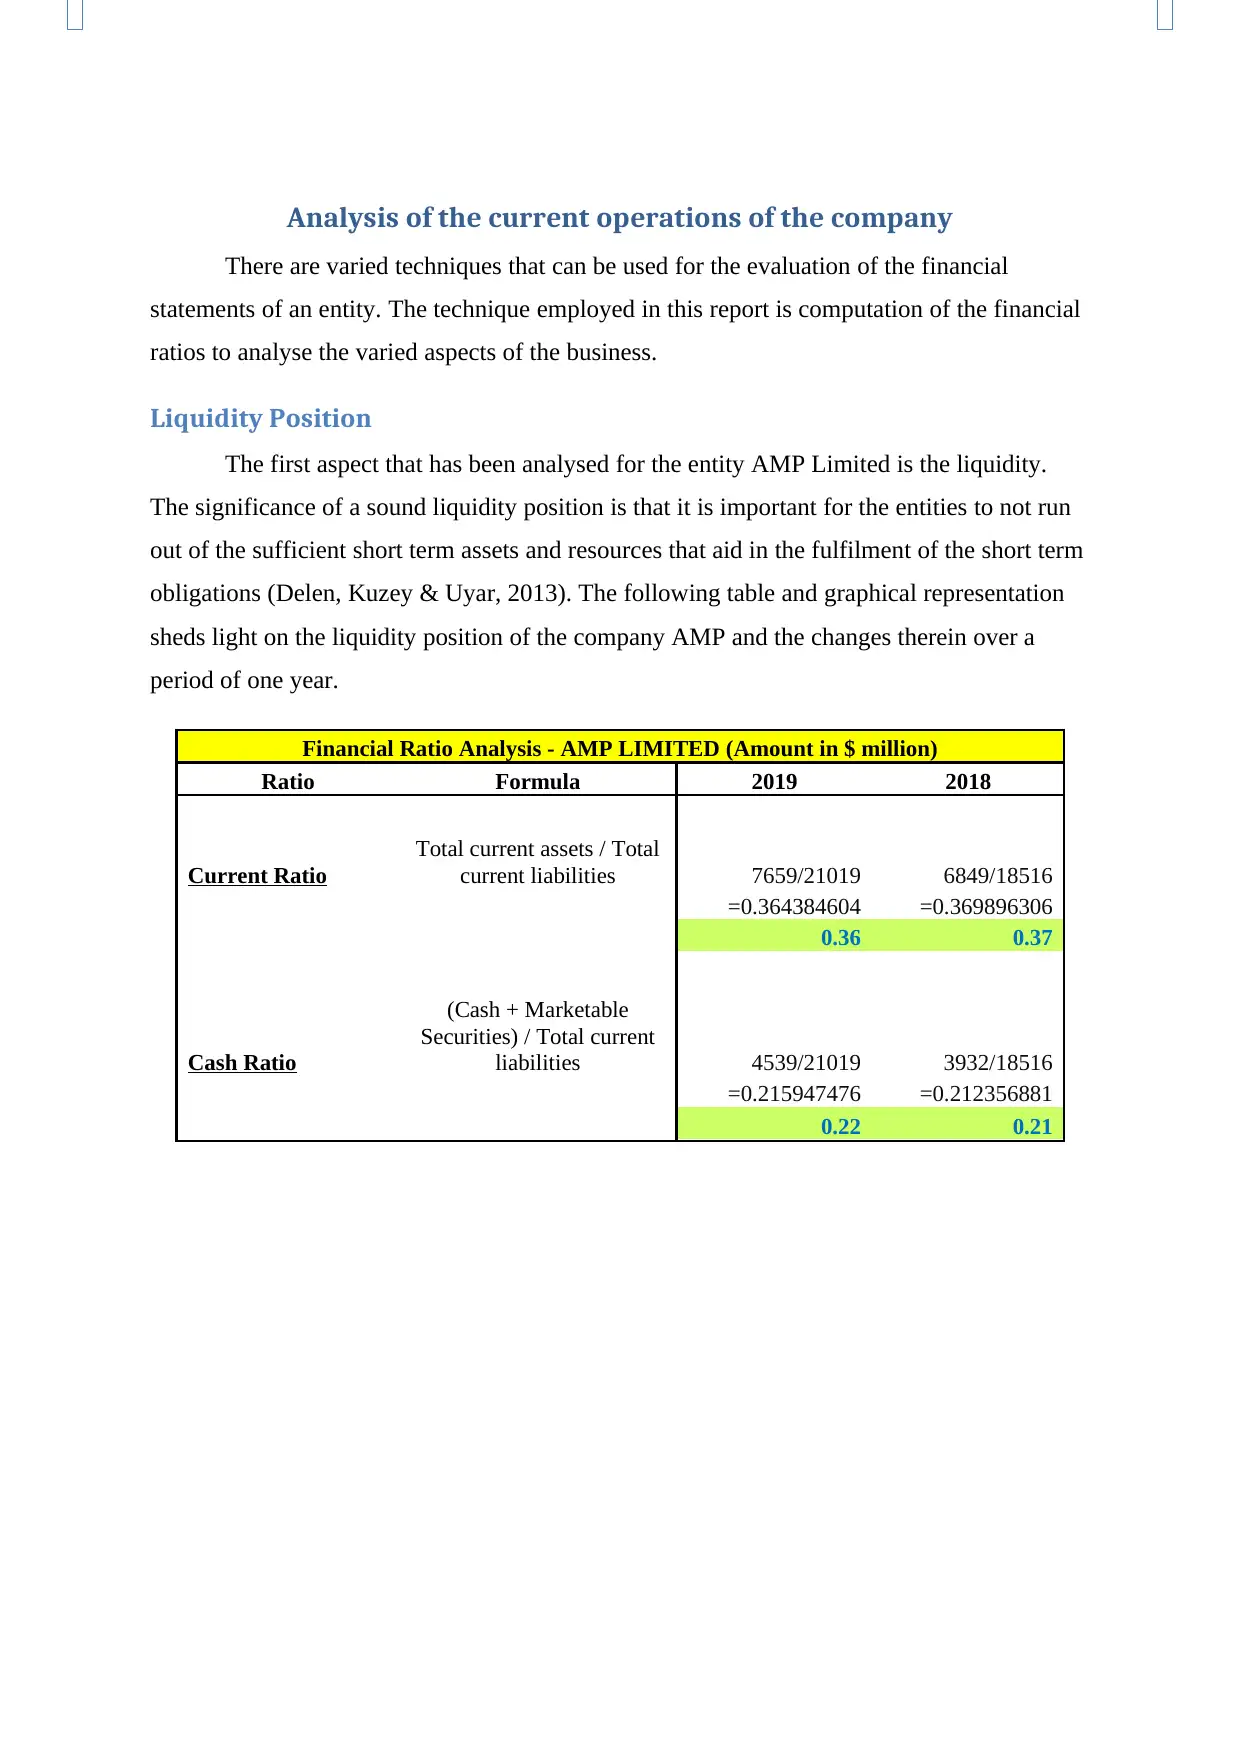
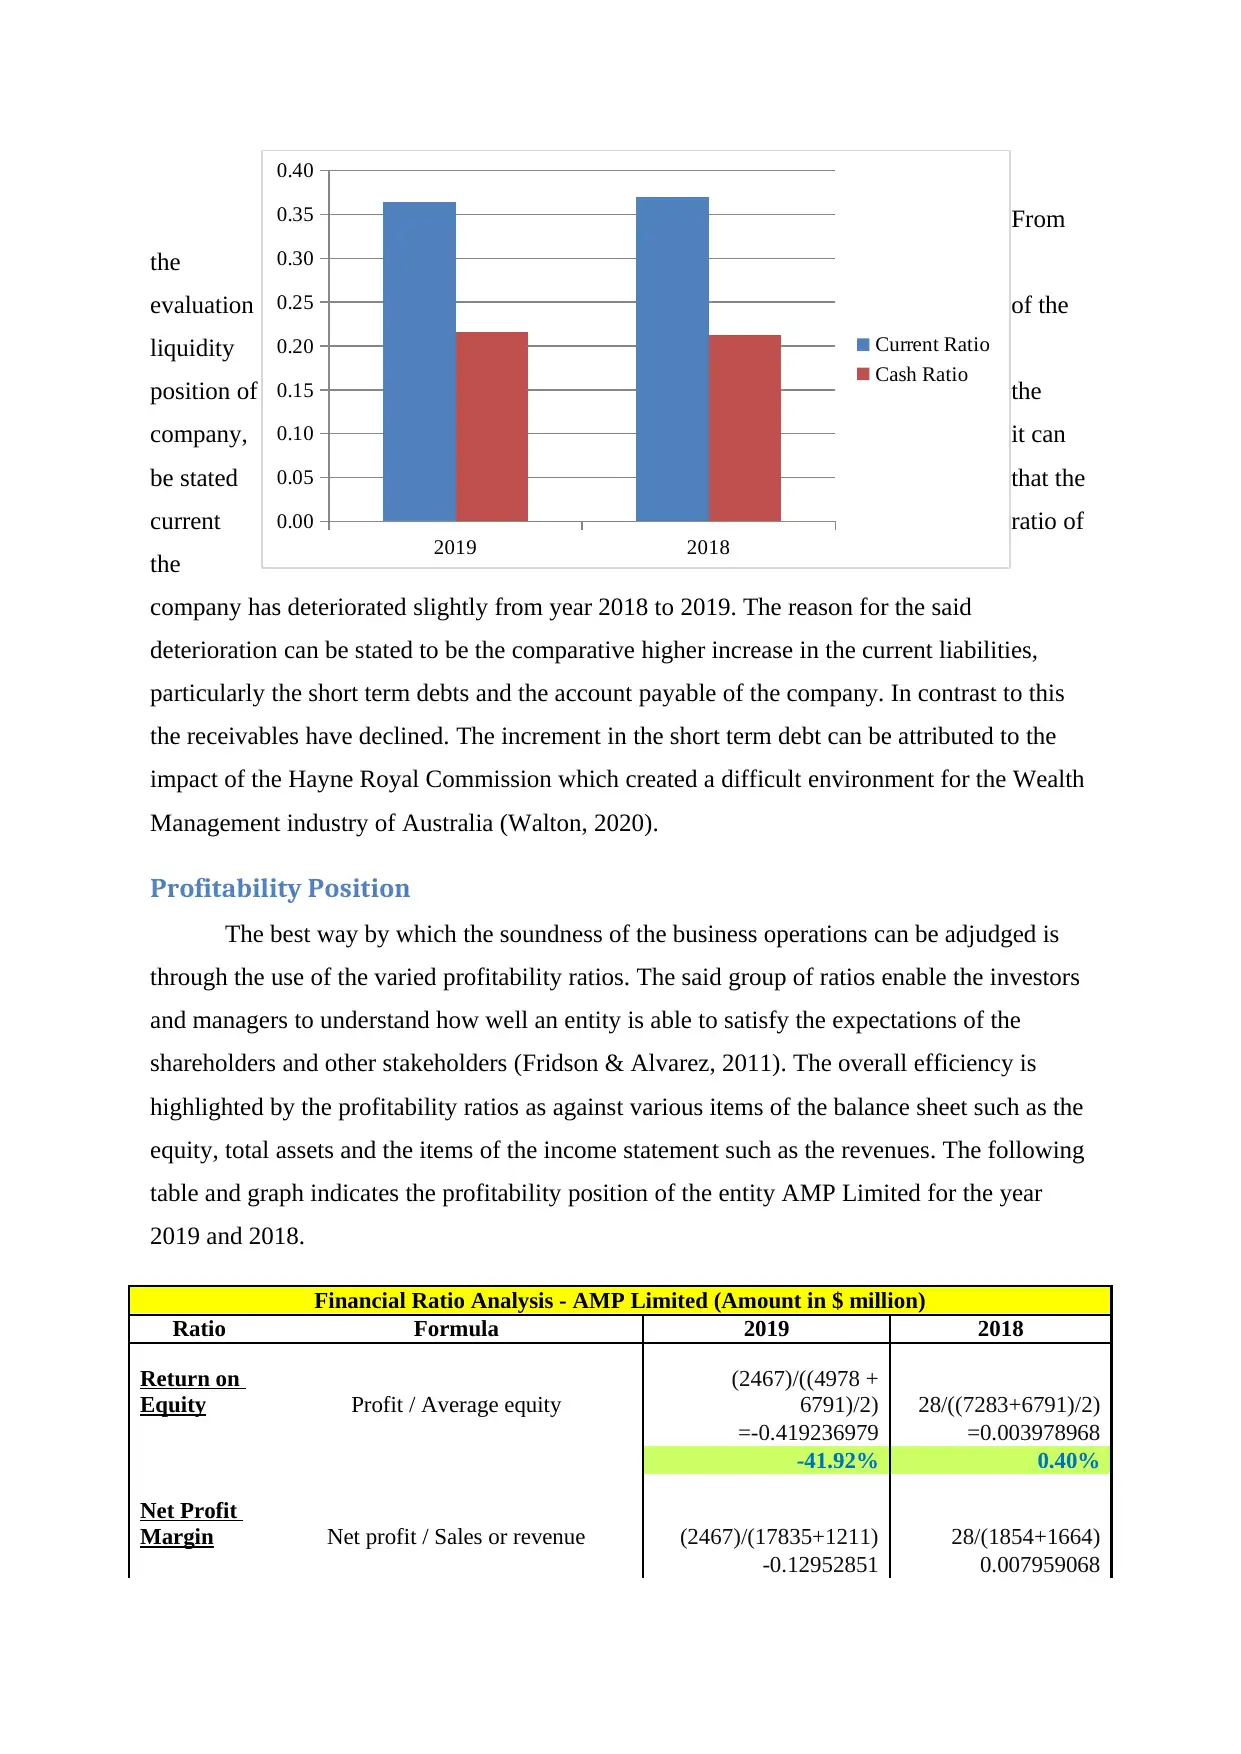
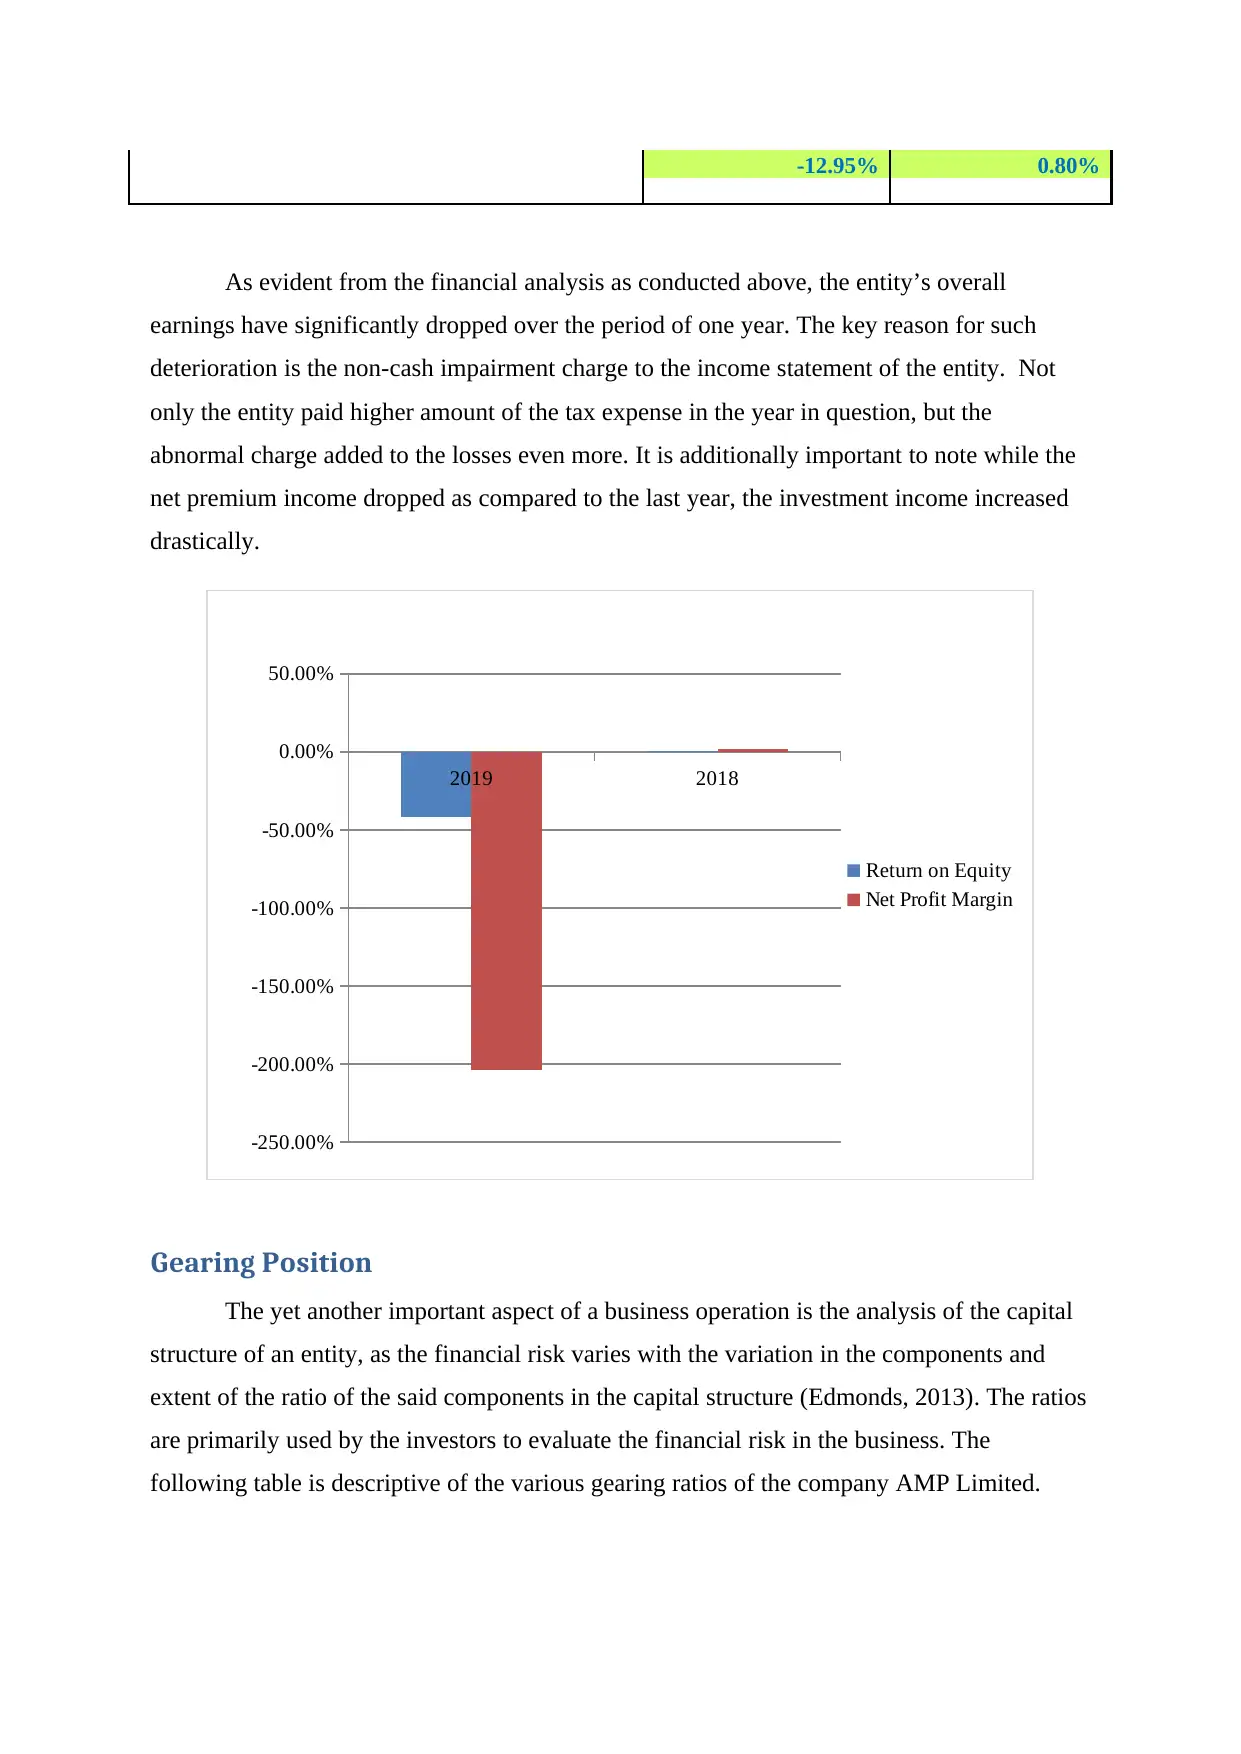
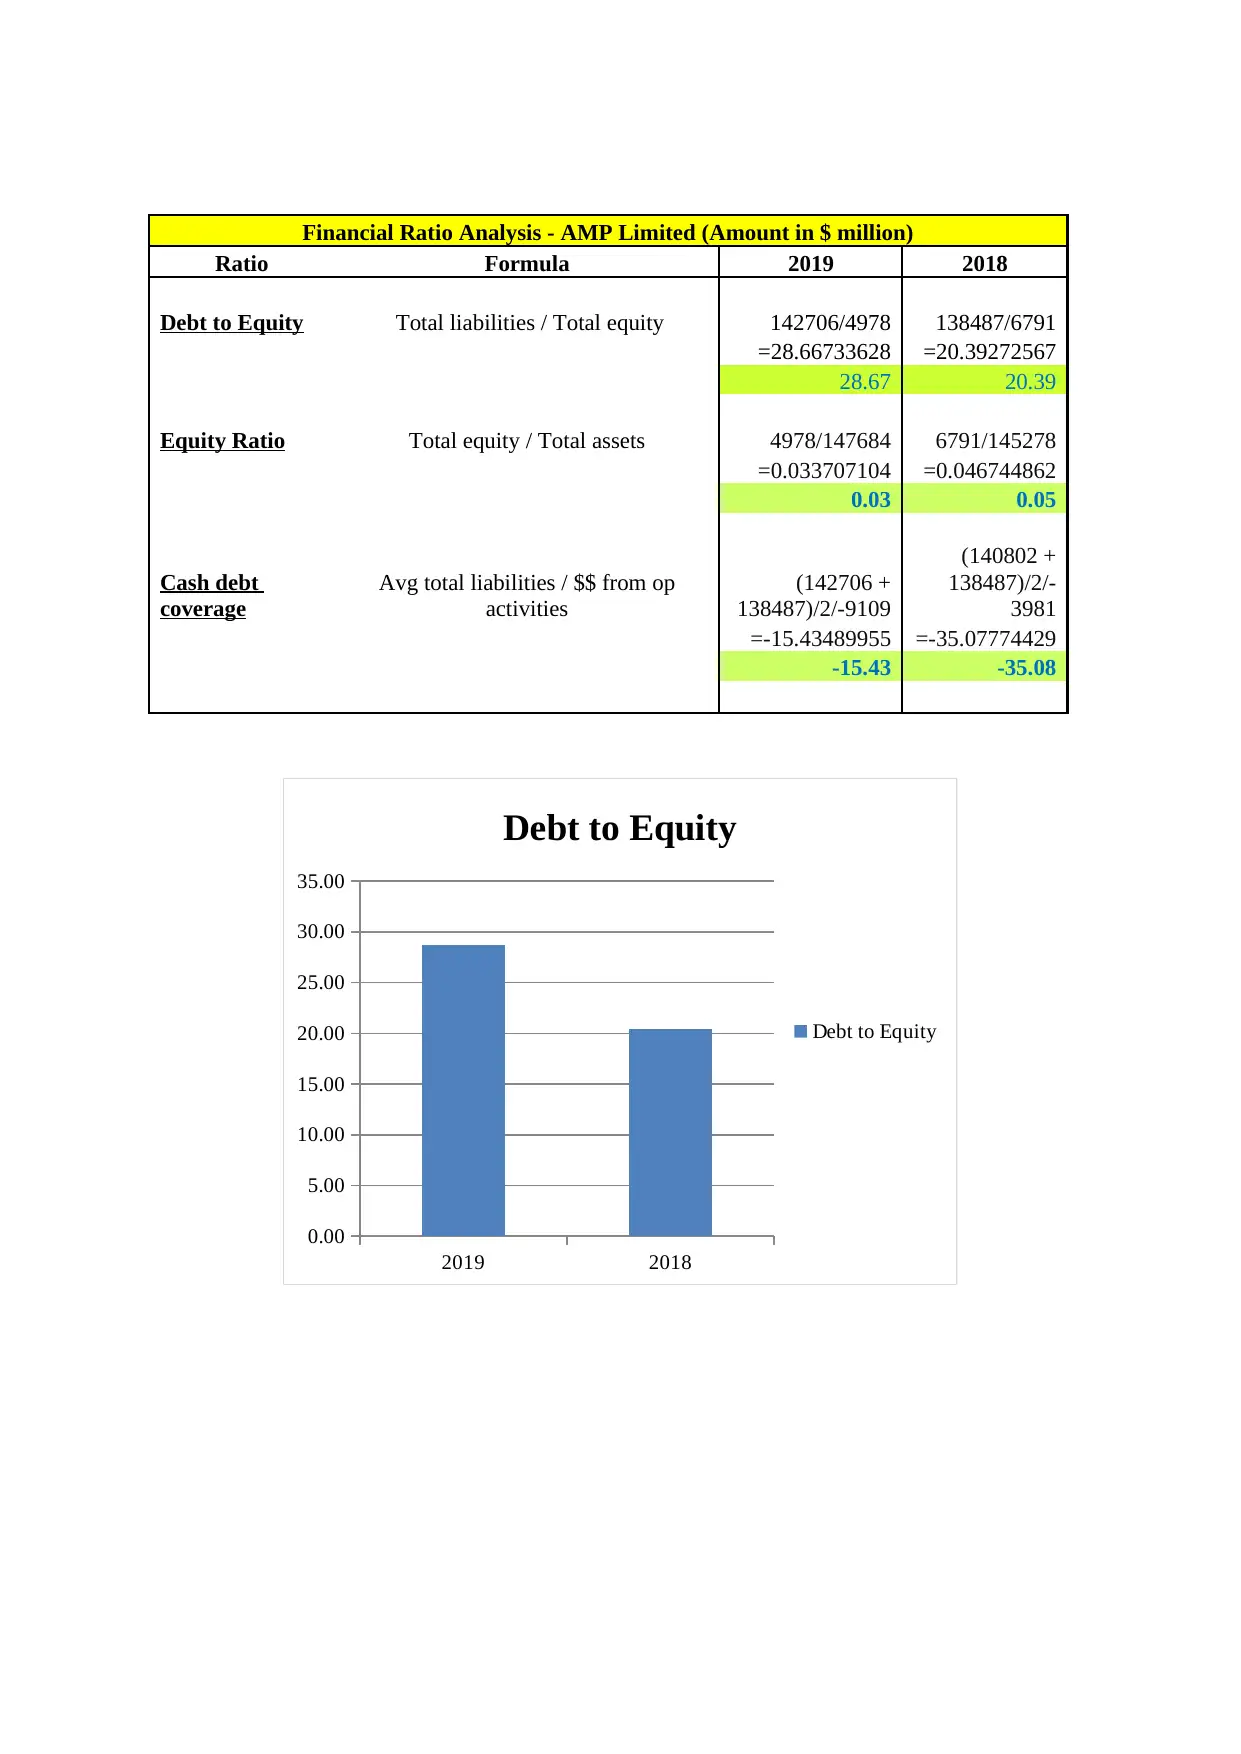
This report provides a comprehensive financial analysis of AMP Limited, evaluating its performance from 2018 to 2019. The analysis encompasses key financial ratios, including liquidity, profitability, and gearing ratios, to assess the company's financial health. The liquidity position is evaluated through current and cash ratios, revealing a slight deterioration due to increased liabilities. Profitability, measured by return on equity and net profit margin, shows a significant decline attributed to non-cash impairment charges and increased tax expenses. The gearing position, analyzed via debt-to-equity and equity ratios, indicates increased financial risk due to rising liabilities and declining equity. Furthermore, the report employs the Dividend Discount Model (DDM) to value AMP Limited's shares, concluding that the shares were undervalued as of December 31, 2019. The analysis incorporates dividend growth rates, the Capital Asset Pricing Model (CAPM) to calculate the cost of capital, and expected dividends for share valuation.

BUSINESS FINANCE
Paraphrase This Document
Need a fresh take? Get an instant paraphrase of this document with our AI Paraphraser

Analysis of the current operations of the company
There are varied techniques that can be used for the evaluation of the financial
statements of an entity. The technique employed in this report is computation of the financial
ratios to analyse the varied aspects of the business.
Liquidity Position
The first aspect that has been analysed for the entity AMP Limited is the liquidity.
The significance of a sound liquidity position is that it is important for the entities to not run
out of the sufficient short term assets and resources that aid in the fulfilment of the short term
obligations (Delen, Kuzey & Uyar, 2013). The following table and graphical representation
sheds light on the liquidity position of the company AMP and the changes therein over a
period of one year.
Financial Ratio Analysis - AMP LIMITED (Amount in $ million)
Ratio Formula 2019 2018
Current Ratio
Total current assets / Total
current liabilities 7659/21019 6849/18516
=0.364384604 =0.369896306
0.36 0.37
Cash Ratio
(Cash + Marketable
Securities) / Total current
liabilities 4539/21019 3932/18516
=0.215947476 =0.212356881
0.22 0.21

From
the
evaluation of the
liquidity
position of the
company, it can
be stated that the
current ratio of
the
company has deteriorated slightly from year 2018 to 2019. The reason for the said
deterioration can be stated to be the comparative higher increase in the current liabilities,
particularly the short term debts and the account payable of the company. In contrast to this
the receivables have declined. The increment in the short term debt can be attributed to the
impact of the Hayne Royal Commission which created a difficult environment for the Wealth
Management industry of Australia (Walton, 2020).
Profitability Position
The best way by which the soundness of the business operations can be adjudged is
through the use of the varied profitability ratios. The said group of ratios enable the investors
and managers to understand how well an entity is able to satisfy the expectations of the
shareholders and other stakeholders (Fridson & Alvarez, 2011). The overall efficiency is
highlighted by the profitability ratios as against various items of the balance sheet such as the
equity, total assets and the items of the income statement such as the revenues. The following
table and graph indicates the profitability position of the entity AMP Limited for the year
2019 and 2018.
Financial Ratio Analysis - AMP Limited (Amount in $ million)
Ratio Formula 2019 2018
Return on
Equity Profit / Average equity
(2467)/((4978 +
6791)/2) 28/((7283+6791)/2)
=-0.419236979 =0.003978968
-41.92% 0.40%
Net Profit
Margin Net profit / Sales or revenue (2467)/(17835+1211) 28/(1854+1664)
-0.12952851 0.007959068
2019 2018
0.00
0.05
0.10
0.15
0.20
0.25
0.30
0.35
0.40
Current Ratio
Cash Ratio
the
evaluation of the
liquidity
position of the
company, it can
be stated that the
current ratio of
the
company has deteriorated slightly from year 2018 to 2019. The reason for the said
deterioration can be stated to be the comparative higher increase in the current liabilities,
particularly the short term debts and the account payable of the company. In contrast to this
the receivables have declined. The increment in the short term debt can be attributed to the
impact of the Hayne Royal Commission which created a difficult environment for the Wealth
Management industry of Australia (Walton, 2020).
Profitability Position
The best way by which the soundness of the business operations can be adjudged is
through the use of the varied profitability ratios. The said group of ratios enable the investors
and managers to understand how well an entity is able to satisfy the expectations of the
shareholders and other stakeholders (Fridson & Alvarez, 2011). The overall efficiency is
highlighted by the profitability ratios as against various items of the balance sheet such as the
equity, total assets and the items of the income statement such as the revenues. The following
table and graph indicates the profitability position of the entity AMP Limited for the year
2019 and 2018.
Financial Ratio Analysis - AMP Limited (Amount in $ million)
Ratio Formula 2019 2018
Return on
Equity Profit / Average equity
(2467)/((4978 +
6791)/2) 28/((7283+6791)/2)
=-0.419236979 =0.003978968
-41.92% 0.40%
Net Profit
Margin Net profit / Sales or revenue (2467)/(17835+1211) 28/(1854+1664)
-0.12952851 0.007959068
2019 2018
0.00
0.05
0.10
0.15
0.20
0.25
0.30
0.35
0.40
Current Ratio
Cash Ratio
⊘ This is a preview!⊘
Do you want full access?
Subscribe today to unlock all pages.

Trusted by 1+ million students worldwide

-12.95% 0.80%
As evident from the financial analysis as conducted above, the entity’s overall
earnings have significantly dropped over the period of one year. The key reason for such
deterioration is the non-cash impairment charge to the income statement of the entity. Not
only the entity paid higher amount of the tax expense in the year in question, but the
abnormal charge added to the losses even more. It is additionally important to note while the
net premium income dropped as compared to the last year, the investment income increased
drastically.
2019 2018
-250.00%
-200.00%
-150.00%
-100.00%
-50.00%
0.00%
50.00%
Return on Equity
Net Profit Margin
Gearing Position
The yet another important aspect of a business operation is the analysis of the capital
structure of an entity, as the financial risk varies with the variation in the components and
extent of the ratio of the said components in the capital structure (Edmonds, 2013). The ratios
are primarily used by the investors to evaluate the financial risk in the business. The
following table is descriptive of the various gearing ratios of the company AMP Limited.
Paraphrase This Document
Need a fresh take? Get an instant paraphrase of this document with our AI Paraphraser

Financial Ratio Analysis - AMP Limited (Amount in $ million)
Ratio Formula 2019 2018
Debt to Equity Total liabilities / Total equity 142706/4978 138487/6791
=28.66733628 =20.39272567
28.67 20.39
Equity Ratio Total equity / Total assets 4978/147684 6791/145278
=0.033707104 =0.046744862
0.03 0.05
Cash debt
coverage
Avg total liabilities / $$ from op
activities
(142706 +
138487)/2/-9109
(140802 +
138487)/2/-
3981
=-15.43489955 =-35.07774429
-15.43 -35.08
2019 2018
0.00
5.00
10.00
15.00
20.00
25.00
30.00
35.00
Debt to Equity
Debt to Equity

2019 2018
0.00
0.01
0.02
0.03
0.04
0.05
Equity Ratio
Equity Ratio
It must be noted from the analysis of the gearing position of the company that the debt
equity ratio of the company has increased from the previous year. This indicates the
increment of the risk in the financial structure of the company as the total liabilities are
increasing as compared to the decrease in the shareholder’s equity. The elements of the total
liabilities that have increased over the period of one year are the short term debts, provisions
and the other non-current liabilities. This is additionally with the sharp decline in the retained
earnings of the company. As a result, the equity to total assets ratio has further declined as
compared to the previous year. Thus, it can be stated that overall this is not a favourable
position from the point of view of the existing investors.
Valuation of shares of AMP Limited
There are varied valuation models prescribed for the valuation of the shares of an
organisation. The method that would be used for the valuation of the shares of the company
AMP Limited is the Dividend Discount Model.
Dividend Discount Model
The Dividend Discount Model (DDM) denotes a quantitative method that aids in the
prediction of the price of shares of a company using the principle of the time value of money.
The theory operates on the principle that the price of a stock in the present day is the sum of
the dividend payments to be received in the future, taken at their present values. Thus, the
technique is aimed at the calculation of the fair value of a share, and the current market
conditions are not considered. The two key factors that are primarily considered are the
⊘ This is a preview!⊘
Do you want full access?
Subscribe today to unlock all pages.

Trusted by 1+ million students worldwide

market expected returns along with the dividend payments. Thus, if the value derived from
the dividend discount model is more than the current trading prices of the shares, the shares
would be stated to be undervalued and vice versa. The formula for the computation of the
share prices according to DDM is listed as follows.
Value of Stock = Expected Dividend per Share / (Cost of capital – Dividend Growth Rate)
Thus, there are three components in the above formula. The calculations of the above
components in relation to the company AMP are stated as follows.
Dividend Growth Rate
The dividend growth rate is computed taking into account the following dividend payments
over the period of five years, and thus an average dividend rate has been worked out as
follows.
Description Year 2015 Year 2016 Year 2017 Year 2018 Year 2019
Dividends 0.28 0.28 0.29 0.14 0
Growth Rate 7.69% 0.0% 1.0% -15.0% -14.0%
Average Growth Rate
(Assumed) -4.06%
Cost of capital using the CAPM
For the next step of the formula, the cost of the capital would be worked out using the Capital
Asset Pricing Model (CAPM). The formula for the Required Return according to CAPM is
listed as follows.
Paraphrase This Document
Need a fresh take? Get an instant paraphrase of this document with our AI Paraphraser

For the risk free rate of return, the Australia Bond 5 Year Yield has been used, as per the
following data.
(Source: Bloomberg, 2020)
The required rate of return is computed as shown in the table below.
Risk Free Rate
= 0.57%
Beta =
0.20071
1
S&P Return = -1.19%
Ke = 0.57% + 0.200711*(-1.19%-0.57%)
Ke = 0.22%
Expected Dividends
Expected Dividend = Last Dividend * Growth Rate
Expected Dividend = 0.14 * -4.06% + 0.14
Expected Dividend = 0.13
Valuation of shares = 0.13/ (0.22% + 4.06%)
Valuation of shares = $ 3.037

Thus, as per the Dividend Discount Model, the fair value of the share has been worked out to
be $ 3.037 on 31st December 2019. The share price on the Australian Exchange as on the
same date was $ 1.8250. Thus, it can be stated that the share has been undervalued.
Graphical Representation of the returns and the share prices
1/1/2015
4/1/2015
7/1/2015
10/1/2015
1/1/2016
4/1/2016
7/1/2016
10/1/2016
1/1/2017
4/1/2017
7/1/2017
10/1/2017
1/1/2018
4/1/2018
7/1/2018
10/1/2018
1/1/2019
4/1/2019
7/1/2019
10/1/2019
-1.00
0.00
1.00
2.00
3.00
4.00
5.00
6.00
Share Price
% AMP
⊘ This is a preview!⊘
Do you want full access?
Subscribe today to unlock all pages.

Trusted by 1+ million students worldwide

References
Delen, D., Kuzey, C., & Uyar, A. (2013). Measuring firm performance using financial ratios:
A decision tree approach. Expert Systems with Applications, 40(10), 3970-3983.
Edmonds, T. P. (2013). Fundamental financial accounting concepts. UK: McGraw-Hill.
Fridson, M. S., & Alvarez, F. (2011). Financial statement analysis: a practitioner's guide
Vol. 597. UK: John Wiley & Sons.
Walton, S. (2020). AMP share price: 2019 full-year results unpacked. Retrieved from:
https://www.ig.com/au/news-and-trade-ideas/amp-share-price--key-things-we-learnt-
from-fy19-results-200213
Bloomberg (2020). Australian Rates & Bonds. Retrieved from:
https://www.bloomberg.com/markets/rates-bonds/government-bonds/australia
1 out of 10
Related Documents

Your All-in-One AI-Powered Toolkit for Academic Success.
+13062052269
info@desklib.com
Available 24*7 on WhatsApp / Email
Unlock your academic potential
Copyright © 2020–2025 A2Z Services. All Rights Reserved. Developed and managed by ZUCOL.