Comprehensive Financial Analysis Report: AMP Limited Performance
VerifiedAdded on 2022/10/06
|18
|3210
|21
Report
AI Summary
This report provides a comprehensive financial analysis of AMP Limited, a financial services company operating in Australia and New Zealand. It examines AMP's financial performance using its balance sheet, profit and loss statement, and cash flow statement for the years 2017 and 2018. The analysis reveals a decline in assets, liabilities, and profitability. The report calculates the rate of return for S&P/ASX 200, the required rate of return using CAPM, and the value of AMP using the Dividend Valuation Model (DDM). Based on these calculations, it identifies the company's share as overvalued. The report also includes graphs illustrating AMP's adjusted close and return over a 10-year period. The study highlights areas of concern in cash flows, particularly in operating and financing activities, and suggests investment and financing strategies aimed at improving cash flow and maximizing shareholder wealth. The report concludes with recommendations for improving AMP's financial position and justifying the suggested strategies.
Running head: BUSINESS FINANCE
Business Finance
Name of the Student:
Name of the University:
Author’s Note
Business Finance
Name of the Student:
Name of the University:
Author’s Note
Paraphrase This Document
Need a fresh take? Get an instant paraphrase of this document with our AI Paraphraser
1
BUSINESS FINANCE
Table of Contents
Brief description of AMP:...............................................................................................................2
Explaining the purposes of financial statement:..............................................................................2
Analysing the current operations of AMP using the financial statements, while analysing its
supply and demand factors:.............................................................................................................3
Calculating the rate of return for S&P/ASX 200:............................................................................9
Calculating the required rate of return using CAPM:......................................................................9
Calculating the value of AMP as per the Dividend Valuation Model:..........................................10
Drawing the graph of AMP, while analysing the results:..............................................................11
Identifying the areas of cash flows where the firms need to pay attention:..................................12
Suggesting relevant investment and financing strategies for improving the cash flows position: 13
Justifying the recommendation in terms of shareholder’s wealth maximisation:.........................13
References and Bibliography:........................................................................................................15
2
BUSINESS FINANCE
Brief description of AMP:
AMP Limited is one of the financial service companies that operate in New Zealand and
Australia while providing facilities such as investment products, insurance, superannuation,
banking products and financial advice. The company has been operating since 1849, where
majority of the services is related to finance and financial products provided to individuals,
institutions and companies. The Australian Mutual Provided Fund society was demutualised and
listed in Australian and New Zealand index is 1998, as it became a public limited organisation.
AMP has been four major business areas, which are advice and Banking, Insurance and
Superannuation, Customer solution and AMP Capital1. The diverse operations of the
organisation have mainly allowed the company to secure their relevant investments in the
Australian and international market to generate high level of income from investment. Therefore,
the organisation main aims to provide financial service that could increase investment scope.
Explaining the purposes of financial statement:
The main purpose of the financial statement analysis is to understand the current and past
financial data of the organisation, as it helps in depicting a clear picture of the company financial
health. Therefore, an investor by using the financial statement is able to detect the historical
performance of the company and anticipate the level of improvement that would be conducted in
future. Thus, the financial statement of the organisation analyses three specific positions, which
can be used for understanding future trajectory of the company. The financial statement
evaluates the profitability, financial position and cash flow conditions of the organisation for
1 Asx.com.au. “Asx.com.au”. 2019. Asx.Com.Au. Accessed October 3 2019.
https://www.asx.com.au/asx/share-price-research/company/AMP.
⊘ This is a preview!⊘
Do you want full access?
Subscribe today to unlock all pages.
Trusted by 1+ million students worldwide
3
BUSINESS FINANCE
detecting the current solvency levels of the company2. Thus, the analysis of the profit and loss
statement helps in understanding the growth in revenues and net profits of the company, while
analysing the overall expenses that have been conducted for achieving the targeted profit levels.
Therefore, the information in the balance sheet is mainly used for understanding the level of
improvements, which has obtained in form of assets over the period of time. In addition, the
financial statement is also used for fuelling the financial ratios, which helps in understanding the
financial performance of the company, while analysing the historical performance.
Analysing the current operations of AMP using the financial statements, while analysing its
supply and demand factors:
The financial performance of the AMP has can be evaluated for analysing the financial
statements of the organisation, as it would help in determining the appropriate positions of the
company. The current operations of AMP can be evaluated by analysing the financial report such
as Balance Sheet, Profit & loss statement and Cash flow statement, which are depicted as
follows.
Balance Sheet:
2 Beisland, Leif Atle. "Equity valuation in practice: The influence of net financial expenses."
In Accounting forum, vol. 38, no. 2, pp. 122-131. Taylor & Francis, 2014.
Paraphrase This Document
Need a fresh take? Get an instant paraphrase of this document with our AI Paraphraser
4
BUSINESS FINANCE
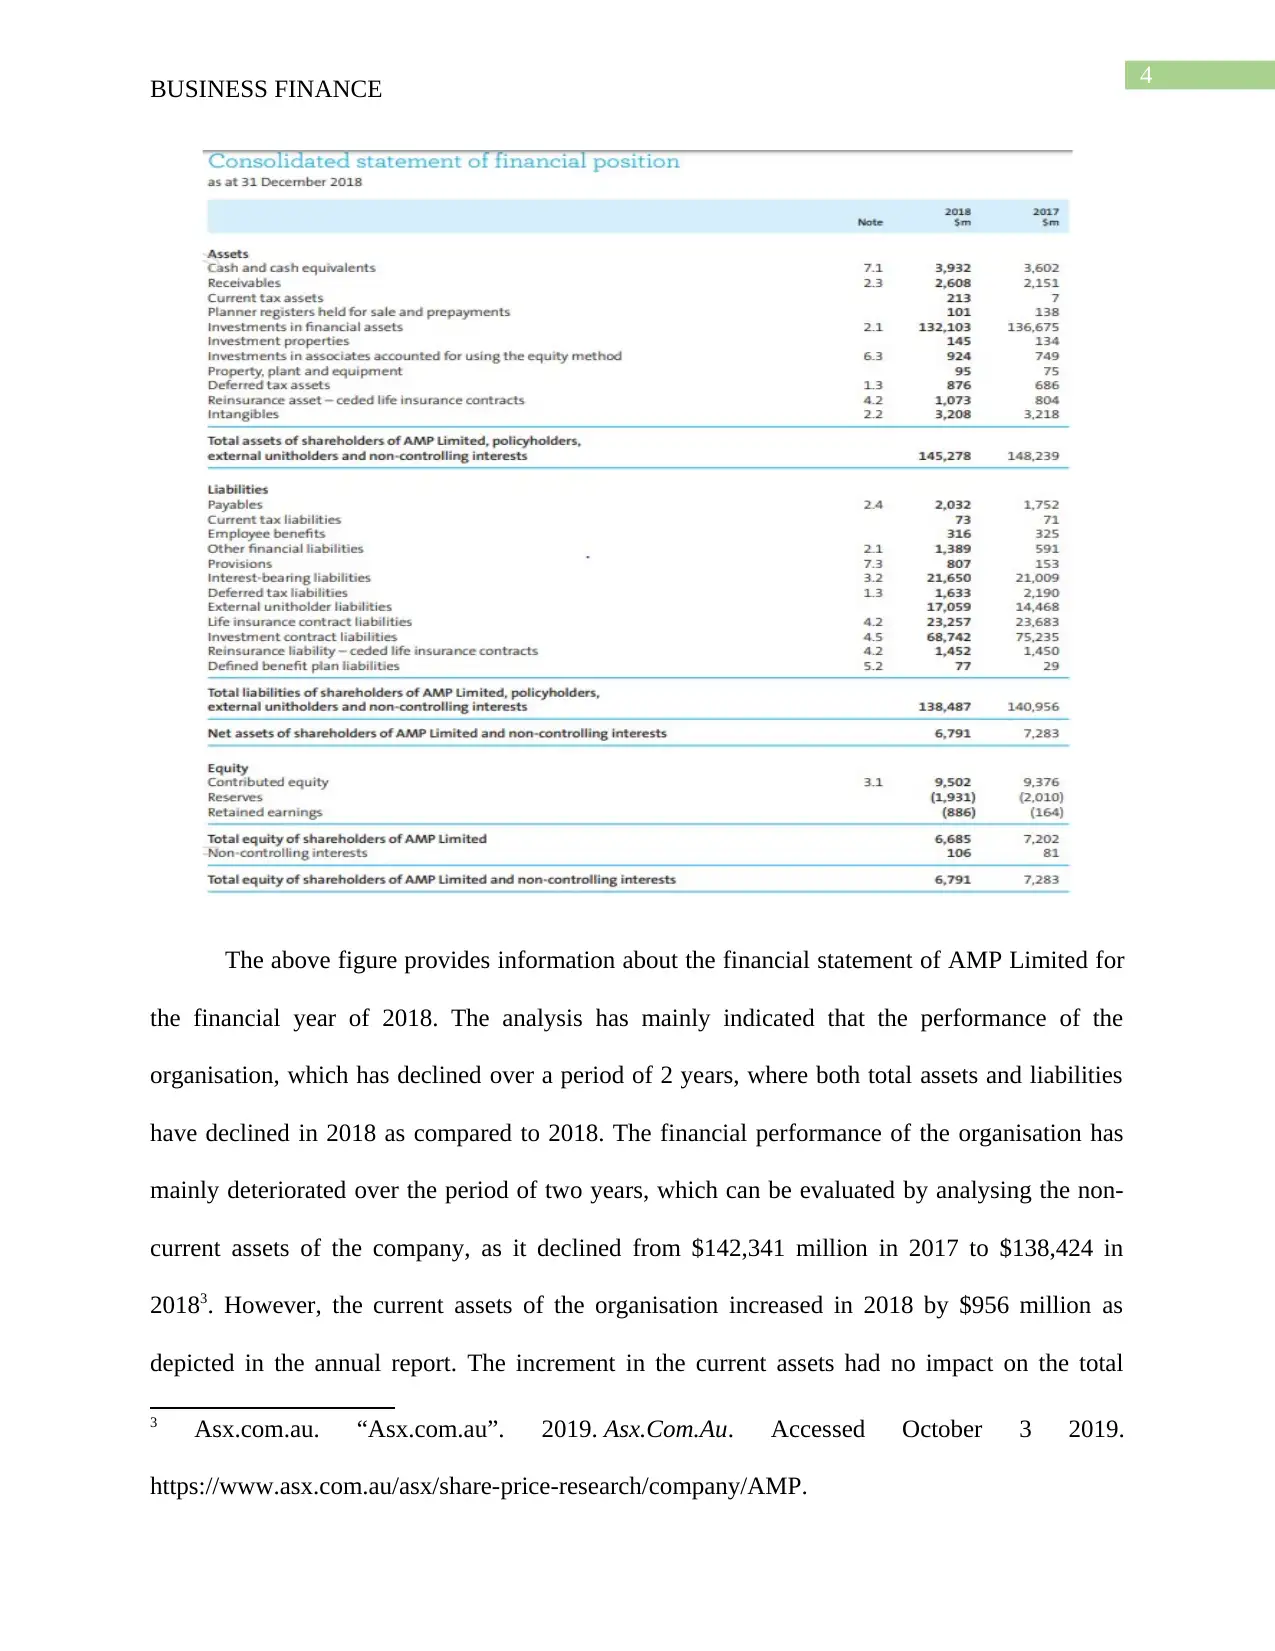
The above figure provides information about the financial statement of AMP Limited for
the financial year of 2018. The analysis has mainly indicated that the performance of the
organisation, which has declined over a period of 2 years, where both total assets and liabilities
have declined in 2018 as compared to 2018. The financial performance of the organisation has
mainly deteriorated over the period of two years, which can be evaluated by analysing the non-
current assets of the company, as it declined from $142,341 million in 2017 to $138,424 in
20183. However, the current assets of the organisation increased in 2018 by $956 million as
depicted in the annual report. The increment in the current assets had no impact on the total
3 Asx.com.au. “Asx.com.au”. 2019. Asx.Com.Au. Accessed October 3 2019.
https://www.asx.com.au/asx/share-price-research/company/AMP.
BUSINESS FINANCE
The above figure provides information about the financial statement of AMP Limited for
the financial year of 2018. The analysis has mainly indicated that the performance of the
organisation, which has declined over a period of 2 years, where both total assets and liabilities
have declined in 2018 as compared to 2018. The financial performance of the organisation has
mainly deteriorated over the period of two years, which can be evaluated by analysing the non-
current assets of the company, as it declined from $142,341 million in 2017 to $138,424 in
20183. However, the current assets of the organisation increased in 2018 by $956 million as
depicted in the annual report. The increment in the current assets had no impact on the total
3 Asx.com.au. “Asx.com.au”. 2019. Asx.Com.Au. Accessed October 3 2019.
https://www.asx.com.au/asx/share-price-research/company/AMP.
5
BUSINESS FINANCE
assets of the organisation, as the decline in non-current assets where far greater in 2018. The
overall decline in the total assets of the company was triggered by the fall in the investment in
financial assets of the organisation in 2018 as compared to 2017.
The analysis of the liability section of AMP Limited has mainly stated about the decline
in the total liabilities value of organisation in 2018 as compared to 2017. However, the current
liabilities of the company increased from $2,892 million in 2017 to $4,617 in 2018, which
indicates about the increasing obligations of the company. However, the non-current liabilities of
the organisation have declined in 2019, where the values of 138,064 million in 2017 were
reduced to 133,870 in 2018. This decline has been triggered by the reduction in the investment
contract liabilities of the organisation in 2019, where the values declined from 75,235 in 2017 to
68,742 in 2018. Therefore, the reduction in liabilities conditions and the assets have led to the
reduction in its net assets, which declined from 7,283 million in 2017 to 6,791 million in 2018.
The equity section of the organisation has also portrayed a similar decline, which was fuelled by
the reduction in retained earnings and reserves. Therefore, the analysis of the balance sheet
section of AMP Limited has mainly indicated that the current financial position of the company
is not appropriate.
Profit & loss statement:
⊘ This is a preview!⊘
Do you want full access?
Subscribe today to unlock all pages.
Trusted by 1+ million students worldwide
6
BUSINESS FINANCE
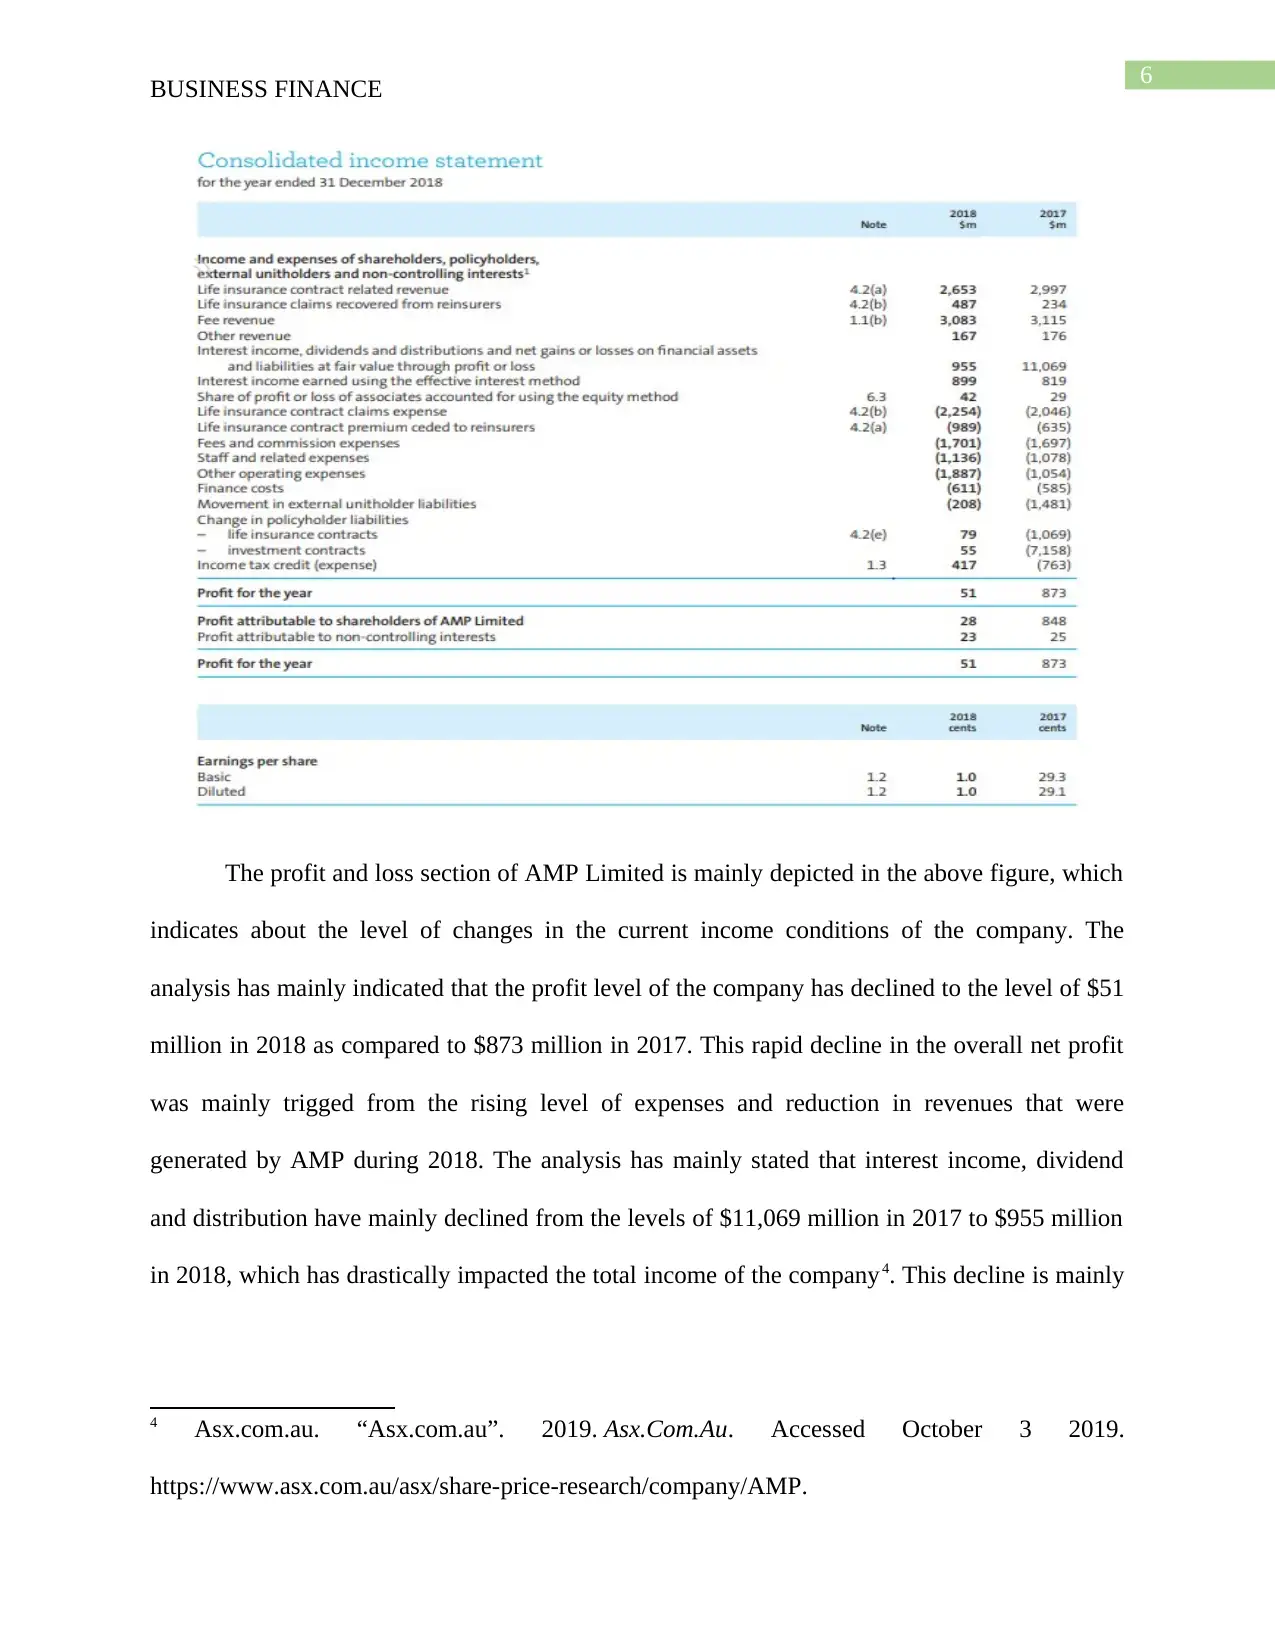
The profit and loss section of AMP Limited is mainly depicted in the above figure, which
indicates about the level of changes in the current income conditions of the company. The
analysis has mainly indicated that the profit level of the company has declined to the level of $51
million in 2018 as compared to $873 million in 2017. This rapid decline in the overall net profit
was mainly trigged from the rising level of expenses and reduction in revenues that were
generated by AMP during 2018. The analysis has mainly stated that interest income, dividend
and distribution have mainly declined from the levels of $11,069 million in 2017 to $955 million
in 2018, which has drastically impacted the total income of the company4. This decline is mainly
4 Asx.com.au. “Asx.com.au”. 2019. Asx.Com.Au. Accessed October 3 2019.
https://www.asx.com.au/asx/share-price-research/company/AMP.
BUSINESS FINANCE
The profit and loss section of AMP Limited is mainly depicted in the above figure, which
indicates about the level of changes in the current income conditions of the company. The
analysis has mainly indicated that the profit level of the company has declined to the level of $51
million in 2018 as compared to $873 million in 2017. This rapid decline in the overall net profit
was mainly trigged from the rising level of expenses and reduction in revenues that were
generated by AMP during 2018. The analysis has mainly stated that interest income, dividend
and distribution have mainly declined from the levels of $11,069 million in 2017 to $955 million
in 2018, which has drastically impacted the total income of the company4. This decline is mainly
4 Asx.com.au. “Asx.com.au”. 2019. Asx.Com.Au. Accessed October 3 2019.
https://www.asx.com.au/asx/share-price-research/company/AMP.
Paraphrase This Document
Need a fresh take? Get an instant paraphrase of this document with our AI Paraphraser
7
BUSINESS FINANCE
indicating the declining financial performance of AMP Limited due to its incapability to
maintain the flow of revenues during the financial year.
The profit and loss statement also indicated that change in policyholder liabilities has
become positive in 2019, which has mainly improved the overall financial condition of AMP
Limited in 2019, as its continued decline would have led to losses for the organisation5. The
analysis has indicated that other operating expenses of the organisation have increased from
$1,054 million in 2018 to $1,887 million in 2019. Furthermore, the income tax credit in 2019 is
positive, which was negative in 2018.
Cash flow statement:
5 Dalnial, Hawariah, Amrizah Kamaluddin, Zuraidah Mohd Sanusi, and Khairun Syafiza
Khairuddin. "Detecting fraudulent financial reporting through financial statement
analysis." Journal of Advanced Management Science Vol 2, no. 1 (2014).
8
BUSINESS FINANCE
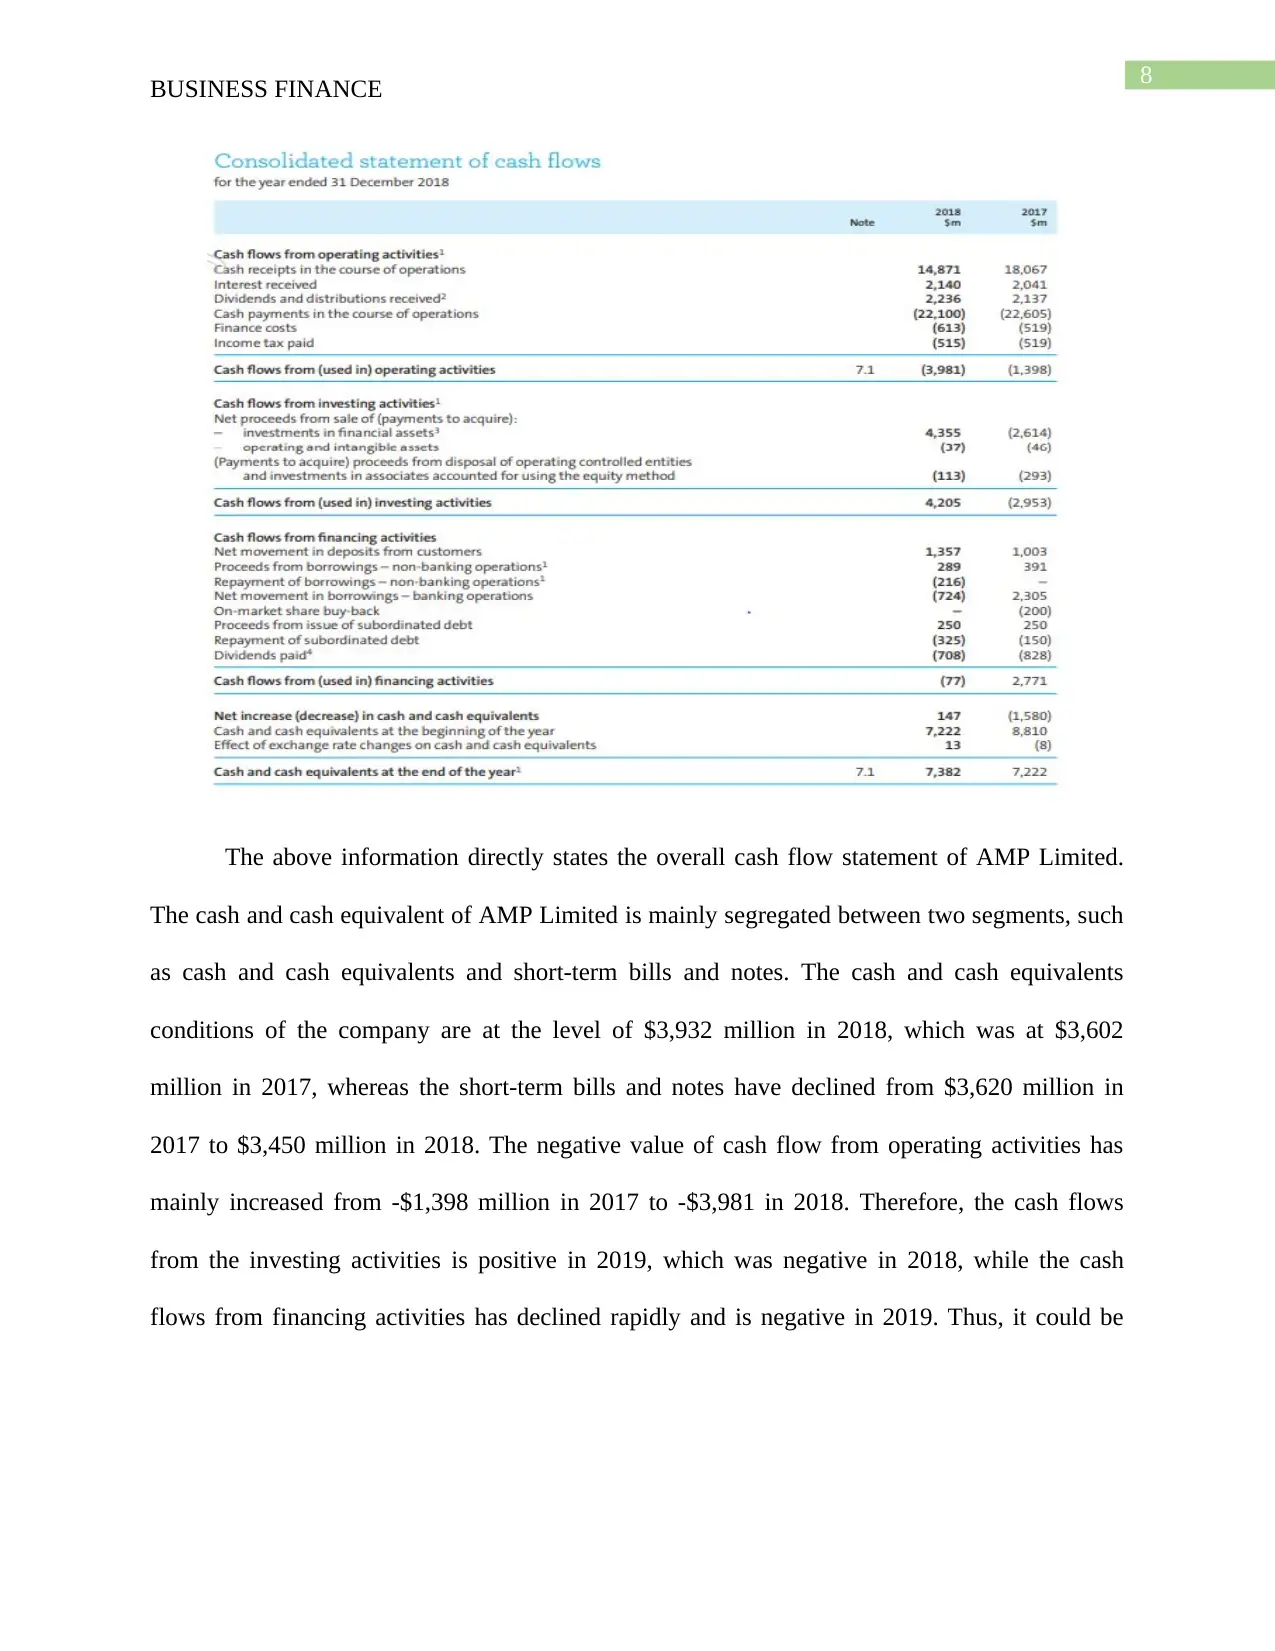
The above information directly states the overall cash flow statement of AMP Limited.
The cash and cash equivalent of AMP Limited is mainly segregated between two segments, such
as cash and cash equivalents and short-term bills and notes. The cash and cash equivalents
conditions of the company are at the level of $3,932 million in 2018, which was at $3,602
million in 2017, whereas the short-term bills and notes have declined from $3,620 million in
2017 to $3,450 million in 2018. The negative value of cash flow from operating activities has
mainly increased from -$1,398 million in 2017 to -$3,981 in 2018. Therefore, the cash flows
from the investing activities is positive in 2019, which was negative in 2018, while the cash
flows from financing activities has declined rapidly and is negative in 2019. Thus, it could be
BUSINESS FINANCE
The above information directly states the overall cash flow statement of AMP Limited.
The cash and cash equivalent of AMP Limited is mainly segregated between two segments, such
as cash and cash equivalents and short-term bills and notes. The cash and cash equivalents
conditions of the company are at the level of $3,932 million in 2018, which was at $3,602
million in 2017, whereas the short-term bills and notes have declined from $3,620 million in
2017 to $3,450 million in 2018. The negative value of cash flow from operating activities has
mainly increased from -$1,398 million in 2017 to -$3,981 in 2018. Therefore, the cash flows
from the investing activities is positive in 2019, which was negative in 2018, while the cash
flows from financing activities has declined rapidly and is negative in 2019. Thus, it could be
⊘ This is a preview!⊘
Do you want full access?
Subscribe today to unlock all pages.
Trusted by 1+ million students worldwide
9
BUSINESS FINANCE
detected that the cash flow conditions of the company improve in 2019, while other financial
sections declined during the year6.
The demand and supply factors of AMP have been evaluated for understanding the
current trajectory and future performance scope of the company. AMP Limited mainly falls
under the financial sectors, where the main operations of the company are to provide a financial
product to the customers. In recent years, the financial statement of the organisation has mainly
indicated a decline in its customer base, which has weakened its investment contract liabilities.
Moreover, the investments in financial assets have also declined, which states that both the
demand and supply conditions of AMP have degenerated in 2019. The customer is withdrawing
their investments, which is indicating about the decline in the current demand for the services of
the organisation.
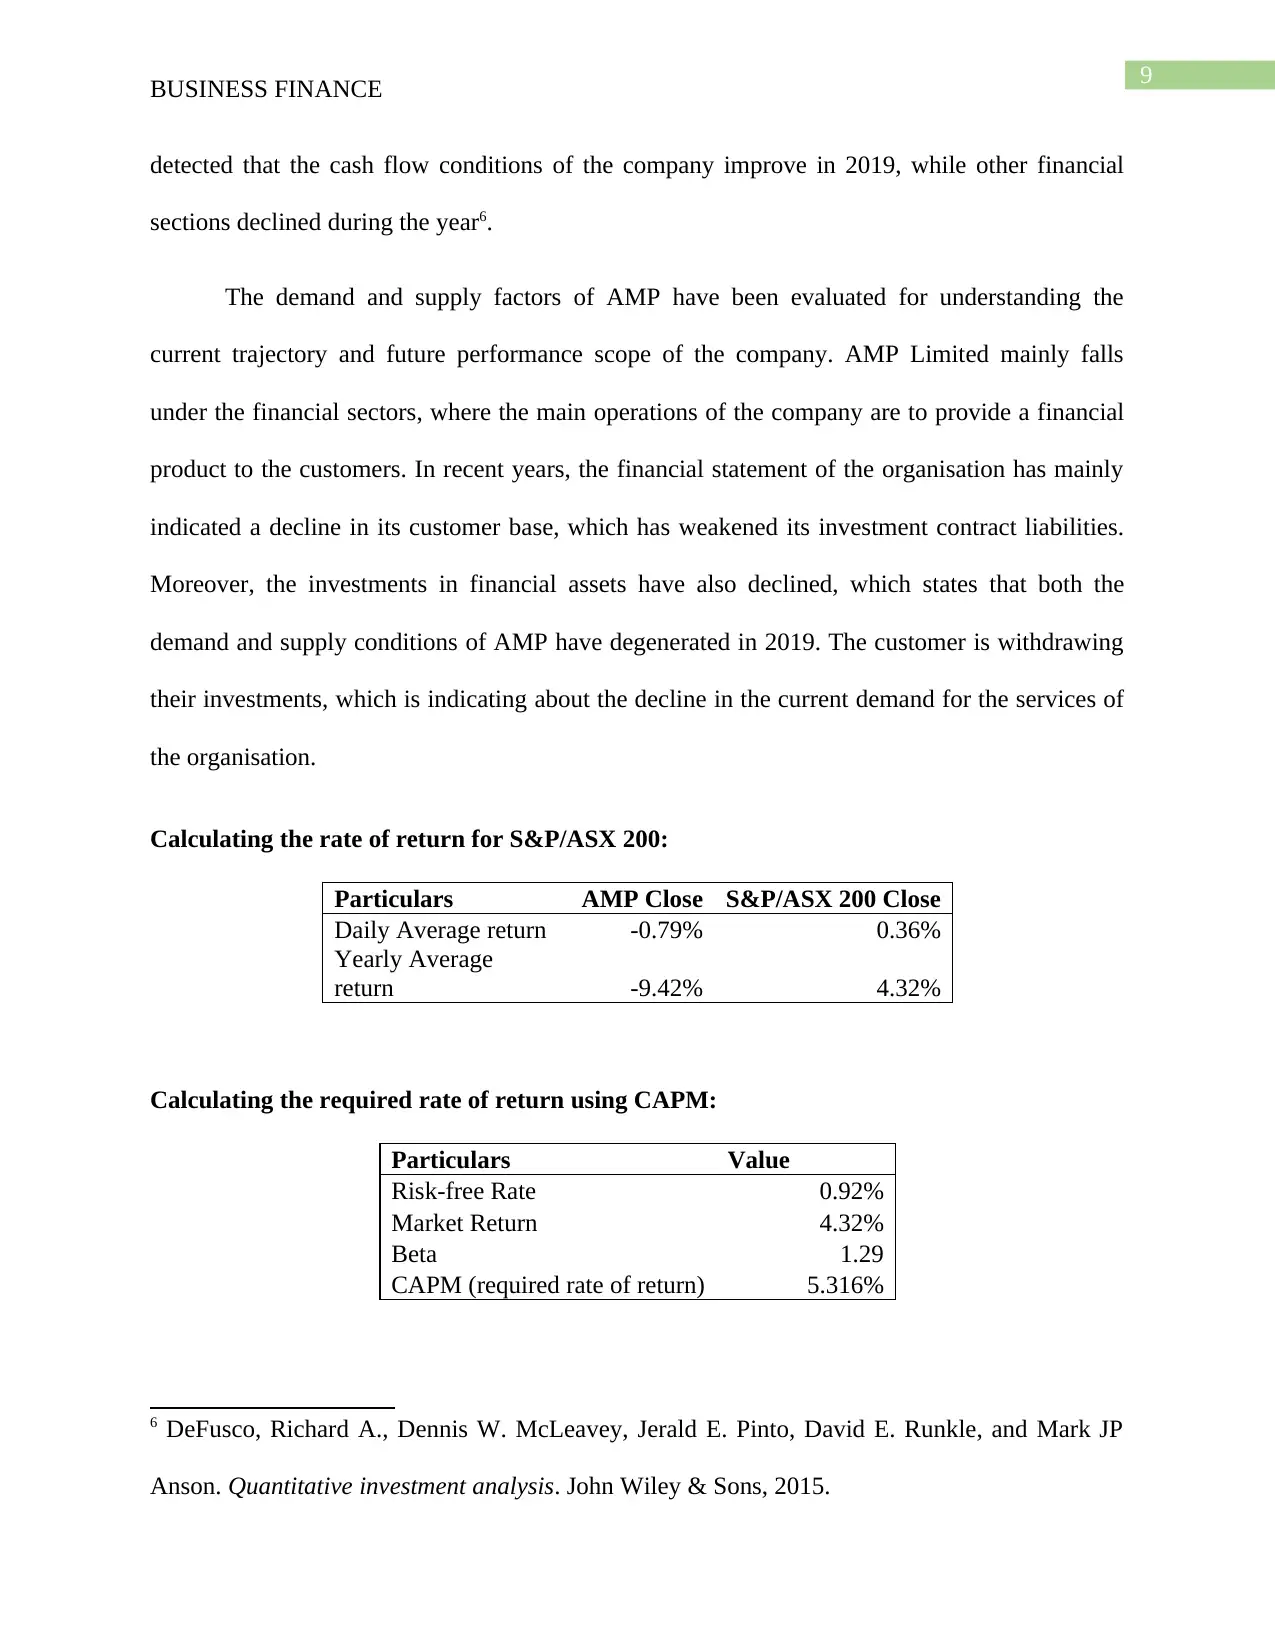
Calculating the rate of return for S&P/ASX 200:
Particulars AMP Close S&P/ASX 200 Close
Daily Average return -0.79% 0.36%
Yearly Average
return -9.42% 4.32%
Calculating the required rate of return using CAPM:
Particulars Value
Risk-free Rate 0.92%
Market Return 4.32%
Beta 1.29
CAPM (required rate of return) 5.316%
6 DeFusco, Richard A., Dennis W. McLeavey, Jerald E. Pinto, David E. Runkle, and Mark JP
Anson. Quantitative investment analysis. John Wiley & Sons, 2015.
BUSINESS FINANCE
detected that the cash flow conditions of the company improve in 2019, while other financial
sections declined during the year6.
The demand and supply factors of AMP have been evaluated for understanding the
current trajectory and future performance scope of the company. AMP Limited mainly falls
under the financial sectors, where the main operations of the company are to provide a financial
product to the customers. In recent years, the financial statement of the organisation has mainly
indicated a decline in its customer base, which has weakened its investment contract liabilities.
Moreover, the investments in financial assets have also declined, which states that both the
demand and supply conditions of AMP have degenerated in 2019. The customer is withdrawing
their investments, which is indicating about the decline in the current demand for the services of
the organisation.
Calculating the rate of return for S&P/ASX 200:
Particulars AMP Close S&P/ASX 200 Close
Daily Average return -0.79% 0.36%
Yearly Average
return -9.42% 4.32%
Calculating the required rate of return using CAPM:
Particulars Value
Risk-free Rate 0.92%
Market Return 4.32%
Beta 1.29
CAPM (required rate of return) 5.316%
6 DeFusco, Richard A., Dennis W. McLeavey, Jerald E. Pinto, David E. Runkle, and Mark JP
Anson. Quantitative investment analysis. John Wiley & Sons, 2015.
Paraphrase This Document
Need a fresh take? Get an instant paraphrase of this document with our AI Paraphraser
10
BUSINESS FINANCE
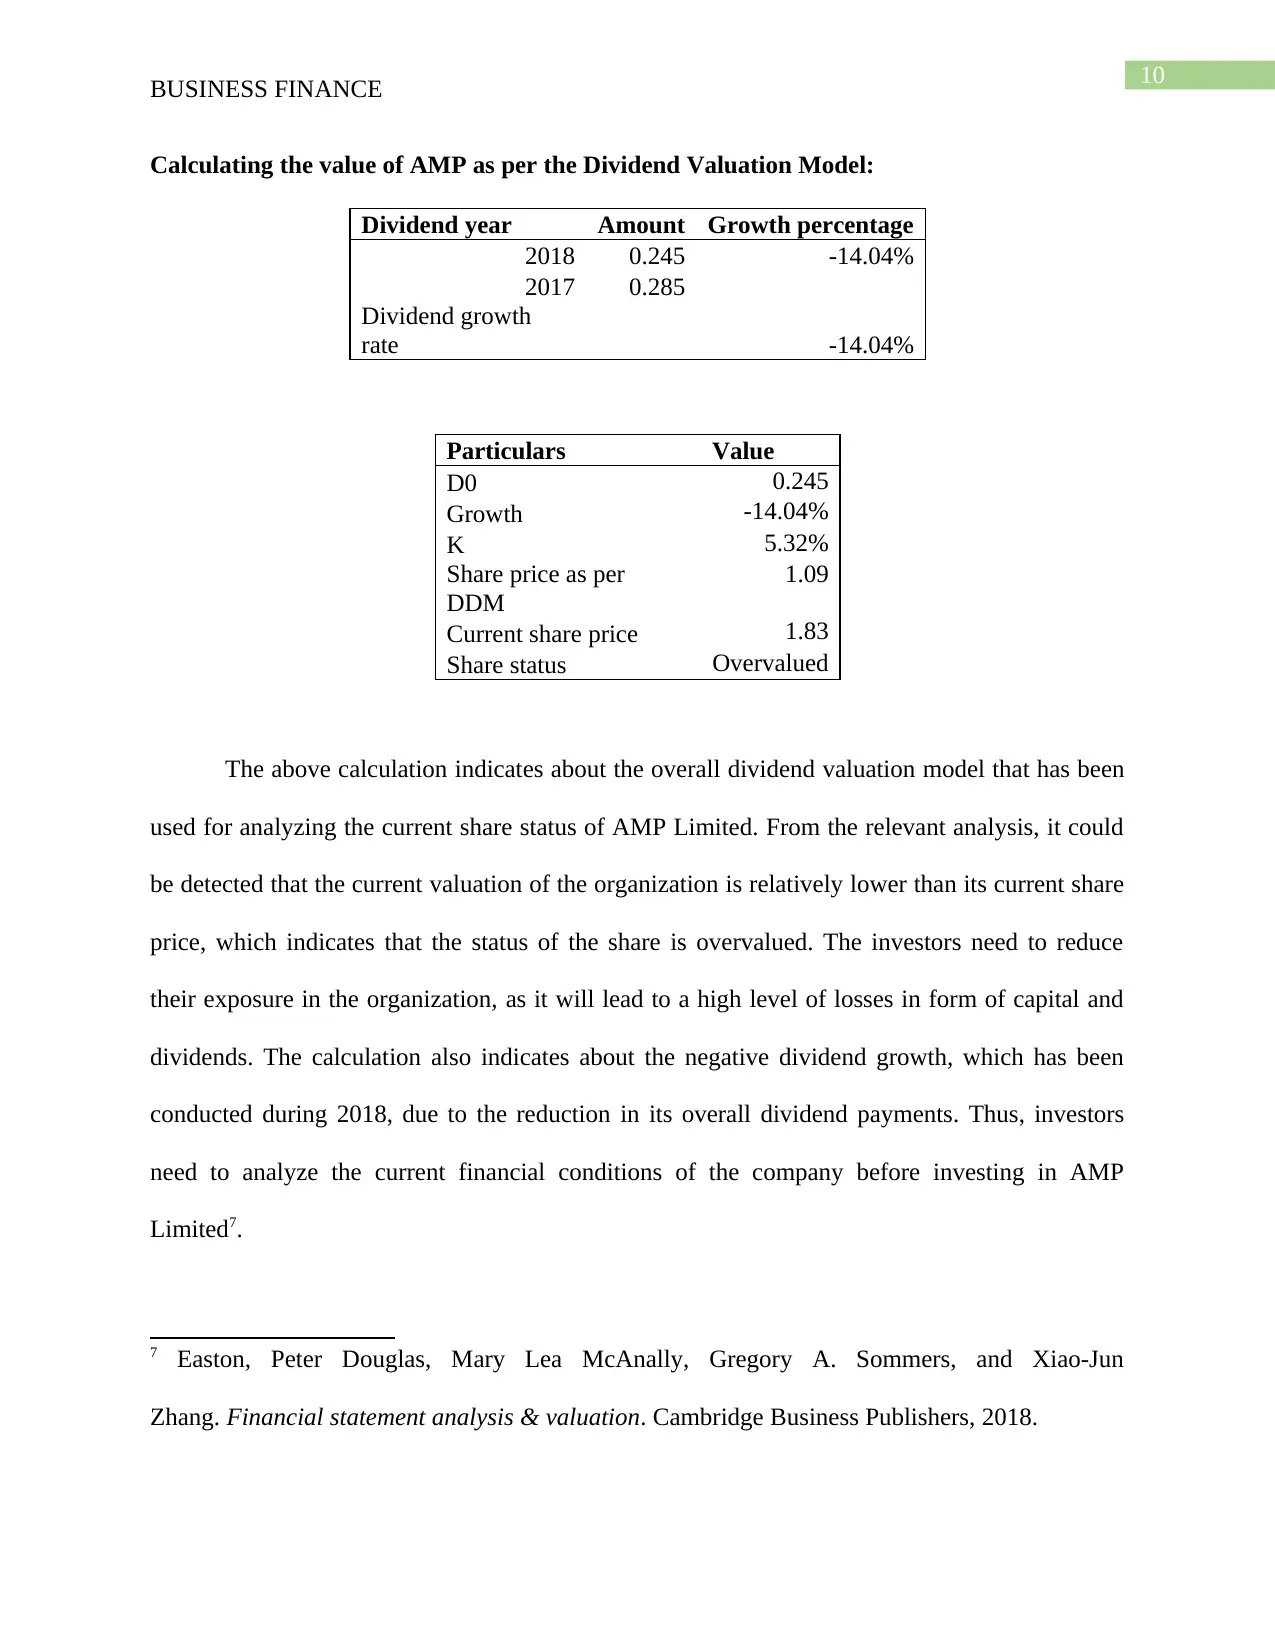
Calculating the value of AMP as per the Dividend Valuation Model:
Dividend year Amount Growth percentage
2018 0.245 -14.04%
2017 0.285
Dividend growth
rate -14.04%
Particulars Value
D0 0.245
Growth -14.04%
K 5.32%
Share price as per
DDM
1.09
Current share price 1.83
Share status Overvalued
The above calculation indicates about the overall dividend valuation model that has been
used for analyzing the current share status of AMP Limited. From the relevant analysis, it could
be detected that the current valuation of the organization is relatively lower than its current share
price, which indicates that the status of the share is overvalued. The investors need to reduce
their exposure in the organization, as it will lead to a high level of losses in form of capital and
dividends. The calculation also indicates about the negative dividend growth, which has been
conducted during 2018, due to the reduction in its overall dividend payments. Thus, investors
need to analyze the current financial conditions of the company before investing in AMP
Limited7.
7 Easton, Peter Douglas, Mary Lea McAnally, Gregory A. Sommers, and Xiao-Jun
Zhang. Financial statement analysis & valuation. Cambridge Business Publishers, 2018.
BUSINESS FINANCE
Calculating the value of AMP as per the Dividend Valuation Model:
Dividend year Amount Growth percentage
2018 0.245 -14.04%
2017 0.285
Dividend growth
rate -14.04%
Particulars Value
D0 0.245
Growth -14.04%
K 5.32%
Share price as per
DDM
1.09
Current share price 1.83
Share status Overvalued
The above calculation indicates about the overall dividend valuation model that has been
used for analyzing the current share status of AMP Limited. From the relevant analysis, it could
be detected that the current valuation of the organization is relatively lower than its current share
price, which indicates that the status of the share is overvalued. The investors need to reduce
their exposure in the organization, as it will lead to a high level of losses in form of capital and
dividends. The calculation also indicates about the negative dividend growth, which has been
conducted during 2018, due to the reduction in its overall dividend payments. Thus, investors
need to analyze the current financial conditions of the company before investing in AMP
Limited7.
7 Easton, Peter Douglas, Mary Lea McAnally, Gregory A. Sommers, and Xiao-Jun
Zhang. Financial statement analysis & valuation. Cambridge Business Publishers, 2018.
11
BUSINESS FINANCE
Drawing the graph of AMP, while analysing the results:
11/1/2009
2/28/2010
6/27/2010
10/24/2010
2/20/2011
6/19/2011
10/16/2011
2/12/2012
6/10/2012
10/7/2012
2/3/2013
6/2/2013
9/29/2013
1/26/2014
5/25/2014
9/21/2014
1/18/2015
5/17/2015
9/13/2015
1/10/2016
5/8/2016
9/4/2016
1/1/2017
4/30/2017
8/27/2017
12/24/2017
4/22/2018
8/19/2018
12/16/2018
4/14/2019
8/11/2019
0
1
2
3
4
5
6
AMP Adj Close
12/1/2009
4/1/2010
8/1/2010
12/1/2010
4/1/2011
8/1/2011
12/1/2011
4/1/2012
8/1/2012
12/1/2012
4/1/2013
8/1/2013
12/1/2013
4/1/2014
8/1/2014
12/1/2014
4/1/2015
8/1/2015
12/1/2015
4/1/2016
8/1/2016
12/1/2016
4/1/2017
8/1/2017
12/1/2017
4/1/2018
8/1/2018
12/1/2018
4/1/2019
8/1/2019
-25.00%
-20.00%
-15.00%
-10.00%
-5.00%
0.00%
5.00%
10.00%
15.00%
20.00%
Return AMP Close
Return AMP Close
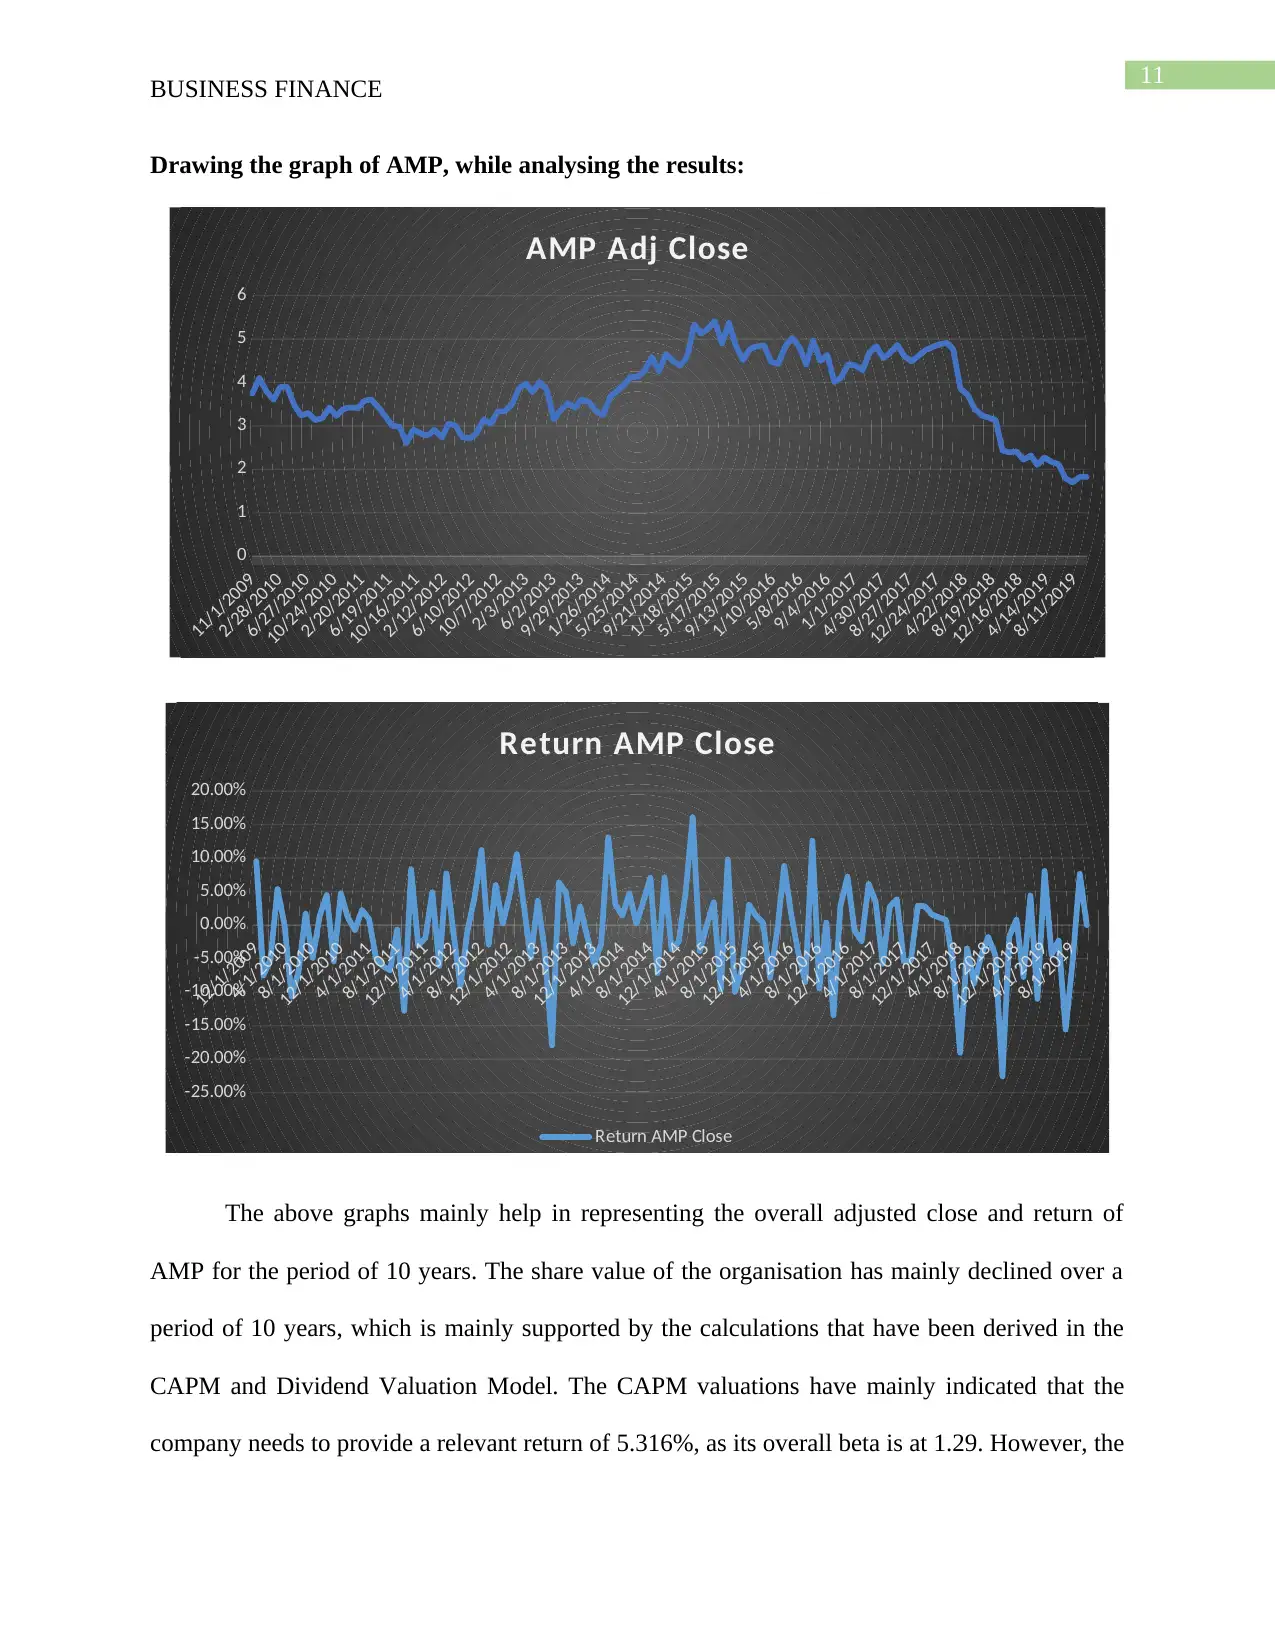
The above graphs mainly help in representing the overall adjusted close and return of
AMP for the period of 10 years. The share value of the organisation has mainly declined over a
period of 10 years, which is mainly supported by the calculations that have been derived in the
CAPM and Dividend Valuation Model. The CAPM valuations have mainly indicated that the
company needs to provide a relevant return of 5.316%, as its overall beta is at 1.29. However, the
BUSINESS FINANCE
Drawing the graph of AMP, while analysing the results:
11/1/2009
2/28/2010
6/27/2010
10/24/2010
2/20/2011
6/19/2011
10/16/2011
2/12/2012
6/10/2012
10/7/2012
2/3/2013
6/2/2013
9/29/2013
1/26/2014
5/25/2014
9/21/2014
1/18/2015
5/17/2015
9/13/2015
1/10/2016
5/8/2016
9/4/2016
1/1/2017
4/30/2017
8/27/2017
12/24/2017
4/22/2018
8/19/2018
12/16/2018
4/14/2019
8/11/2019
0
1
2
3
4
5
6
AMP Adj Close
12/1/2009
4/1/2010
8/1/2010
12/1/2010
4/1/2011
8/1/2011
12/1/2011
4/1/2012
8/1/2012
12/1/2012
4/1/2013
8/1/2013
12/1/2013
4/1/2014
8/1/2014
12/1/2014
4/1/2015
8/1/2015
12/1/2015
4/1/2016
8/1/2016
12/1/2016
4/1/2017
8/1/2017
12/1/2017
4/1/2018
8/1/2018
12/1/2018
4/1/2019
8/1/2019
-25.00%
-20.00%
-15.00%
-10.00%
-5.00%
0.00%
5.00%
10.00%
15.00%
20.00%
Return AMP Close
Return AMP Close
The above graphs mainly help in representing the overall adjusted close and return of
AMP for the period of 10 years. The share value of the organisation has mainly declined over a
period of 10 years, which is mainly supported by the calculations that have been derived in the
CAPM and Dividend Valuation Model. The CAPM valuations have mainly indicated that the
company needs to provide a relevant return of 5.316%, as its overall beta is at 1.29. However, the
⊘ This is a preview!⊘
Do you want full access?
Subscribe today to unlock all pages.
Trusted by 1+ million students worldwide
1 out of 18
Related Documents


Your All-in-One AI-Powered Toolkit for Academic Success.
+13062052269
info@desklib.com
Available 24*7 on WhatsApp / Email
![[object Object]](/_next/static/media/star-bottom.7253800d.svg)
Unlock your academic potential
Copyright © 2020–2026 A2Z Services. All Rights Reserved. Developed and managed by ZUCOL.