AMP Limited Financial Report: Accounting and Financial Management
VerifiedAdded on 2023/06/04
|16
|3830
|341
Report
AI Summary
This report provides a financial analysis of AMP Limited, focusing on capital structure, cost of equity, weighted average cost of capital, financial position, and performance. Ratio analysis and material risks associated with the company are studied to identify the financial standing and stock level of the business. The report also includes an analysis of Saturn Petcare Australia and New Zealand, evaluating a new project and replacement options using capital budgeting techniques and different sales scenarios. Three scenarios are examined: normal sales, 10% higher sales, and 10% lower sales, with NPV calculations for each. The report concludes with a recommendation against investing in the project based on potential losses under lower sales conditions.
Running Head: Accounting and financial management
1
Project Report: Accounting and financial management
1
Project Report: Accounting and financial management
Paraphrase This Document
Need a fresh take? Get an instant paraphrase of this document with our AI Paraphraser
Accounting and financial management 2
Executive summary
AMP limited is an Australian company which has been taken into the context while
doing the study. In the report, the capital structure level, cost of equity, weighted average cost
of capital, financial position and performance, ratio analysis, material risk associated with the
company etc has been studied in order to identify the financial position and the stock level of
the business.
Accounting and financial management 3
Contents
Part A................................................................................................................................5
Introduction.......................................................................................................................5
Question 1:........................................................................................................................5
Normal Scenario...........................................................................................................5
NPV..........................................................................................................................5
Payback period..........................................................................................................6
Profitability index.....................................................................................................6
Question 2:........................................................................................................................6
Higher sales..................................................................................................................6
NPV..........................................................................................................................7
Question 3:........................................................................................................................7
Lower Sales..................................................................................................................7
NPV..........................................................................................................................8
Findings............................................................................................................................8
Decision process...............................................................................................................9
Recommendation and conclusion.....................................................................................9
Part B................................................................................................................................9
Introduction.......................................................................................................................9
Capital structure................................................................................................................9
Debt and equity level..................................................................................................10
Comparison in the capital structure............................................................................10
Changes in the capital structure..................................................................................11
Cost of equity and total cost of capital...........................................................................12
⊘ This is a preview!⊘
Do you want full access?
Subscribe today to unlock all pages.
Trusted by 1+ million students worldwide
Accounting and financial management 4
Ratio analysis..................................................................................................................12
Material risk....................................................................................................................13
Conclusion......................................................................................................................14
References.......................................................................................................................15
Paraphrase This Document
Need a fresh take? Get an instant paraphrase of this document with our AI Paraphraser
Accounting and financial management 5
Part A:
Introduction:
Accounting and financial management is a process which focuses on the various
financial evaluation tools on the business to make a better decision in order to improve the
financial position of the business. In the report, the focus has been done on a case of Saturn
Petcare Australia and New Zealand. The case brief about a new project of the company and a
replacement option of the company where the management is confused to chose the project or
not. The capital budgeting techniques have been applied on project “buddy” along with the
different scenarios and changes in the sale position to evaluate the overall position of the
business. Further, the replacement options of the business have also been discussed to reach
over a conclusion.
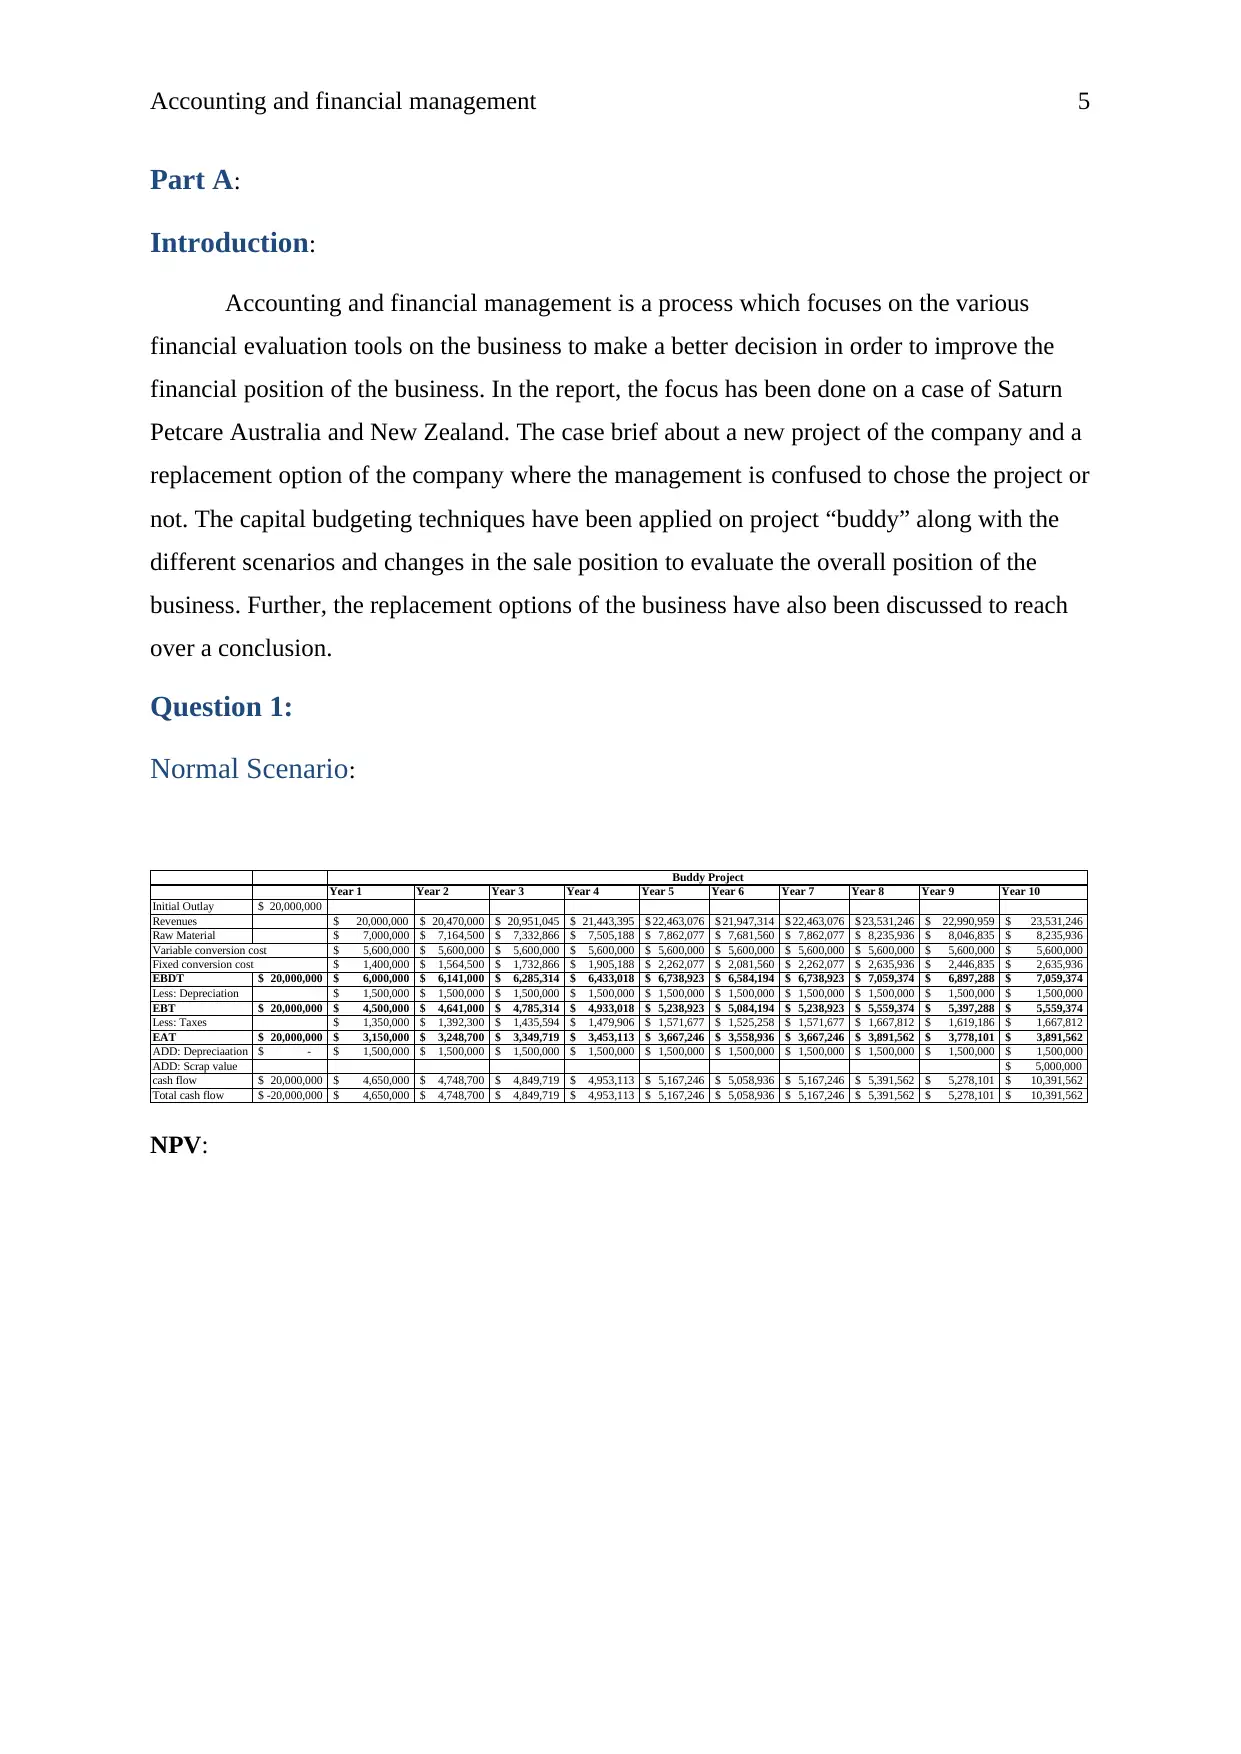
Question 1:
Normal Scenario:
Year 1 Year 2 Year 3 Year 4 Year 5 Year 6 Year 7 Year 8 Year 9 Year 10
Initial Outlay 20,000,000$
Revenues 20,000,000$ 20,470,000$ 20,951,045$ 21,443,395$ 22,463,076$ 21,947,314$ 22,463,076$ 23,531,246$ 22,990,959$ 23,531,246$
Raw Material 7,000,000$ 7,164,500$ 7,332,866$ 7,505,188$ 7,862,077$ 7,681,560$ 7,862,077$ 8,235,936$ 8,046,835$ 8,235,936$
Variable conversion cost 5,600,000$ 5,600,000$ 5,600,000$ 5,600,000$ 5,600,000$ 5,600,000$ 5,600,000$ 5,600,000$ 5,600,000$ 5,600,000$
Fixed conversion cost 1,400,000$ 1,564,500$ 1,732,866$ 1,905,188$ 2,262,077$ 2,081,560$ 2,262,077$ 2,635,936$ 2,446,835$ 2,635,936$
EBDT 20,000,000$ 6,000,000$ 6,141,000$ 6,285,314$ 6,433,018$ 6,738,923$ 6,584,194$ 6,738,923$ 7,059,374$ 6,897,288$ 7,059,374$
Less: Depreciation 1,500,000$ 1,500,000$ 1,500,000$ 1,500,000$ 1,500,000$ 1,500,000$ 1,500,000$ 1,500,000$ 1,500,000$ 1,500,000$
EBT 20,000,000$ 4,500,000$ 4,641,000$ 4,785,314$ 4,933,018$ 5,238,923$ 5,084,194$ 5,238,923$ 5,559,374$ 5,397,288$ 5,559,374$
Less: Taxes 1,350,000$ 1,392,300$ 1,435,594$ 1,479,906$ 1,571,677$ 1,525,258$ 1,571,677$ 1,667,812$ 1,619,186$ 1,667,812$
EAT 20,000,000$ 3,150,000$ 3,248,700$ 3,349,719$ 3,453,113$ 3,667,246$ 3,558,936$ 3,667,246$ 3,891,562$ 3,778,101$ 3,891,562$
ADD: Depreciaation -$ 1,500,000$ 1,500,000$ 1,500,000$ 1,500,000$ 1,500,000$ 1,500,000$ 1,500,000$ 1,500,000$ 1,500,000$ 1,500,000$
ADD: Scrap value 5,000,000$
cash flow 20,000,000$ 4,650,000$ 4,748,700$ 4,849,719$ 4,953,113$ 5,167,246$ 5,058,936$ 5,167,246$ 5,391,562$ 5,278,101$ 10,391,562$
Total cash flow -20,000,000$ 4,650,000$ 4,748,700$ 4,849,719$ 4,953,113$ 5,167,246$ 5,058,936$ 5,167,246$ 5,391,562$ 5,278,101$ 10,391,562$
Buddy Project
NPV:
Part A:
Introduction:
Accounting and financial management is a process which focuses on the various
financial evaluation tools on the business to make a better decision in order to improve the
financial position of the business. In the report, the focus has been done on a case of Saturn
Petcare Australia and New Zealand. The case brief about a new project of the company and a
replacement option of the company where the management is confused to chose the project or
not. The capital budgeting techniques have been applied on project “buddy” along with the
different scenarios and changes in the sale position to evaluate the overall position of the
business. Further, the replacement options of the business have also been discussed to reach
over a conclusion.
Question 1:
Normal Scenario:
Year 1 Year 2 Year 3 Year 4 Year 5 Year 6 Year 7 Year 8 Year 9 Year 10
Initial Outlay 20,000,000$
Revenues 20,000,000$ 20,470,000$ 20,951,045$ 21,443,395$ 22,463,076$ 21,947,314$ 22,463,076$ 23,531,246$ 22,990,959$ 23,531,246$
Raw Material 7,000,000$ 7,164,500$ 7,332,866$ 7,505,188$ 7,862,077$ 7,681,560$ 7,862,077$ 8,235,936$ 8,046,835$ 8,235,936$
Variable conversion cost 5,600,000$ 5,600,000$ 5,600,000$ 5,600,000$ 5,600,000$ 5,600,000$ 5,600,000$ 5,600,000$ 5,600,000$ 5,600,000$
Fixed conversion cost 1,400,000$ 1,564,500$ 1,732,866$ 1,905,188$ 2,262,077$ 2,081,560$ 2,262,077$ 2,635,936$ 2,446,835$ 2,635,936$
EBDT 20,000,000$ 6,000,000$ 6,141,000$ 6,285,314$ 6,433,018$ 6,738,923$ 6,584,194$ 6,738,923$ 7,059,374$ 6,897,288$ 7,059,374$
Less: Depreciation 1,500,000$ 1,500,000$ 1,500,000$ 1,500,000$ 1,500,000$ 1,500,000$ 1,500,000$ 1,500,000$ 1,500,000$ 1,500,000$
EBT 20,000,000$ 4,500,000$ 4,641,000$ 4,785,314$ 4,933,018$ 5,238,923$ 5,084,194$ 5,238,923$ 5,559,374$ 5,397,288$ 5,559,374$
Less: Taxes 1,350,000$ 1,392,300$ 1,435,594$ 1,479,906$ 1,571,677$ 1,525,258$ 1,571,677$ 1,667,812$ 1,619,186$ 1,667,812$
EAT 20,000,000$ 3,150,000$ 3,248,700$ 3,349,719$ 3,453,113$ 3,667,246$ 3,558,936$ 3,667,246$ 3,891,562$ 3,778,101$ 3,891,562$
ADD: Depreciaation -$ 1,500,000$ 1,500,000$ 1,500,000$ 1,500,000$ 1,500,000$ 1,500,000$ 1,500,000$ 1,500,000$ 1,500,000$ 1,500,000$
ADD: Scrap value 5,000,000$
cash flow 20,000,000$ 4,650,000$ 4,748,700$ 4,849,719$ 4,953,113$ 5,167,246$ 5,058,936$ 5,167,246$ 5,391,562$ 5,278,101$ 10,391,562$
Total cash flow -20,000,000$ 4,650,000$ 4,748,700$ 4,849,719$ 4,953,113$ 5,167,246$ 5,058,936$ 5,167,246$ 5,391,562$ 5,278,101$ 10,391,562$
Buddy Project
NPV:
Accounting and financial management 6
Years Cash Outflow Cash Inflow Factors Cash Inflow PVCash Outflow PV
0 -20,000,000$ 1.000 -$ -20,000,000$
1 4,650,000$ 0.833 3,875,000$
2 4,748,700$ 0.694 3,297,708$
3 4,849,719$ 0.579 2,806,551$
4 4,953,113$ 0.482 2,388,654$
5 5,167,246$ 0.402 2,076,600$
6 5,058,936$ 0.335 1,694,227$
7 5,167,246$ 0.279 1,442,084$
8 5,391,562$ 0.233 1,253,905$
9 5,278,101$ 0.194 1,022,931$
10 10,391,562$ 0.162 1,678,295$
21,535,956$ -20,000,000$
1,535,956$
Calculation of Net Present Value
Total
NPV= Total Cash Inflow PV -Total cash outflow PV
Payback period:
Years Cash Outflow Cash Inflow Cash flows CF
0 -20000000 -20,000,000$ -20,000,000$
1 4650000 4,650,000$ -15,350,000$
2 4748700 4,748,700$ -10,601,300$
3 4849719.45 4,849,719$ -5,751,581$
4 4953112.857 4,953,113$ -798,468$
5 5167246.005 5,167,246$ 4,368,778$
6 5058936.009 5,058,936$ 9,427,714$
7 5167246.005 5,167,246$ 14,594,960$
8 5391561.667 5,391,562$ 19,986,522$
9 5278101.287 5,278,101$ 25,264,623$
10 10391561.67 10,391,562$ 35,656,185$
4.15
Calculation Of Payaback period
Profitability index:
⊘ This is a preview!⊘
Do you want full access?
Subscribe today to unlock all pages.
Trusted by 1+ million students worldwide
Accounting and financial management 7
Years Cash Outflow Cash InflowPV factor P.V.
0 -20000000 - 1.000 -20000000
1 4650000 0.833 3875000
2 4748700 0.694 3297708.333
3 4849719 0.579 2806550.608
4 4953113 0.482 2388653.963
5 5167246 0.402 2076600.279
6 5058936 0.335 1694227.434
7 5167246 0.279 1442083.527
8 5391562 0.233 1253904.926
9 5278101 0.194 1022931.39
10 10391562 0.162 1678295.224
7091442.50
0.355
Calculation of profitability index
PI= Total Cash Inflow/Initial Investment
Question 2:
Higher sales:
10% higher than Estimated sales
Year 1 Year 2 Year 3 Year 4 Year 5 Year 6 Year 7 Year 8 Year 9 Year 10
20,000,000$
22,000,000$ 22,517,000$ 23,046,150$ 23,587,734$ 24,709,384$ 24,142,046$ 24,709,384$ 25,884,371$ 25,290,054$ 25,884,371$
Raw Material 7,700,000$ 7,880,950$ 8,066,152$ 8,255,707$ 8,648,284$ 8,449,716$ 8,648,284$ 9,059,530$ 8,851,519$ 9,059,530$
Variable conversion cost 5,600,000$ 5,600,000$ 5,600,000$ 5,600,000$ 5,600,000$ 5,600,000$ 5,600,000$ 5,600,000$ 5,600,000$ 5,600,000$
Fixed conversion cost 2,100,000$ 2,280,950$ 2,466,152$ 2,655,707$ 3,048,284$ 2,849,716$ 3,048,284$ 3,459,530$ 3,251,519$ 3,459,530$
20,000,000$ 6,600,000$ 6,755,100$ 6,913,845$ 7,076,320$ 7,412,815$ 7,242,614$ 7,412,815$ 7,765,311$ 7,587,016$ 7,765,311$
Less: Depreciation 1,500,000$ 1,500,000$ 1,500,000$ 1,500,000$ 1,500,000$ 1,500,000$ 1,500,000$ 1,500,000$ 1,500,000$ 1,500,000$
20,000,000$ 5,100,000$ 5,255,100$ 5,413,845$ 5,576,320$ 5,912,815$ 5,742,614$ 5,912,815$ 6,265,311$ 6,087,016$ 6,265,311$
Less: Taxes 1,530,000$ 1,576,530$ 1,624,153$ 1,672,896$ 1,773,845$ 1,722,784$ 1,773,845$ 1,879,593$ 1,826,105$ 1,879,593$
20,000,000$ 3,570,000$ 3,678,570$ 3,789,691$ 3,903,424$ 4,138,971$ 4,019,830$ 4,138,971$ 4,385,718$ 4,260,911$ 4,385,718$
-$ 1,500,000$ 1,500,000$ 1,500,000$ 1,500,000$ 1,500,000$ 1,500,000$ 1,500,000$ 1,500,000$ 1,500,000$ 1,500,000$
ADD: Scrap value 5,000,000$
20,000,000$ 5,070,000$ 5,178,570$ 5,289,691$ 5,403,424$ 5,638,971$ 5,519,830$ 5,638,971$ 5,885,718$ 5,760,911$ 10,885,718$
-20,000,000$ 5,070,000$ 5,178,570$ 5,289,691$ 5,403,424$ 5,638,971$ 5,519,830$ 5,638,971$ 5,885,718$ 5,760,911$ 10,885,718$
Buddy Project
NPV:
Paraphrase This Document
Need a fresh take? Get an instant paraphrase of this document with our AI Paraphraser
Accounting and financial management 8
Years Cash Outflow Cash Inflow Factors P.V. ofCash InflowP.V. of Cash Outflow
0 -20,000,000$ 1.000 -$ -20,000,000$
1 5,070,000$ 0.833 4,225,000$
2 5,178,570$ 0.694 3,596,229$
3 5,289,691$ 0.579 3,061,164$
4 5,403,424$ 0.482 2,605,818$
5 5,638,971$ 0.402 2,266,176$
6 5,519,830$ 0.335 1,848,580$
7 5,638,971$ 0.279 1,573,733$
8 5,885,718$ 0.233 1,368,830$
9 5,760,911$ 0.194 1,116,503$
10 10,885,718$ 0.162 1,758,104$
23,420,137$ -20,000,000$
3,420,137$
Calculation of Net Present Value
Total
NPV= Total Cash Inflow PV -Total cash outflow PV
Question 3:
Lower Sales:
10% lower than Estimated sales
Year 1 Year 2 Year 3 Year 4 Year 5 Year 6 Year 7 Year 8 Year 9 Year 10
Initial Outlay 20,000,000$
Revenues 18,000,000$ 18,423,000$ 18,855,941$ 19,299,055$ 20,216,769$ 19,752,583$ 20,216,769$ 21,178,121$ 20,691,863$ 21,178,121$
Raw Material 6,300,000$ 6,448,050$ 6,599,579$ 6,754,669$ 7,075,869$ 6,913,404$ 7,075,869$ 7,412,343$ 7,242,152$ 7,412,343$
Variable conversion cost 5,600,000$ 5,600,000$ 5,600,000$ 5,600,000$ 5,600,000$ 5,600,000$ 5,600,000$ 5,600,000$ 5,600,000$ 5,600,000$
Fixed conversion cost 700,000$ 848,050$ 999,579$ 1,154,669$ 1,475,869$ 1,313,404$ 1,475,869$ 1,812,343$ 1,642,152$ 1,812,343$
EBDT 20,000,000$ 5,400,000$ 5,526,900$ 5,656,782$ 5,789,717$ 6,065,031$ 5,925,775$ 6,065,031$ 6,353,436$ 6,207,559$ 6,353,436$
Less: Depreciation 1,500,000$ 1,500,000$ 1,500,000$ 1,500,000$ 1,500,000$ 1,500,000$ 1,500,000$ 1,500,000$ 1,500,000$ 1,500,000$
EBT 20,000,000$ 3,900,000$ 4,026,900$ 4,156,782$ 4,289,717$ 4,565,031$ 4,425,775$ 4,565,031$ 4,853,436$ 4,707,559$ 4,853,436$
Less: Taxes 1,170,000$ 1,208,070$ 1,247,035$ 1,286,915$ 1,369,509$ 1,327,732$ 1,369,509$ 1,456,031$ 1,412,268$ 1,456,031$
EAT 20,000,000$ 2,730,000$ 2,818,830$ 2,909,748$ 3,002,802$ 3,195,521$ 3,098,042$ 3,195,521$ 3,397,406$ 3,295,291$ 3,397,406$
ADD: Depreciaation -$ 1,500,000$ 1,500,000$ 1,500,000$ 1,500,000$ 1,500,000$ 1,500,000$ 1,500,000$ 1,500,000$ 1,500,000$ 1,500,000$
ADD: Scrap value 5,000,000$
cash flow 20,000,000$ 4,230,000$ 4,318,830$ 4,409,748$ 4,502,802$ 4,695,521$ 4,598,042$ 4,695,521$ 4,897,406$ 4,795,291$ 9,897,406$
Total cash flow-20,000,000$ 4,230,000$ 4,318,830$ 4,409,748$ 4,502,802$ 4,695,521$ 4,598,042$ 4,695,521$ 4,897,406$ 4,795,291$ 9,897,406$
Buddy Project
NPV:
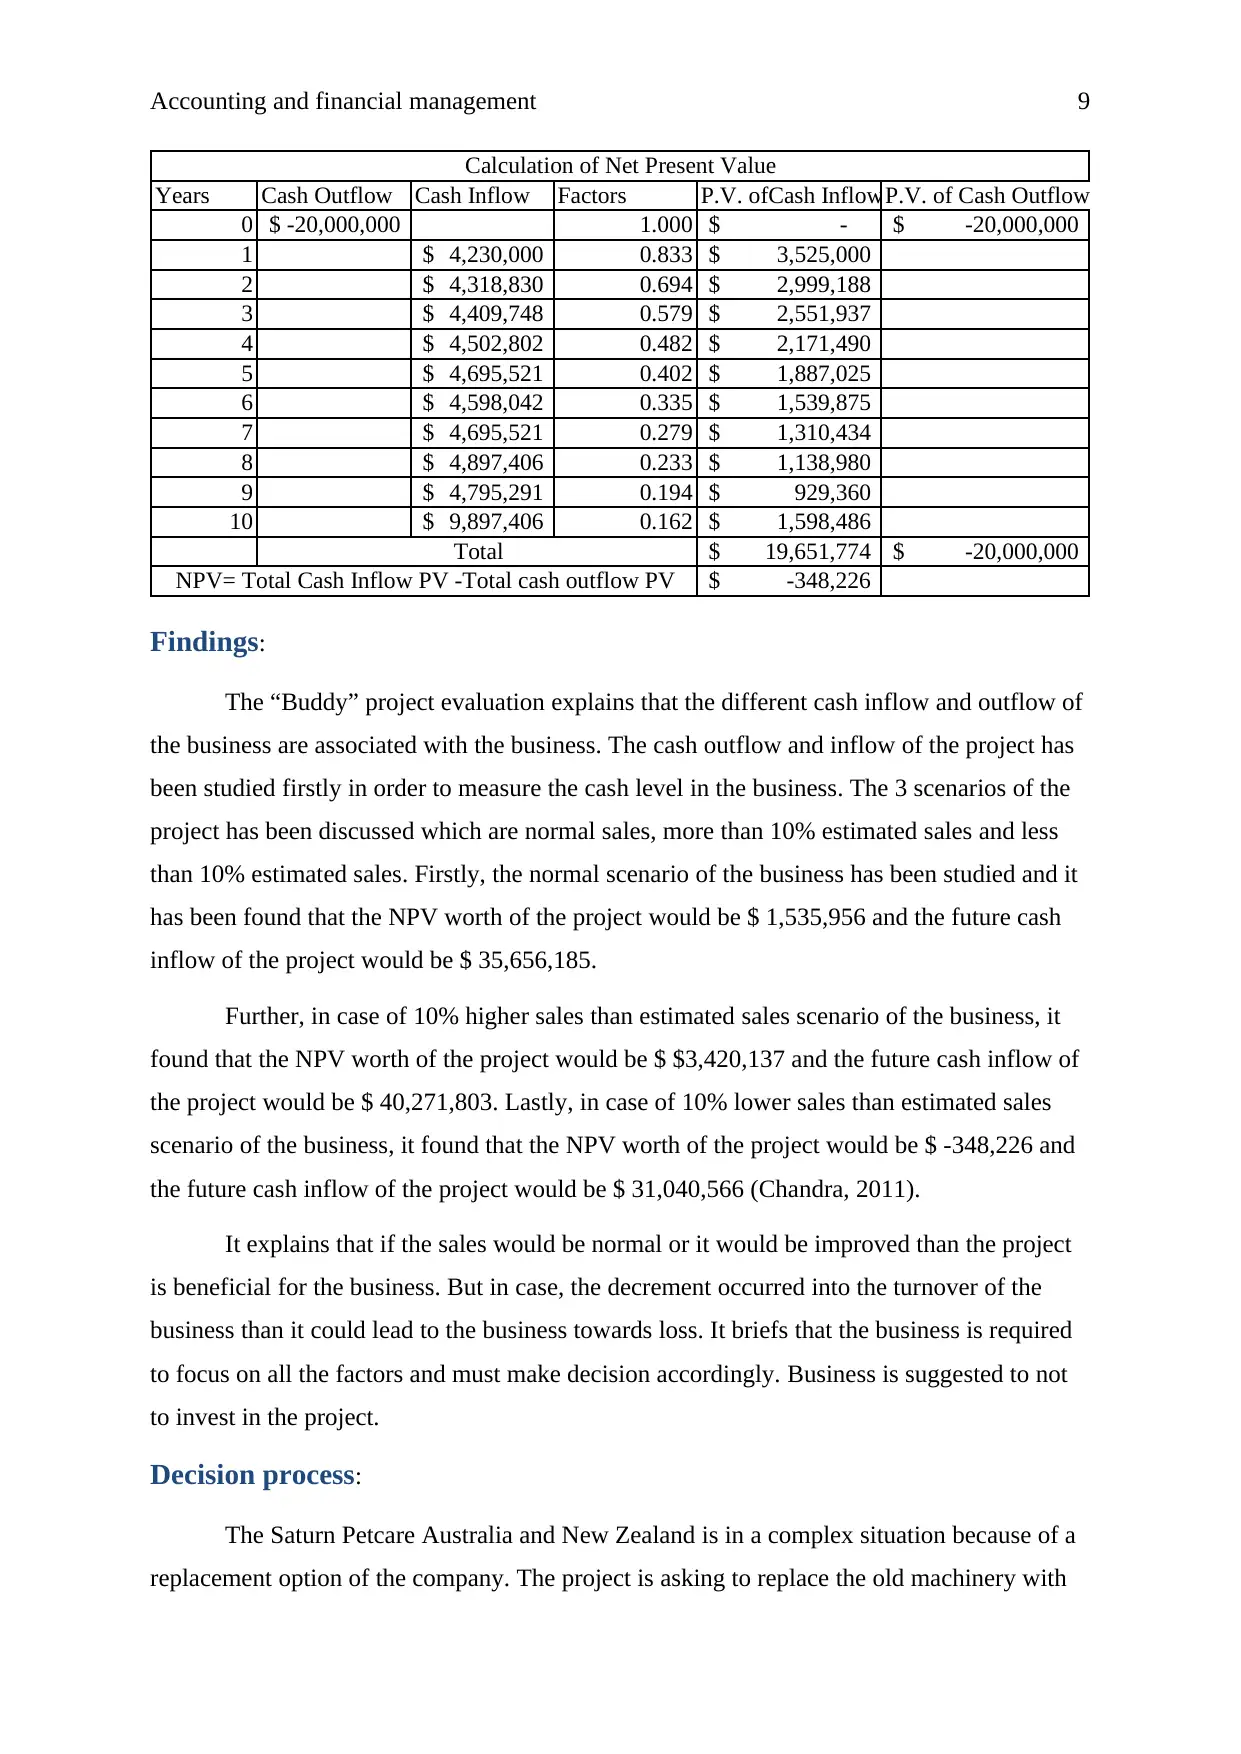
Accounting and financial management 9
Years Cash Outflow Cash Inflow Factors P.V. ofCash InflowP.V. of Cash Outflow
0 -20,000,000$ 1.000 -$ -20,000,000$
1 4,230,000$ 0.833 3,525,000$
2 4,318,830$ 0.694 2,999,188$
3 4,409,748$ 0.579 2,551,937$
4 4,502,802$ 0.482 2,171,490$
5 4,695,521$ 0.402 1,887,025$
6 4,598,042$ 0.335 1,539,875$
7 4,695,521$ 0.279 1,310,434$
8 4,897,406$ 0.233 1,138,980$
9 4,795,291$ 0.194 929,360$
10 9,897,406$ 0.162 1,598,486$
19,651,774$ -20,000,000$
-348,226$
Calculation of Net Present Value
Total
NPV= Total Cash Inflow PV -Total cash outflow PV
Findings:
The “Buddy” project evaluation explains that the different cash inflow and outflow of
the business are associated with the business. The cash outflow and inflow of the project has
been studied firstly in order to measure the cash level in the business. The 3 scenarios of the
project has been discussed which are normal sales, more than 10% estimated sales and less
than 10% estimated sales. Firstly, the normal scenario of the business has been studied and it
has been found that the NPV worth of the project would be $ 1,535,956 and the future cash
inflow of the project would be $ 35,656,185.
Further, in case of 10% higher sales than estimated sales scenario of the business, it
found that the NPV worth of the project would be $ $3,420,137 and the future cash inflow of
the project would be $ 40,271,803. Lastly, in case of 10% lower sales than estimated sales
scenario of the business, it found that the NPV worth of the project would be $ -348,226 and
the future cash inflow of the project would be $ 31,040,566 (Chandra, 2011).
It explains that if the sales would be normal or it would be improved than the project
is beneficial for the business. But in case, the decrement occurred into the turnover of the
business than it could lead to the business towards loss. It briefs that the business is required
to focus on all the factors and must make decision accordingly. Business is suggested to not
to invest in the project.
Decision process:
The Saturn Petcare Australia and New Zealand is in a complex situation because of a
replacement option of the company. The project is asking to replace the old machinery with
⊘ This is a preview!⊘
Do you want full access?
Subscribe today to unlock all pages.
Trusted by 1+ million students worldwide
Accounting and financial management 10
new one along with the different cash flows and outflows of the business. The NPV
calculations have been applied on both the projects to measure that which project is better for
the business. The project A explains that the NPV position of the project would be $ 16,732
whereas the project b explains that the NPV position of the project would be $ 69,135 (Rose
& Hudgins, 2012). It leads to a discussion that the cash flow and the profits from project B
are higher and thus the machineries must be replaced by the project B.
Recommendation and conclusion:
On the basis of the Buddy project and the replacement options of the business,
Business is suggested to not to invest in the project because of loss in case of lower sales and
in case of replacement, cash flow and the profits from project B is higher and thus the
machineries must be replaced by the project B.
Part B:
Introduction:
In the report, the focus has been done on an Australian company, AMP limited. The
report briefs about financial methods and techniques to measure the position and the industry
level of the business. The capital structure level, cost of equity, weighted average cost of
capital, financial position and performance, ratio analysis, material risk associated with the
company etc has been studied in the report to measure the overall level of the business.
Capital structure:
Capital structure is a financial gearing analysis tool that takes the context on different
sources of funds of the business (Fridson & Alvarez, 2011). In case of AMP limited, the
capital structure analysis is as follows:
Debt and equity level:
Debt and equity level of the company is as follows:
Paraphrase This Document
Need a fresh take? Get an instant paraphrase of this document with our AI Paraphraser
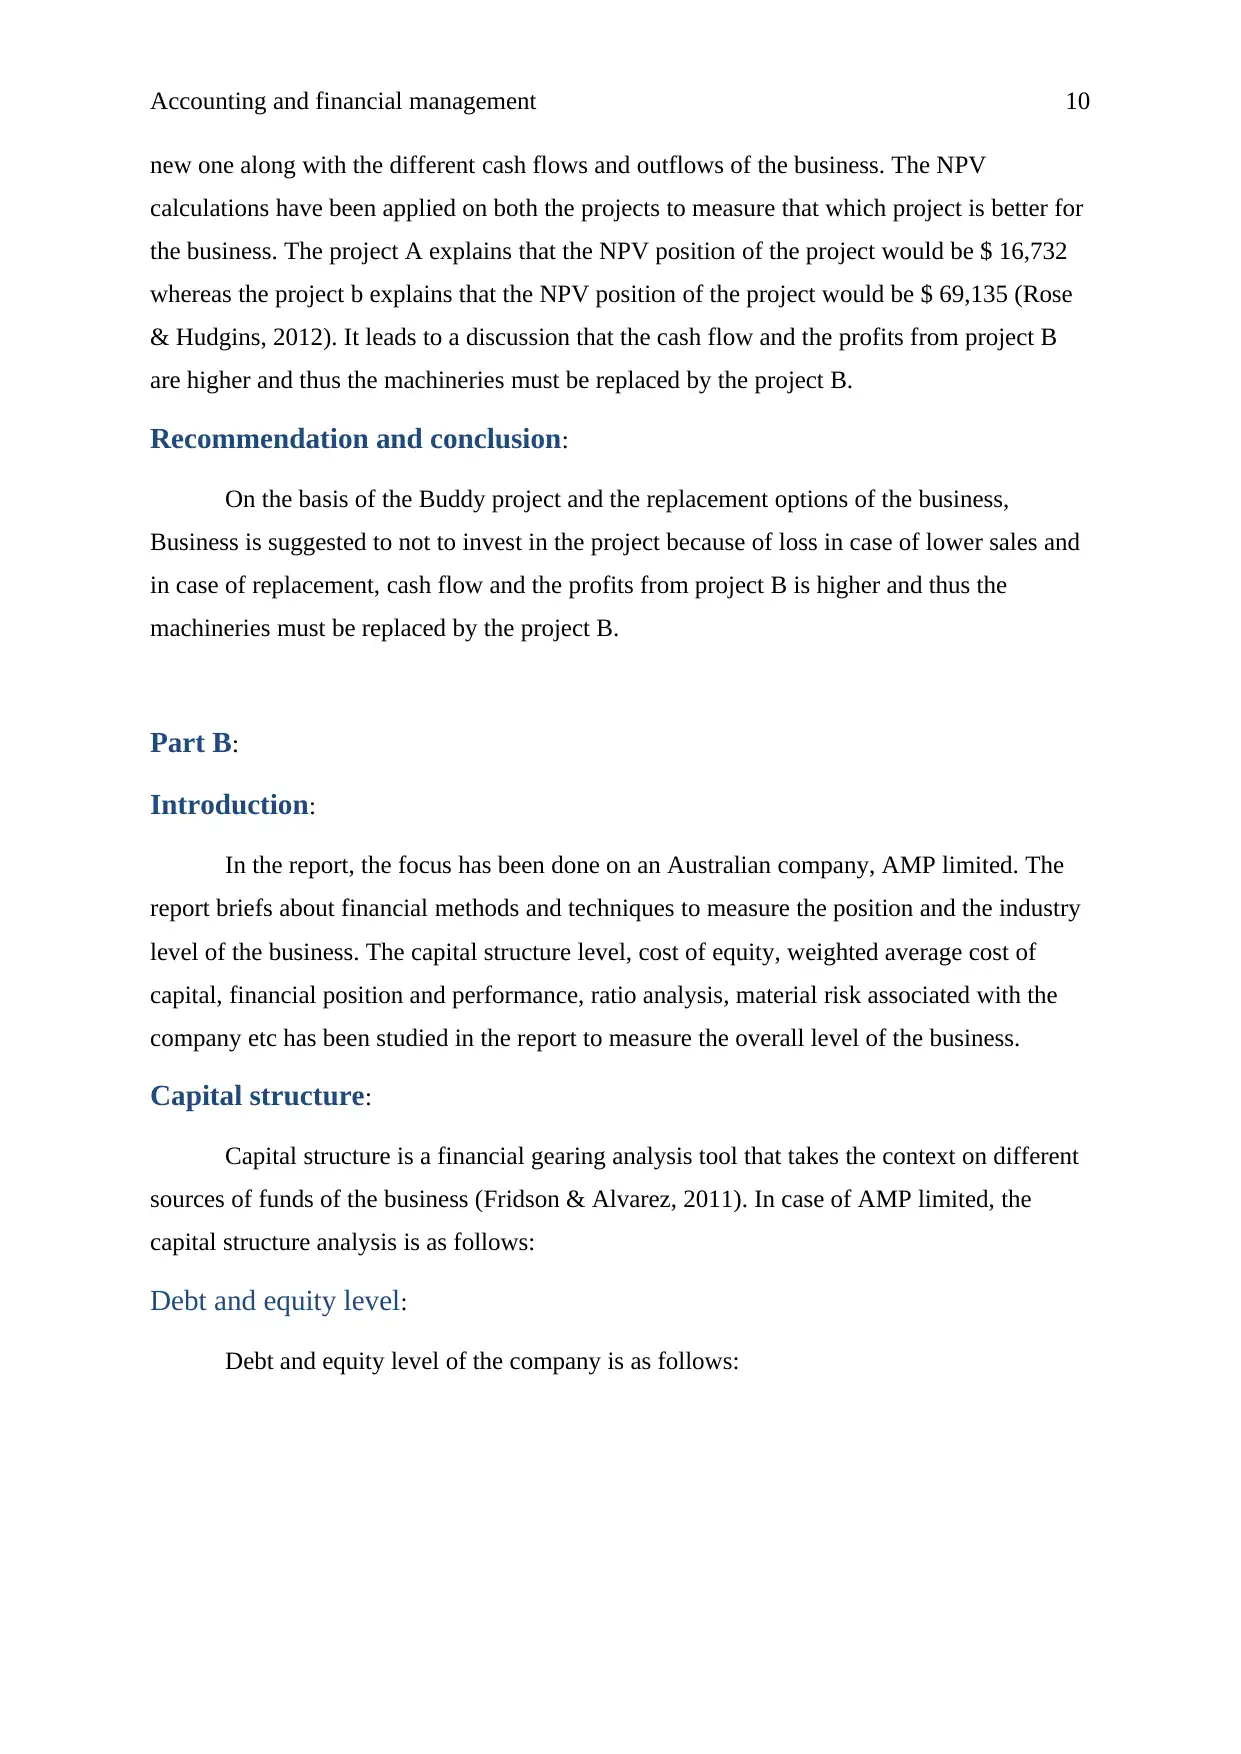
Accounting and financial management 11
Figure 1: Capital structure
(Annual report, 2017)
It explains that the financial gearing position of the company is lowest which must be
improved by the business in order to manage the risk and return position of the business.
Comparison in the capital structure:
The main competitor of the company is Australia and New Zealand bank. Capital
structure of both the firms have been compared which are as follows:
Figure 2: Comparative capital structure
(Annual report, 2017)
Accounting and financial management 12
It explains that the Australia and New Zealand bank’s capital structure is enough
optimal in terms of financial risk and cost of the business. The AMP should follow the
similar strategies in order to improve the position of the business.
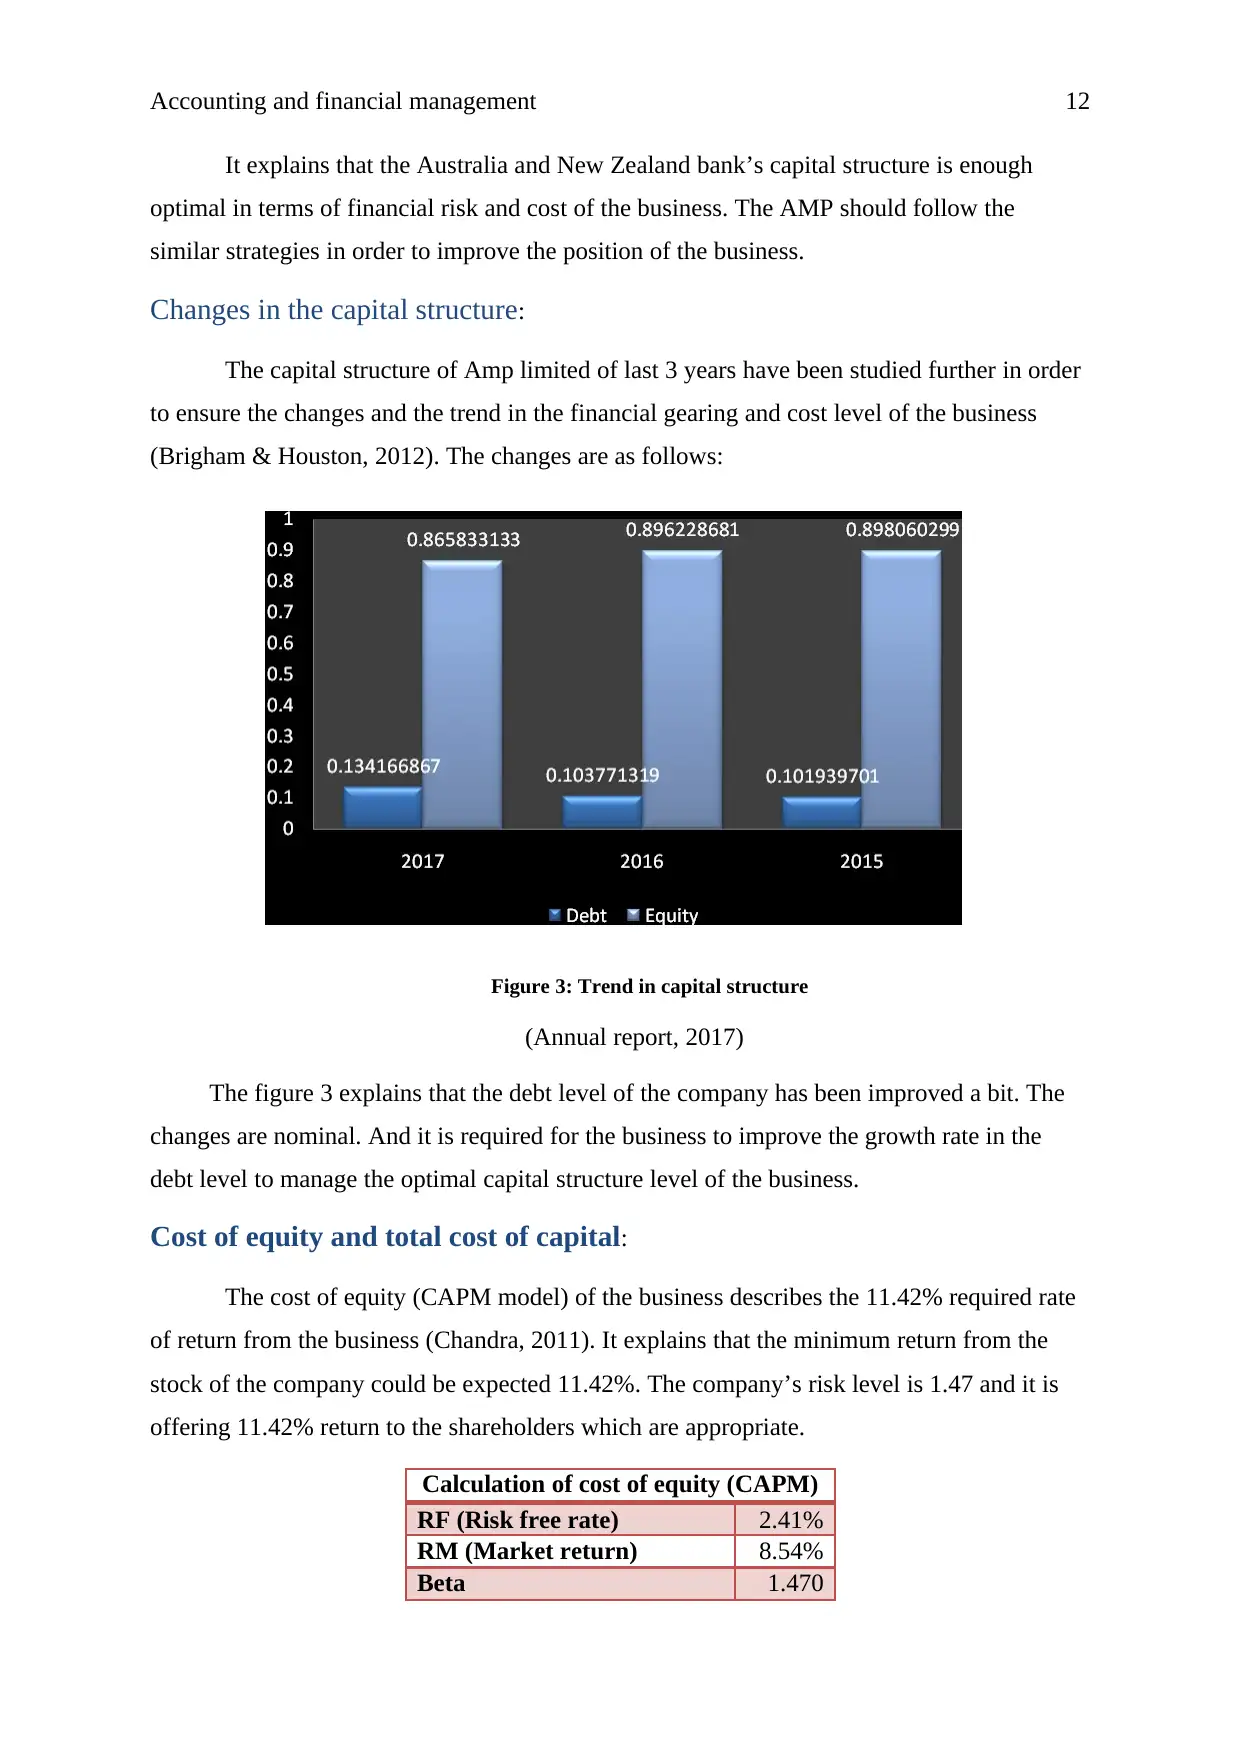
Changes in the capital structure:
The capital structure of Amp limited of last 3 years have been studied further in order
to ensure the changes and the trend in the financial gearing and cost level of the business
(Brigham & Houston, 2012). The changes are as follows:
Figure 3: Trend in capital structure
(Annual report, 2017)
The figure 3 explains that the debt level of the company has been improved a bit. The
changes are nominal. And it is required for the business to improve the growth rate in the
debt level to manage the optimal capital structure level of the business.
Cost of equity and total cost of capital:
The cost of equity (CAPM model) of the business describes the 11.42% required rate
of return from the business (Chandra, 2011). It explains that the minimum return from the
stock of the company could be expected 11.42%. The company’s risk level is 1.47 and it is
offering 11.42% return to the shareholders which are appropriate.
Calculation of cost of equity (CAPM)
RF (Risk free rate) 2.41%
RM (Market return) 8.54%
Beta 1.470
It explains that the Australia and New Zealand bank’s capital structure is enough
optimal in terms of financial risk and cost of the business. The AMP should follow the
similar strategies in order to improve the position of the business.
Changes in the capital structure:
The capital structure of Amp limited of last 3 years have been studied further in order
to ensure the changes and the trend in the financial gearing and cost level of the business
(Brigham & Houston, 2012). The changes are as follows:
Figure 3: Trend in capital structure
(Annual report, 2017)
The figure 3 explains that the debt level of the company has been improved a bit. The
changes are nominal. And it is required for the business to improve the growth rate in the
debt level to manage the optimal capital structure level of the business.
Cost of equity and total cost of capital:
The cost of equity (CAPM model) of the business describes the 11.42% required rate
of return from the business (Chandra, 2011). It explains that the minimum return from the
stock of the company could be expected 11.42%. The company’s risk level is 1.47 and it is
offering 11.42% return to the shareholders which are appropriate.
Calculation of cost of equity (CAPM)
RF (Risk free rate) 2.41%
RM (Market return) 8.54%
Beta 1.470
⊘ This is a preview!⊘
Do you want full access?
Subscribe today to unlock all pages.
Trusted by 1+ million students worldwide
1 out of 16
Related Documents


Your All-in-One AI-Powered Toolkit for Academic Success.
+13062052269
info@desklib.com
Available 24*7 on WhatsApp / Email
![[object Object]](/_next/static/media/star-bottom.7253800d.svg)
Unlock your academic potential
Copyright © 2020–2026 A2Z Services. All Rights Reserved. Developed and managed by ZUCOL.