Comprehensive Analysis of Traffic Accident Data on A406 Road, UK
VerifiedAdded on 2023/01/07
|66
|11293
|30
Report
AI Summary
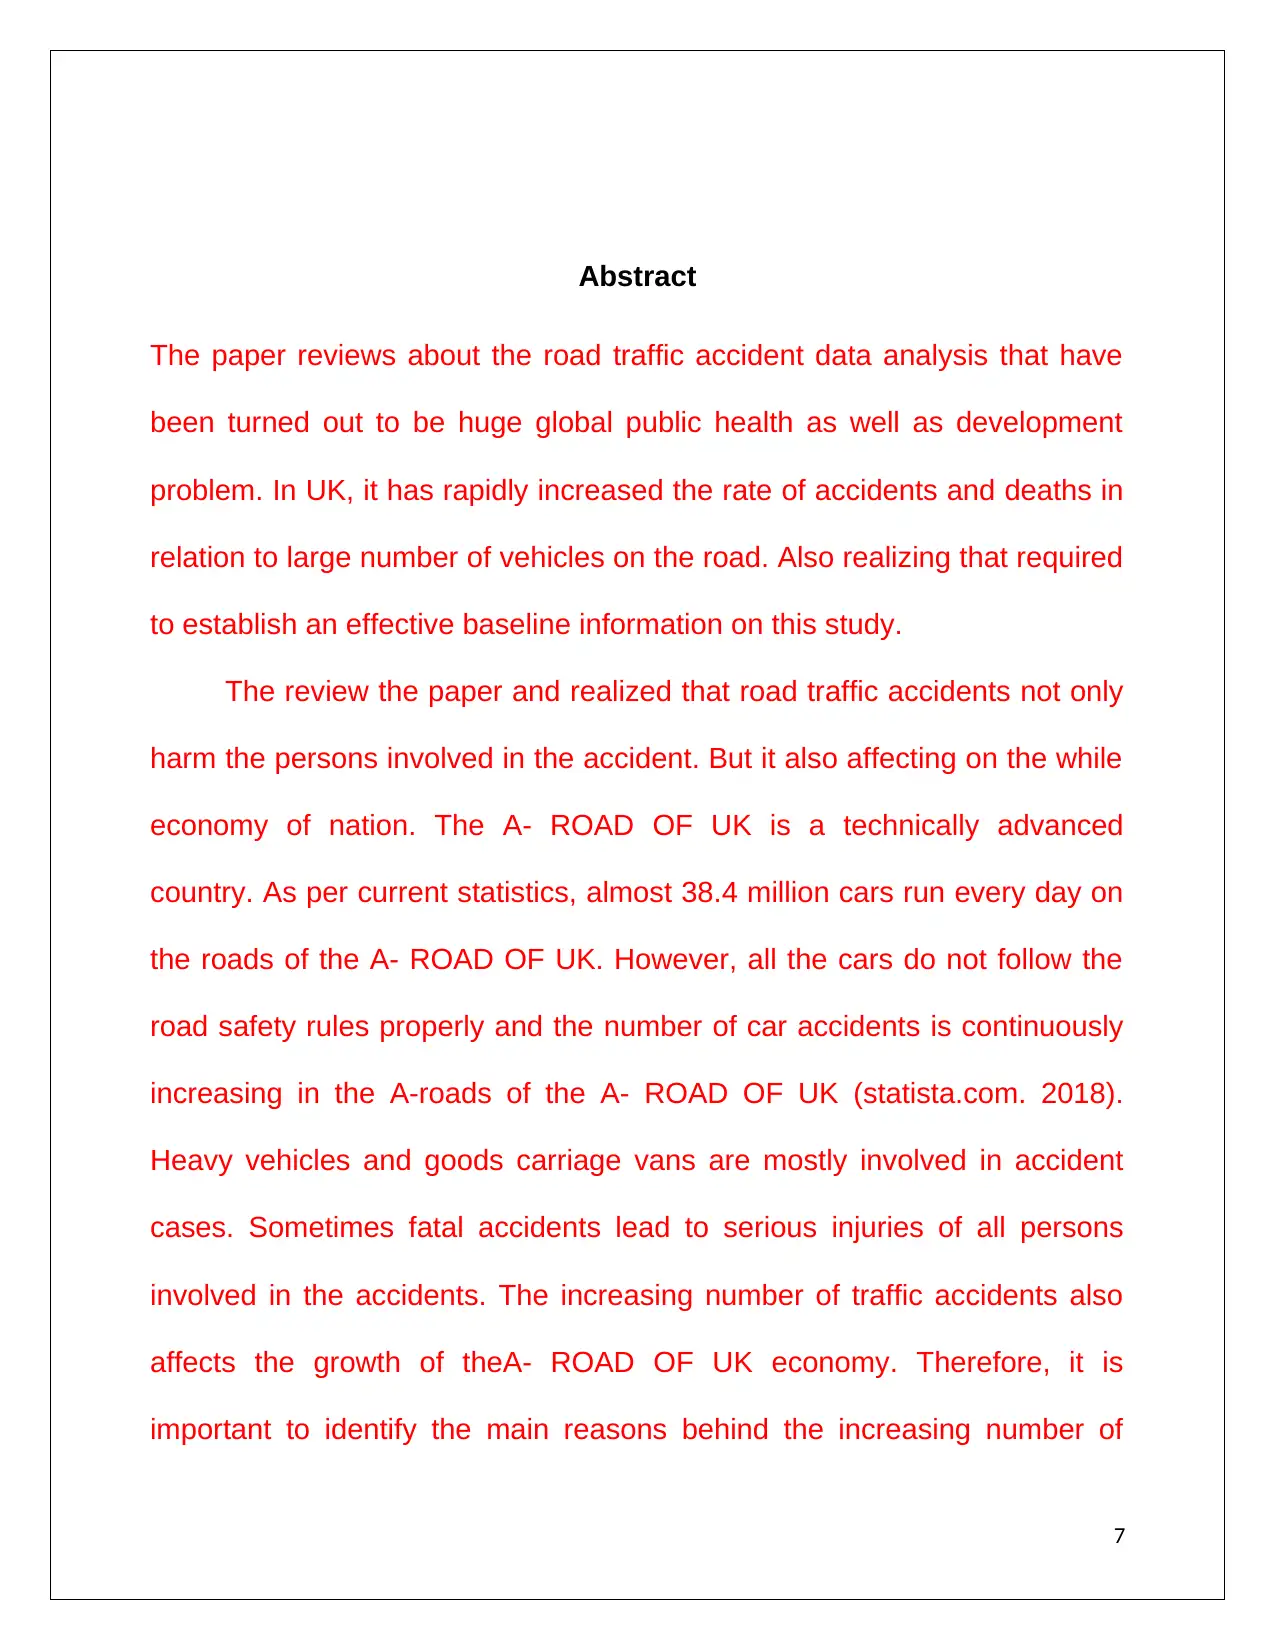
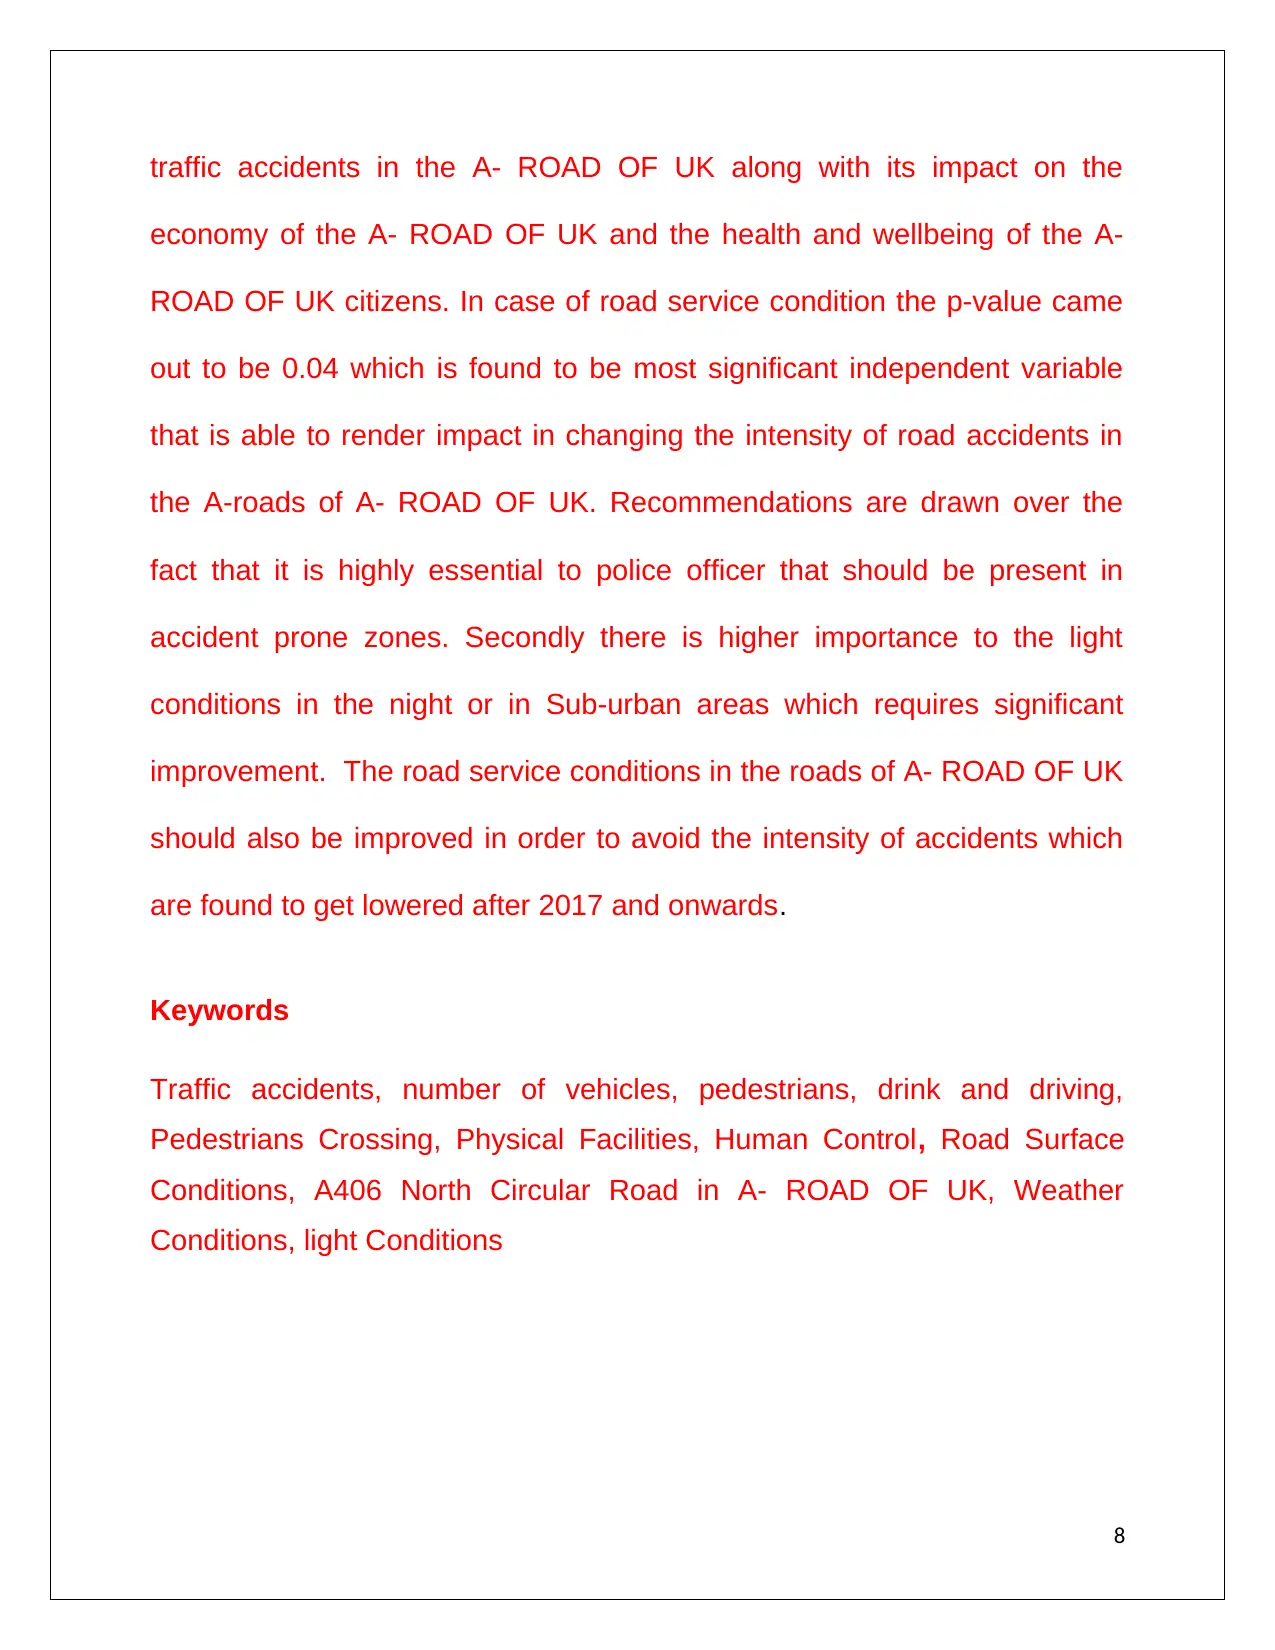
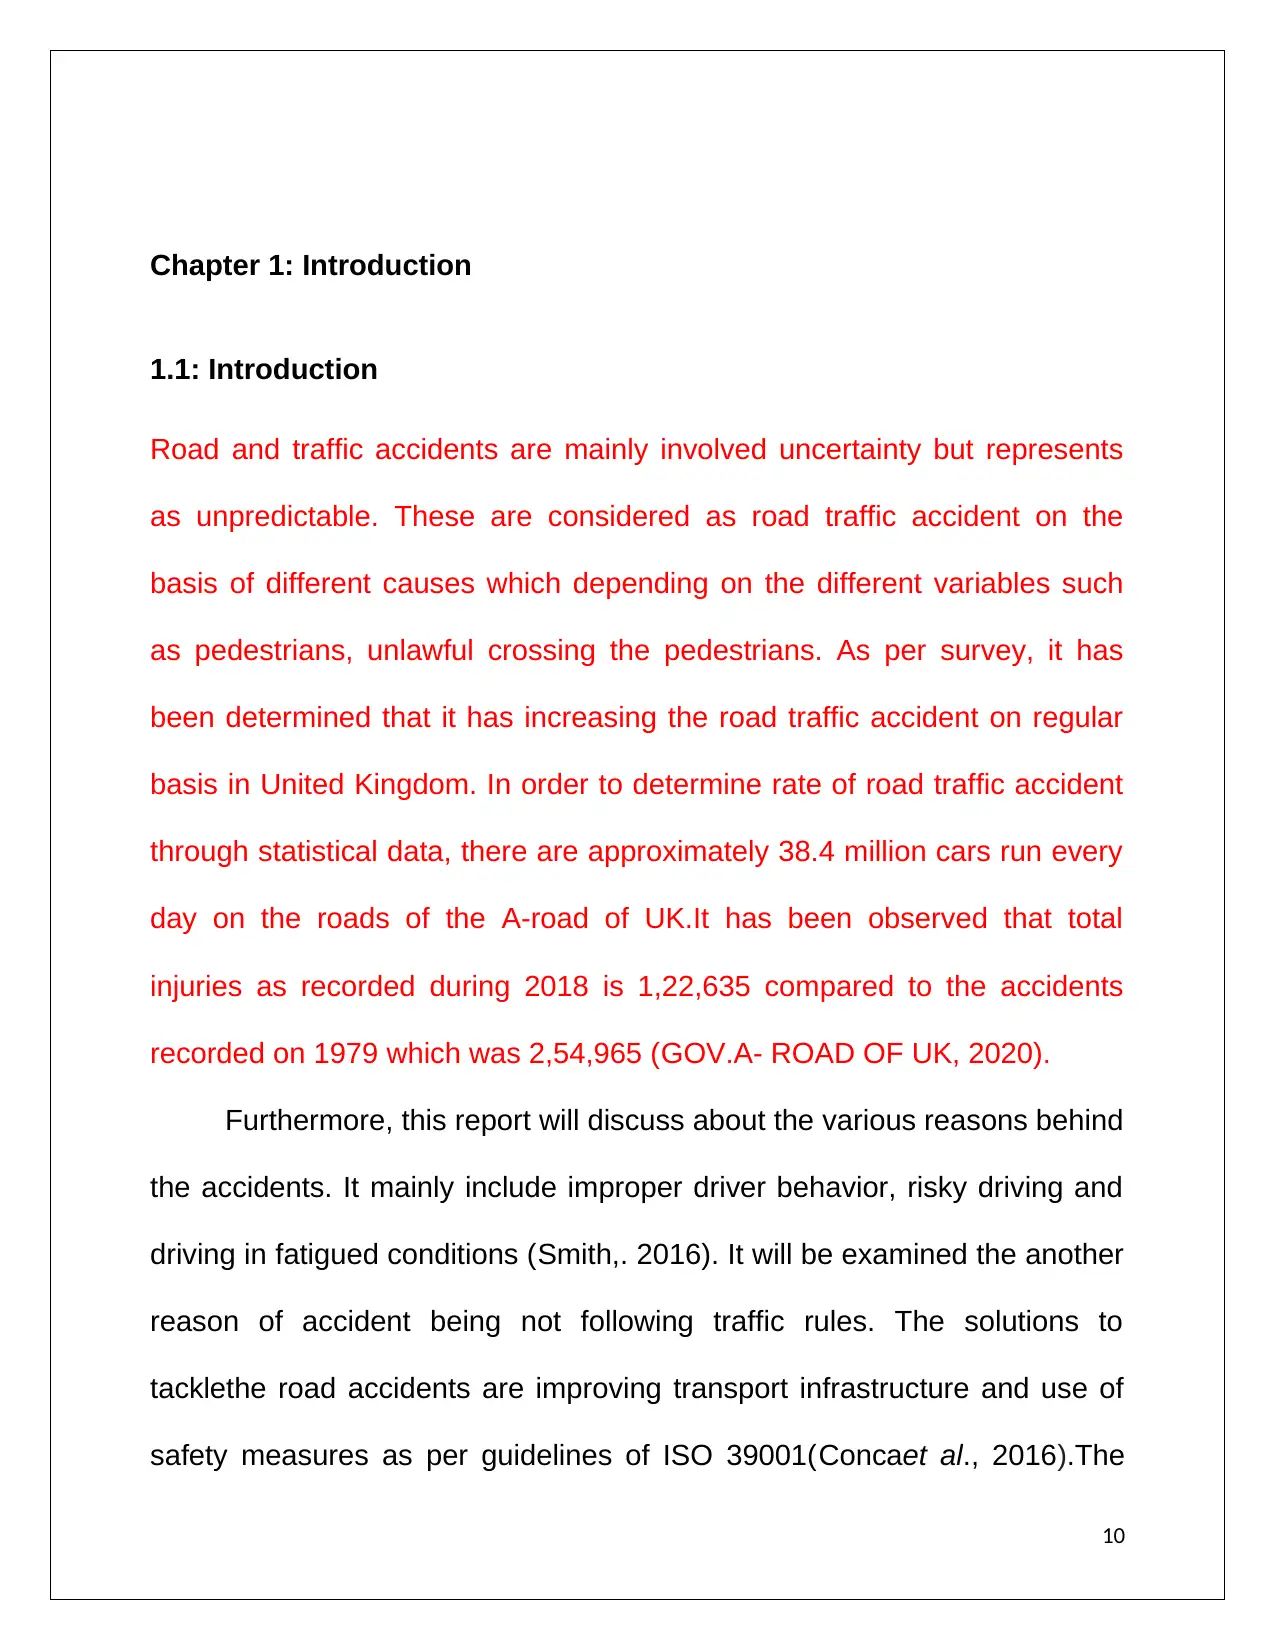
This report presents an in-depth analysis of traffic accident data collected from the A406 North Circular Road in the UK. The study examines various factors contributing to road accidents, including the increasing number of vehicles, road conditions, and pedestrian behavior. The report delves into the statistical data, exploring trends and patterns in accident occurrences. It reviews the literature, assesses quantitative data through statistical analysis, and presents key findings. The study identifies critical factors such as road surface conditions, weather, and light conditions. The report concludes with recommendations for improving road safety, including increased police presence in accident-prone areas and enhanced lighting in hazardous zones. The research also highlights the economic burden of traffic accidents and their impact on the UK's economy and public health.
Contribute Materials
Your contribution can guide someone’s learning journey. Share your
documents today.

ANALYSIS OF TRAFFIC ACCIDENT DATA ON A406 NORTH
CIRCULAR ROAD IN UK
1
CIRCULAR ROAD IN UK
1
Secure Best Marks with AI Grader
Need help grading? Try our AI Grader for instant feedback on your assignments.

Table of Contents
Chapter 1: Introduction.................................................................................6
1.1: Introduction.........................................................................................6
1.2: Background of the study.....................................................................6
1.3: Aims, Objectives and research questions...........................................7
1.4: Rationale of the study.........................................................................8
1.5: Significance of the research...............................................................9
1.6: Structure of the dissertation..............................................................10
1.7: Summary..........................................................................................10
Chapter 2: Literature Review......................................................................11
2.1: Introduction.......................................................................................11
2.2: Analysis of the reasons behind the increasing number of accidents
on A-road in the UK.................................................................................11
3. Methodology...........................................................................................15
4. Background information and data presentation of road accident...........17
5. Quantitative Analysis..............................................................................21
2

6. Findings..................................................................................................28
7. Discussion and Recommendations........................................................29
8. Conclusion..............................................................................................32
9. Reference...............................................................................................33
10. Appendix............................................................................................36
Appendix 1: Analysis of Accidents in the A roads of UK 2009 - 2019.....36
Appendix 2: Accident Severity.................................................................37
Appendix 3: Road Surface Conditions.....................................................38
Appendix 4: Carriageway Hazards..........................................................39
Appendix 5Accidents in Urban or Rural Area..........................................39
Appendix 6: Police Officer Attend Scene of Accident..............................40
Appendix 7: Special Conditions at Site....................................................40
Appendix 8: Weather Conditions.............................................................41
Appendix 9: Light Conditions...................................................................41
Appendix 10:Pedestrians Crossing Human Control................................42
Appendix 11: Pedestrians Crossing Physical Facilities...........................42
Appendix 12: Total Police Force involved in reducing the Accident cases
.................................................................................................................43
3

4
Secure Best Marks with AI Grader
Need help grading? Try our AI Grader for instant feedback on your assignments.

List of Figures
Figure 1.1: Economic burden of traffic accidents in the UK..........................5
Figure 1.2: Structure of the dissertation.......................................................7
Figure 2.2: Number of accidents as per vehicle type...................................9
5
Figure 1.1: Economic burden of traffic accidents in the UK..........................5
Figure 1.2: Structure of the dissertation.......................................................7
Figure 2.2: Number of accidents as per vehicle type...................................9
5

List of tables
Table 2.1: Total number of causalities in the severities of the reported
accident......................................................................................................14
Table 2.2: Fatal accident rate of the UK.....................................................15
Table 2.2: Rate of slightly injured due to accident in the UK......................16
6

Abstract
The paper reviews about the road traffic accident data analysis that have
been turned out to be huge global public health as well as development
problem. In UK, it has rapidly increased the rate of accidents and deaths in
relation to large number of vehicles on the road. Also realizing that required
to establish an effective baseline information on this study.
The review the paper and realized that road traffic accidents not only
harm the persons involved in the accident. But it also affecting on the while
economy of nation. The A- ROAD OF UK is a technically advanced
country. As per current statistics, almost 38.4 million cars run every day on
the roads of the A- ROAD OF UK. However, all the cars do not follow the
road safety rules properly and the number of car accidents is continuously
increasing in the A-roads of the A- ROAD OF UK (statista.com. 2018).
Heavy vehicles and goods carriage vans are mostly involved in accident
cases. Sometimes fatal accidents lead to serious injuries of all persons
involved in the accidents. The increasing number of traffic accidents also
affects the growth of theA- ROAD OF UK economy. Therefore, it is
important to identify the main reasons behind the increasing number of
7
Paraphrase This Document
Need a fresh take? Get an instant paraphrase of this document with our AI Paraphraser

traffic accidents in the A- ROAD OF UK along with its impact on the
economy of the A- ROAD OF UK and the health and wellbeing of the A-
ROAD OF UK citizens. In case of road service condition the p-value came
out to be 0.04 which is found to be most significant independent variable
that is able to render impact in changing the intensity of road accidents in
the A-roads of A- ROAD OF UK. Recommendations are drawn over the
fact that it is highly essential to police officer that should be present in
accident prone zones. Secondly there is higher importance to the light
conditions in the night or in Sub-urban areas which requires significant
improvement. The road service conditions in the roads of A- ROAD OF UK
should also be improved in order to avoid the intensity of accidents which
are found to get lowered after 2017 and onwards.
Keywords
Traffic accidents, number of vehicles, pedestrians, drink and driving,
Pedestrians Crossing, Physical Facilities, Human Control, Road Surface
Conditions, A406 North Circular Road in A- ROAD OF UK, Weather
Conditions, light Conditions
8

9

Chapter 1: Introduction
1.1: Introduction
Road and traffic accidents are mainly involved uncertainty but represents
as unpredictable. These are considered as road traffic accident on the
basis of different causes which depending on the different variables such
as pedestrians, unlawful crossing the pedestrians. As per survey, it has
been determined that it has increasing the road traffic accident on regular
basis in United Kingdom. In order to determine rate of road traffic accident
through statistical data, there are approximately 38.4 million cars run every
day on the roads of the A-road of UK.It has been observed that total
injuries as recorded during 2018 is 1,22,635 compared to the accidents
recorded on 1979 which was 2,54,965 (GOV.A- ROAD OF UK, 2020).
Furthermore, this report will discuss about the various reasons behind
the accidents. It mainly include improper driver behavior, risky driving and
driving in fatigued conditions (Smith,. 2016). It will be examined the another
reason of accident being not following traffic rules. The solutions to
tacklethe road accidents are improving transport infrastructure and use of
safety measures as per guidelines of ISO 39001(Concaet al., 2016).The
10
Secure Best Marks with AI Grader
Need help grading? Try our AI Grader for instant feedback on your assignments.

application of simulation based technology to assess the risk of accident
and takes necessary measures to mitigate the occurrence of accidents
(Waizmanet al., 2015).The increasing number of traffic creating congestion
at A- Road Of UK. It is estimated that the situation will be very challenging
during 2030.To manage the situation and control the traffic congestion
several measures like efficient pricing, smart motorways, improvised bus
services etc. can be applied to solve the problem. Data models based on
the factors like causalities, information about roads, types of vehicles and
license related issues gives the reasons of the upsurge of the traffic at A-
Road in UK.
1.2: Background of the study
The number of traffic accidents is increasing on the roads of the UK along
with the increasing number of motor vehicles. Therefore, Traffic accidents
are not only harmful for people life but also majorly affected the overall
economic growth of UK. As per the current statistics of 2018, almost 1784
people have died on road accidents in the UK and more than 25,511
people have become seriously injured in road accidents (brake.org.uk,
2020). Current statistics say that the cost of road accidents in the UK is
near to £2.2 millionin 2018 (statista.com, 2018). The cost can increase
further and can reach to £26.1 million in the coming years (statista.com,
11

2018). This can be considered as a huge economic burden and the GDP
growth of the UK can be largely affected by it (togetherforsaferroads.org,
2020).
Figure 1.1: Economic burden of traffic accidents in the UK
(Source: statista.com, 2018)
Figure 1.1 shows that the road accidents are gradually decreasing. The
declining of accident rate is observed from 1990 and gradually it has been
decreased significantly.However there are challenges in other aspect. It
has been observed the deaths due accidents are still happening in
significant number. Every year in the A- ROAD OF UK somewhere in the
12

range of 3400 individuals died on the street accidents, of whom 218 are
children. A further 37000 are truly harmed and 272 500 marginally harmed.
Hence conducting research is quite pertinent to analyze and find the cause
of such road accidents
1.3: Aims, Objectives and research questions
Aim
To evaluate the road traffic accidents and injured people in UK.
Objectives
To determine the current rate of road traffic accident in UK
To examine the reason of increasing the road traffic accident in UK.
To evaluate comparison between the statistical data 2015 to 2018 in
context of performance and safety.
To recommend strategies or measures to reduce the road traffic
accident in the United Kingdom.
Research Questions
What is the current rate of traffic accidents on the roads of the UK?
What are the major reasons behind the increase in the number of
traffic accidents on the roads of the UK?
What are the types of injury occur due to accidents?
13
Paraphrase This Document
Need a fresh take? Get an instant paraphrase of this document with our AI Paraphraser

What are the suggestions for reducing the rate of accidents in the
United Kingdom?
1.4: Rationale of the study
From the background of the study, the major focus to delve into the factors
that are increasing the chances of road accidents in A406 North Circular
road of UK. It may happen that the main factors responsible for the
increase in road accidents are the increase in the number of cars, drink
driving, reckless driving, increase in the number of goods carriage vans,
lack of knowledge regarding the road safety rules and many other things
(Rolisonet al. 2018, p.12). Traffic incidents in the UK cause a lot of deaths
and injuries. The economic burden of traffic incidents is also increasing
every year (Wijnen and Stipdonk, 2016, p.98). Therefore, it can be said that
traffic incidents do not only affect the health and well-being of the persons
involved in the accidents but also the economic growth of the UK.
Reduction of GDP growth can harm the overall well-being of the citizens of
the country (Gorea, 2016, p.6494). Therefore, it is important to identify the
factors that lie behind the increase of traffic incidents on the roads of the
UK. Thisresearch evaluates the current data related to road accidents in
14

the UK for identifying the reasons behind the increased number of road
accidents in the UK.
1.5: Significance of the research
The importance of research study is to determine the accurate rate of road
traffic accident in United Kingdom and also identifying the different
factorsresponsible for increasing the accident on regular basis. Moreover, it
can be determined the effectiveness of road safety laws in the country.
Through this study, investigator always tried to evaluate both social
as well as economic impact on the traffic crashes in UK. It is useful for
identifying the entire process and consider alternative method to reduce
the number of traffic crashes on the roads of the UK. This can facilitate the
economic growth of the UK and can control the negative impact of road
accidents on society. Therefore, it can be said that the research is
significant.
15

1.6: Structure of the dissertation
Figure 1.2: Structure of the dissertation
1.7: Summary
The chapter discusses the background of the research work which provides
relevant data regarding the percentage of road accidents in the UK. Road
accidents have also been discussed in the background. The research aims
and objectives have been discussed in this chapter and the research
questions have also been formed. The rationale part of the chapter helps in
analyzing the significance of the research work. Moreover, the detailed
structure of the dissertation has been analyzed in this chapter.
16
Secure Best Marks with AI Grader
Need help grading? Try our AI Grader for instant feedback on your assignments.

Chapter 2: Literature Review
2.1: Introduction
The research papers that are reviewed and critically analyzed in this
chapter have also helped in collecting relevant secondary data for the
research work.
2.1 Current rate of road traffic accident in UK
As stated by (Gorea, 2016, p.6494). there is high rise in number of
accidents in UK. It is found that there were total 160,597 causualities
reported in 2018 in UK. But it is less than 6% as compared to 2017.
Besides that it is found that rate of fatalities per billion has reduced to 1%
from 5.43 to 5.38 in 2018. However, there were 25511 serious injury
reported in road traffic accident in UK. Moreover, total 1784 people killed
in 2018 due to accident since 2012 . however death was less than 1% as
compared to 2017.
2.2: Analysis of the reasons behind the increasing number of
accidents on A-road in the UK
According to Nævestadet al. (2015, p.96) road accidents is rising in
UK as people are not able to drive safely on road. Also, it is found that
17

there are many reason due to which these accidents are occurring. So for
that both government as well as individuals are responsible for it. this is
because the government is not taking effective measure and action to
reduce accidents and also individuals are not responsible enough as well
for it. so, there are various reason for accidents which has been evaluated
as below
2.2.1Increased number of vehicles and pedestrians
The high population growth rate of the UK has caused an increase in the
number of vehicles and pedestrians on the roads of the UK
(seriousinjurylaw.co.uk, 2020). As a result of it, the roads are becoming
over congested which is the main reason behind the increased number of
traffic crashes on the roads of the UK. As per the point of view of Rolisonet
al. (2018, p.12), the drivers of large vehicles often do not follow the traffic
rules properly in the busy roads and because of this, the number of fatal
accidents on the roads of the UK has increased considerably. In many
cases, the pedestrians also do not follow the road safety rules properly
which can cause major accidents.
2.2.2 Drink driving
18

Though the drink driving laws are very strict in the UK, studies have
revealed that a large number of drivers on the roads of the UK continue to
drink drive. As mentioned by Smith (2016, p.6), drink driving is a major
factor working behind the increase of road accidents on the highways of the
UK. As per the statistics of 2017, it has been shown that almost 14% of the
reported road accidents are caused by the faults of drunk drivers
(racfoundation.org, 2017). Notably, majority of the vehicles involved
areToyota Prius with 111 accidents per 10000 cars while Citroen Saxo with
106 and BMW 330D with 102 accidents per 10000 cars respectively.
2.2.3 Reckless driving
Researchers like Nævestadet al. (2015, p.96), think that reckless driving is
one of the major causes of the increasing number of road accidents in the
UK. Many of the drivers do not follow the speed limit specified for driving on
busy roads. Especially, the drivers of vans andgoods carriage vehicles
drive recklessly during night hours and as a result of it, they often lose their
control of their vehicles which leads to traffic crashes.
2.2.4 Casualty of drivers
In this context, it is possible to explain that carelessness of drivers is one of
the major reasons for the road accidents. It has been found that the
19
Paraphrase This Document
Need a fresh take? Get an instant paraphrase of this document with our AI Paraphraser

casualty of drivers causes accidents on the A406 North Circular road in UK.
In this aspect, it can be stated by Localeet al. (2017, p. 241) that the
carelessness of driver sometimes causes distraction while driving on the
roads. As for this reason, the speed limit cannot be well contoured by the
driver during the car driving in the road. It causes a traffic accident in the
country. Moreover, it is needed to drive carefully on the road for preventing
an accident.
2.2.5 Pedestrian locality
Due to the location of the pedestrian, drivers cannot control the speed of
the car which causes an accident. In this situation, it has been identified
that the inattentiveness of drivers during cardriving causes a pedestrian
accident. It has been found that the rate of pedestrian accidents is
gradually increasing. For this reason, it is necessary to consider the
location of a pedestrian while driving the car. In this regard, it is also
required to take into account the driving speed so that a pedestrian
accident can be prevented in an effective note (Cartwrightet al. 2018, p.
303).
20

Figure 2.3: Causes of traffic accident
(Source: Liu et al. 2018, p. 245)
2.2.6 Pedestrian movement
By considering the road safety strategy, pedestrian movement while
crossing the road needs to be taken into account for understanding the
causes of the accident. A road safety strategy in the country is made to
prevent the rate of road accidents. In this aspect, it has been found from
the study of Smith (2016, p. 245) that pedestrian movement without
considering the road safety strategy can cause accidents. In this regard, if
possible the driver needs to control the speed of the car on the road.
2.2.7 Failure to Use Safety Equipment
21

It has been identified that drivers sometimes avoid safety gear while driving
on the road. In this context, it can be possible to clarify from the opinion of
Harris et al. (2018, p. 140) that traffic accidents can happen due to
avoidable safety gear like seat belts and helmets. It is because wearing a
helmet or seat belt cans double the chances of surviving in the case of
serious accidents. In this regard, it is required to prevent deaths from
accidents by considering the use of safety equipment like helmets and seat
belts. It helps to keep people safe as well as intact in the case of a traffic
accident.
Conditions of light
On the roads, the light condition is one of the major aspects in causing an
accident. It has been detected from the study of Morgan et al. (2016, p.
103) that the condition of light on the road can cause traffic accidents. On
the other hand, drivers sometimes cross the vehicles by not considering
red light in a traffic signal. It also causes a traffic accident on the road.
From the above discussion, it can be possible to state that the reasons
behind the traffic accident need to be considered in order to prevent traffic
accidents in the country.
22
Secure Best Marks with AI Grader
Need help grading? Try our AI Grader for instant feedback on your assignments.

2.3 Comparison between the statistical data 2015 to 2018
According to study done by (Data.gov.uk. 2020) it is found that in
2018 there were 1839 road fatalities in UK as compared to 1856 in 2017.
Moreover, there were 25511 serious injury in 2018 in road accidents and
in 2016 it was 24101 in 2017 it was 24831 and in 2015 it was 22144. .
Besides that in 2018 there were 133302 slight injuries in 2018 which is
less than 2015.
23

So, it is stated that there is decline in injuries in 2018 as compared
to 2017. It is shown that 6% decrease in all casualties, 8 % in slightly
injured.
2.4 strategies or measures to reduce the road traffic accident
As said by Rolisonet al. 2018, p.12) there are several measures that
can be taken in order to reduce traffic accidents. This is necessary to take
so that people death can be reduced. So, the strategies taken are
signs boards- the UL government should post signs boards on both
sides of roads so that people can follow it while driving. These boards will
give them notification or make them aware. Through that it will be easy to
drive slowly and safely.
24

Rules and regulations- the government should form strict rules and
regulation in driving. They must impose huge fines or cancel license of
people who met with accident. This will help in reducing accidents.
Providing training- here, training can be provided to drivers that how to
drive safely and carefully on road. Also, in that they can be trained how to
follow rules and regulations during driving.
Summary of the chapter: It has been analyzed that there are various
mistakes which has been made by drivers while driving and these mistakes
needs to be reduced so that number of road accidents can be reduced
down. In this regard, it is required to prevent deaths from accidents by
considering the use of safety equipment like helmets and seat belts. It
helps to keep people safe as well as intact in the case of a traffic accident.
3. Methodology
There are various methods which are taken into research. this
enable scholar to proceed in effective way and provide insight that what
method are to be used. The use of method depends on nature and type
of research. so, it is defined as
Research design –
25
Paraphrase This Document
Need a fresh take? Get an instant paraphrase of this document with our AI Paraphraser

It is main element in research as it is used in integrating elements in order
to answer research questions. This enables in specifying that what data is
to be gathered and how each element will be answered in it. so, with that
element is integrated. Research Design can be descriptive Research
Design, co relational Research Design review best meta-analytic result
design, experimental Research Design, etc. But under consideration the
present it is essential to descriptive Research Design which is based upon
naturalistic observations. Descriptive Research Design is described as a d
such method that illustrates upon the population of phenomenon that is
taken under consideration for study. This methodology basically focuses
upon teacher subject rather than the significance of undertaking the
research subject. It describes the nature of the research from a
demographic perspective and focus is upon choosing the analytical base
with observational research philosophy. It is helpful in cross sectional
studies when data of variables are collected single point of time across the
same population sample of predefined set of data. The same is helpful for
uncontrolled variables where observational methods are utilized for
conducting the research best and the behavior of the variables the
research. For this reasons descriptive Research Design is best suited for
the present research since it is helpful in trend analysis and collecting
26

quantifiable information that is tested over a relevant population sample. It
is also an effective instrument for market research and quantitative
analysis.
Research philosophy
It can be defined as belief that describes about the way how data needs to
be gathered analyzed and used. Research philosophies generally are of
four types which are realism, interpretivism, positivism and pragmatism.
The research philosophy basically provides the fundamental belief upon the
data that are collected to analyze the phenomenon taken under
consideration for the research. Research philosophy basically provides the
analysis of the gap that exists between what is known to be true and what
is believed to be true. Based upon this is appropriate wheelers research
fields of is undertaken to conduct the research in order to achieve the
outcome as per the research objective. The interpretivism provides in-depth
analysis over small samples and investigations are generally made over
qualitative data. Pragmatism on the other hand the mixed of multiple
samples and multiple method designs and both quantitative and qualitative
data are utilized for conducting the research. so, in present study
positivism philosophy will be used. This is because it adheres to the fact
that, only factual evidence should be considered trustworthy and this is
27

required in the current research where the limitation of the research is upon
the data obtained and interpreted over the research issue under
consideration.
Research type-
There are basically two type of research one is quantitative and other one
is qualitative. In the qualitative research, the data is collected is based on
theoretical aspects. No numerical facts and figures is been used while
collecting this type of data. It can assist researcher in getting to the end
results. The other type of research is quantitative; this includes numerical
facts and figures. Various type of methods can be used in order to analyse
the results of quantitative data. In this type of method, relevant and reliable
information can be collected. The research methods can be conducted by
utilizing quantitative surveys that are generally based upon relevant
questionnaires, delving into qualitative case studies, conducting qualitative
research interviews, focus group discussions, experiments, archival study
or secondary data analysis, etc. and certain mixed methods as a
combination of some of the above. In the present context quantitative
analysis of data through secondary data analysis is been conducted by
utilizing data from credible data sources.
Research approach-
28
Secure Best Marks with AI Grader
Need help grading? Try our AI Grader for instant feedback on your assignments.

it provide a framework of how study is to be done, data is gathered
and analysed. Through that it becomes easy to collect data in specific way
and analyse it. besides that research approach provide framework of how
data will be collected, interpreted to obtain relevant outcomes. In general
there are three research approaches which are deductive, Inductive and
abductive. In deductive research approach certain hypothesis are
formulated for study and it is again re-tested based upon observations and
other important tools of research to confirm the theoretical plinth and either
reject or accept the hypothesis based upon which obtained results are
interpretation of the findings are accomplished. In case of inductive
research approach observations are tested and the patterns of identifier
followed by which it is matched with the theoretical underpinning facts any
discrepancy found in the results are interpreted from scientific perspectives.
In the present research deductive research approach is being utilized to
optimize the research results so that it can remain in accordance with the
research objectives based upon which the research questions are framed
and hypothesis are being tested to understand the relationship between
predictor variables and response variables.
Data collection
29

Data collection is process of gathering of relevant and precise data
from authentic sources. This is significant element in research as entire
outcomes are based on it.. however, there are two methods in it that is
primary and secondary. In primary fresh data is gathered through several
ways such as survey, questionnaire, etc. in secondary data is collected
from previous articles, journals, etc. therefore, in present study both
primary and secondary data methods are used. It will enable in gathering
effective and precise data from reliable sources..
Data analysis-
this is important element in research as overall outcomes are
dependent on it. data analysis is process of interpreting and processing
of data to obtain relevant and precise outcomes. The data needs to be
analysed in effective way so that precise and accurate results are
generated. The use of data analysis technique depends on nature and
type of research and data gathered. Also, scholar must have knowledge
about those techniques and how to use it. basically, thematic and
statistical data analysis are techniques in it. therefore, in present research
SPSS data analysis will be used. Here, data is interpreted by applying
various test in it.
30

4. Background information and data presentation of road accident
As per identified the background information or data about the road traffic
accidents in UK. It is the most common issue or problem that mainly faced
by large number of population. General issues such as drink and drive,
rough driving. In additional, some peoples are not following the proper road
traffic regulation so that it has increased the situation of road accident.
On the other hand, it can be possible to explain that road accidents in
the United Kingdom occur due to carelessness of good vehicles drivers.
Hence, there is high chances of getting a victim of accident without doing
anything mistake by own. This type of situation happen due to traffic rule
and regulation those individual people not aware about it. Another aspects,
it is possible to say that 12 percent of fatal accidents happen due to the
careless driving of goods vehicles in a country like the United Kingdom.
Around 42,189 accidents have been reported in the United Kingdom which
occurs due to the failure of drivers (bettertransport.org.uk, 2020).
Moreover, it can be possible to explain that in the year 2015, the
number of accidents because of goods vehicles is 186,209. In this regard, it
has been found in the year 2014; the number has been higher than in
2015. In 2014, the number of causalities is 194,477.
31
Paraphrase This Document
Need a fresh take? Get an instant paraphrase of this document with our AI Paraphraser

As per evidence, it has found that 18766 causalities occurred in 2016
in UK due to road and traffic accidents so that it has been increased rate of
traffic road accident from 2015 to 2016. In 2017, there are approximately
170,993casualties’rate identified due to road traffic accident. Now
continuously, it has been increasing on regular basis between 2017 to 201.
Moreover, in 2018, the rateof causality is 160,597. It can be presented by
using a graph.
Year 2014 2015 2016 2017 2018
Casualties 194,477 186,209 187661 170,993 160,597
Table 4.1: Total number of causalities in the severities of the reported
accident
(Source: assets.publishing.service.gov.uk, 2020)
Figure 4.1: Total number of causalities in the severities of the
reported accident
32

(Source: assets.publishing.service.gov.uk, 2020)
From above table, it has been identified the maximum road traffic accident
and also considered the causalities. It can be identified that rate of
severities of the reported must describe majorfluctuation from year 2014 to
2018.
In this way, it can be easily calculated on annually basis. Moreover,
the rate of accidents has been reduced in the year 2018 from 2016 and
2017. It can be stated that the accident rate has been higher in 2014.
4.1 Causes of vehicle accidents
In this aspect, it has been found that the causes of vehicles accidents can
be analyzed that drive does not followed the proper road traffic rules and
regulations.
In this way, it has found that there are several accidents occur due to
casualties of a driver, light condition, and so on.
The fatal accident rate of theUK is given below:
Year 2014 2015 2016 2017 2018
Number
of fatal
accident
1742 1770 1799 1718 1770
Table 4.3: Fatal accident rate of the UK
(Source: assets.publishing.service.gov.uk, 2020)
33

Table 4.4: Fatal accident rate of the UK
(Source: assets.publishing.service.gov.uk, 2020)
Year
2014 2015 2016 2017 2018
Number
of
slightly
injured
145,213 147,521 149,816 138,490 137,451
From above chart, it has been represented the fatal accident rate in UK. In
every years, it has been increasing because drive not aware about the
regulation that directly affect in term of safety and performance.
It can be possible to explain that the rate of fatal accidents has been
increased in the year 2015 from 2014. Moreover, the rate of deaths has
been enhanced in the year 2016. On the other hand, in 2017, the rate of
fatal accidents is 1718. Furthermore, in the year 2018, the rate is 1770.
34
Secure Best Marks with AI Grader
Need help grading? Try our AI Grader for instant feedback on your assignments.

Table 4.5: Rate of slightly injured due to the accident in the UK
(Source: assets.publishing.service.gov.uk, 2020)
Table 4.6: Rate of slightly injured due to the accident in the UK
(Source: assets.publishing.service.gov.uk, 2020)
From above analysis, it has been identified the rate of injured people due to
road traffic accident. It is possible to describe that rate from 2014 to 2018.
Initially, It has found 145, 213 in 2014 and 137,457in 2018. This is useful
for estimating the accurate result or outcome.
5.Quantitative Analysis
Quantitative analysis is being conducted based upon the data presented
above in order to understand the existing relationship between different
35
(Source: assets.publishing.service.gov.uk, 2020)
Table 4.6: Rate of slightly injured due to the accident in the UK
(Source: assets.publishing.service.gov.uk, 2020)
From above analysis, it has been identified the rate of injured people due to
road traffic accident. It is possible to describe that rate from 2014 to 2018.
Initially, It has found 145, 213 in 2014 and 137,457in 2018. This is useful
for estimating the accurate result or outcome.
5.Quantitative Analysis
Quantitative analysis is being conducted based upon the data presented
above in order to understand the existing relationship between different
35

attributes those of which contribute in the traffic accidents in the A-road of
United Kingdom. Based upon the literature review it has been found that
the response variable or dependent variable which in the present case is
the road accidents in the A – roads of UK, has been impacted by different
independent variables or explanatory variables. Hence, regression analysis
is conducted with the help of the 11 years data obtained from “Road Safety
Data - data.gov.uk, 2020”to understand the extent of impact rendered by
the predictor variables upon that of the dependent variables. It will help not
only to identify the most influential factors that are responsible for bringing
variation in the dependent variables but also will pioneer ways to resolve
them. The conduction of the research is incorporated based upon the
literature review that is obtained from credible sources of journal, articles,
etc. and based upon that the data are processed in the form of information
that can be trusted for engaging into deeper researcher with authenticity.
The methodology of the research is kept pretty clear and the data analysis
is conducted with suitable statistical analysis followed by data presentation
as accomplished in the above sections. Based upon the literature gap it is
important to conduct a quantitative analysis to understand the independent
variables that are rendering the high impact upon the increase in the road
accidents in the A406 North circular road of UK – roads in UK. The
36

justification of the current study thus lies in identifying those factors that are
responsible for increase in the number of road accidents in the A - roads of
UK as well as are the major cause in increase the chances of accidents. It
is highly important to understand those factors since it will help in reducing
the number of road accidents in the A - roads of UK. So, own statistical
analysis is conducted as it is highly beneficial based upon the data
obtained on road accidents in UK (Data.gov.uk. 2020). It is to be noted that
casualty and road accidents are different but here it is only used similar to
road accidents to maintain simplicity in understanding (Road Safety Data -
data.gov.uk, 2020).
Regression analysis
Regression analysis is considered as the best statistical technique on this
regard since it will help to assess the relationship between the dependent
and independent variables by the level of significance within 95 % level of
confidence interval. It will help to statistically assess the significance level
and provide a credible understanding regarding the independent variables
and their impacts over the response variables that is chosen in the
prevailing context. From the presentation of data obtained from the
secondary sources pound 11 years train records accident severity of orchid
by the year 2009. In between 2009 to 2019 the road surfacecondition has
37
Paraphrase This Document
Need a fresh take? Get an instant paraphrase of this document with our AI Paraphraser

declined over time that is the sharp decline after 2018 (Appendix 2). From
the year 2009 to 2014 it has been observed that in the first 5 years of the
last decade, majority of the accidents in the A-roads of UK occur due to
carriageway hazards. After 2015 the carriageway hazards have declined
significantly but the sum of accidents reveals that accidents are taking
place in the rural areas urban areas. The attendance of the police officer in
the scene of accident has declined over time. Calculations on the data of
the past 11 years from 2009 to 2019 reviews that weather condition is
another problem in increasing the number of accidents in the roads of UK
(Road Safety Data - data.gov.uk. 2020). The conditions of weather have
declined over time with too much variety of changes in frequent climate
fluctuations throughout the year. The condition of light in the sub-urban
parts has declined significantly with narrow changes as observed from
2017 onwards (Appendix 3). Moreover, it has also been observed that
there is decline in physical facilities for the pedestal that is crossing the
road and the involvement of police forces in reducing accident cases. All of
these factors that came out on the literature analysis and the data
presentation from tradable resources require a proper analysis over
accident seniority in order to determine those factors which are impacting
significantly over the response variable and causing a rise in the chances
38

or intensity of accidents in the A-roads of UK. After reviewing the literature
and assessing the presented data gathered data from credible resources it
is important to consider the following response variable active variables
conduct an analysis which will help to determine the potential of the
explanatory variables to estimate the variation within the dependent
variable. Based upon which the null hypothesis should be accepted and
alternative hypothesis should be rejected or vice versa(Road Safety Data -
data.gov.uk. 2020).
Hence, the dependent variable or response variable is
Accidents in the Roads of UK
The predictor variables or the explanatory variables for the regression
analysis are:
Police Officer Attend Scene of Accident
Pedestrians Movement
Road Surface Conditions
Weather Conditions
Light Conditions
It is clearly stated that regression analysis is accompli9shed upon the
considered variables that are obtained from the presented data from Road
Safety Data - data.gov.uk. 2020. Further the analysis is conducted to
39

understand the factors that5 are reason behind the road accidents in the
A406 north circular roads in UK. Regression analysis is conducted in order
to understand the impact of the independent variables upon the dependent
variables and the chosen independent and dependent variables are
mentioned above which are derived from the data presentation and from
the literature review.
Table 1: Regression Analysis
SUMM
ARY
OUTP
UT
Regre
ssion
Statisti
cs
Multipl
e R
0.985
42560
8
R 0.971 Strong
40
Secure Best Marks with AI Grader
Need help grading? Try our AI Grader for instant feedback on your assignments.

Squar
e
06362
9
uphill
positiv
e
relatio
n
Adjust
ed R
Squar
e
0.959
48908
1
Stand
ard
Error
72.48
82786
7
Obser
vation
s
11
ANOV
A
df SS MS F Signifi
cance
41
e
06362
9
uphill
positiv
e
relatio
n
Adjust
ed R
Squar
e
0.959
48908
1
Stand
ard
Error
72.48
82786
7
Obser
vation
s
11
ANOV
A
df SS MS F Signifi
cance
41

F
Regre
ssion
3
17633
52.74
44083
8.185
83.89
64591
2
1.88E-
09
Resid
ual 7
52545
.5054
5
5254.
55054
5
Total 10
18158
98.24
5
Coeffi
cients
Stand
ard
Error
t Stat
P-
value
Lower
95%
Upper
95%
Lowe
r
95.0
%
Upp
er
95.0
%
Interce
pt
-
22.78
77485
187.6
91004
1
-
0.121
41098
0.905
77054
7
-
440.98
9367
395.41
38699
-
440.
9894
395.
4139
Police
Officer
22.10
32284
6.623
48877
3.337
09759
0.007
52724
7.3451 36.861 7.34
5175
36.8
42

s
Prese
nce at
Scene
of
Accide
nt
6 9 3 3 75778 28115 8 6128
Pedes
trian
Crossi
ng
Physic
al
Faciliti
es
6.008
57335
3
1.795
35882
2
3.346
72561
2
0.007
40608
2
2.0082
64608
10.008
8821
2.00
8264
6
10.0
0888
Weath
er
Condit
ions
0.189
77696
2
0.099
35273
4
4.910
13326
4
0.051
86132
3
-
0.0315
94725
0.4111
48649
-
0.03
1595
0.41
1149
Light - 2.391 - 0.010 - - - -
43
Paraphrase This Document
Need a fresh take? Get an instant paraphrase of this document with our AI Paraphraser

Condit
ions
7.473
43549
32072
9
3.125
23343
77755
3
12.801
63011
2.1452
40865
12.8
0163
2.14
5241
Carria
geway
Hazar
ds
0.327
04215
3
0.103
32268
8
3.165
25014
8
0.020
94931
2
0.1218
63777
0.5322
20529
0.12
1863
8
0.53
2221
Road
Surfac
e
Condit
ions
-
0.318
63155
0.108
08969
4
-
2.947
84393
0.004
04560
2
-
0.5332
76255
-
0.1039
86843
-
0.53
3276
-
0.10
3987
Summary of the chapter
From the summary output the regression analysis effectively treated
depending upon the values that it has provided with statistical significance.
The multiple R value provides the existing level of correlation between the
independent variable and dependent variables which is found to be almost
98.54%. This is quite a strong relationship between both the response
variable and predictor variables. Multiple R value is utilized to understand
the strength of relationship which in the present case is found to be close to
1 and hence it is quite good.The R squared value is equals to 0.9710 which
44
ions
7.473
43549
32072
9
3.125
23343
77755
3
12.801
63011
2.1452
40865
12.8
0163
2.14
5241
Carria
geway
Hazar
ds
0.327
04215
3
0.103
32268
8
3.165
25014
8
0.020
94931
2
0.1218
63777
0.5322
20529
0.12
1863
8
0.53
2221
Road
Surfac
e
Condit
ions
-
0.318
63155
0.108
08969
4
-
2.947
84393
0.004
04560
2
-
0.5332
76255
-
0.1039
86843
-
0.53
3276
-
0.10
3987
Summary of the chapter
From the summary output the regression analysis effectively treated
depending upon the values that it has provided with statistical significance.
The multiple R value provides the existing level of correlation between the
independent variable and dependent variables which is found to be almost
98.54%. This is quite a strong relationship between both the response
variable and predictor variables. Multiple R value is utilized to understand
the strength of relationship which in the present case is found to be close to
1 and hence it is quite good.The R squared value is equals to 0.9710 which
44

incorporates the fact that the variation within the response variable can be
predicted accuracy of 97.10% by the independent variables chosen for the
research. The adjusted R square is found to be 0.9594 which is 95.94 %
and this value came out based upon the number of independent variables
chosen and the sample size. It has been found that if more amount of
independent variables are used in that just ask where will reveal that the
model will have to pay penalty on the sample size is increased then the
result will be more accurate. Hence, the adjusted R square is a most e
instrument to understand the quality of the regression results. Significant P
value of test statistics is found to be below 0.05 and hence the model is
significant in analyzing the impact of over the number of accidents that
taking place in the A-roads of United Kingdom. In case of the police officers
that are present at the scene of accident it has been found that the
coefficient is positive while in case of pedestrians crossings with physical
facilities it is also positive but with a lower magnitude. the weather
condition have a close to zero official value while the carriageway hazards
as a positive Coefficient value and light conditions and Road surface
condition have negative Coefficient value. The T - statistics in case of
police officers those of which are present at scene of accidents is found to
be 3.33 which is beyond the critical region of - 2.228 and + 2.228. The t
45

statistic value reveals that the considered independent variable is able to
measure the variation with accuracy within the independent variable.
Similarly the t competition coaching that have physical facilities have value
of 3.34 which is critical region of - 2.228 to that of + 2.228. It is quite
significant and reflects the fact that the value is quite good and it is
responsible for the increase of this variation in the response variable. In
case of carriageway hazard, the tested value is found to be critical region of
- 2.228 that of + 2.228 since its value is 3.16 which is quite decent and it
signifies the fact that the variable can be tested for the analysis. The t-stat
value in case of road surface condition and that of the light condition is
found to be negative their t statistic value is beyond the critical region of -
2.228 to that of + 2.228 and hence the can be tested for the obtainment of
the results. Finally the people of statistics are measured in case of all the
variables and it has been found to be most significant in case of police
officers that are present in the scene of accident and the people is came
out to be 0.0075 which is much lower than that of 0.05. This incorporate the
fact that at 5% level of significance and 95% confidence interval level the
variable is significant enough in making a change within the accidents that
are taking place in the A-roads of United Kingdom. Moreover, pedestrian
crossing that has physical facilities significance in this value is 0.0074
46
Secure Best Marks with AI Grader
Need help grading? Try our AI Grader for instant feedback on your assignments.

which is much lower than that of 0.05. In both of these cases both the
variables are found to render significant impact upon the response variable.
6. Findings
Findings from quantitative analysis
As per quantitative analysis, it has obtained data or information which
are relevant to the rate of road traffic accident in UK. It can be used the
appropriate website from gathering lot of information or data in proper
manner.
As per analysis, it has been representing the possible result or
outcome to rate of road traffic accident. Furthermore, it has found that
majorly accidental causes identified from 2014 from 2017 years.
Moreover, the rate of deaths has been enhanced in the year 2016.
On the other hand, in 2017, the rate of fatal accidents is 1718.
Furthermore, in the year 2018, the rate is 1770. In this way, it can be
representing the graphic data or information within systematic manner.
initially, it also understand the actual State of the Road conditions and the
necessary after that should be priority to reduce the chances of accidents
in the roads of UK.
From the analysis it has been found that crossing areas where there
is presence of physical facilities for pedestrians have lesser chances for
47

accidents. By using regression analysis, it is found to be having a value
less than 0.05 at 95% confidence interval and 5% level of significance.
Regression analyses are conducted in order to understand the factors that
are impacting significantly over chances of road accidents in United
Kingdom. This provides information to be which will frequently provide safe
environment for transportation in the roads of United Kingdom. Considering
the road accidents as the dependent variable, pedestrian crossing physical
facilities, weather conditions, light conditions, carriageway hazards, road
surface conditions, presence of police officers scene of accidents, etc are
considered as predictor variables based upon the literature review as well
as analysis of the data presentations. The data clearly revealed that these
are the major factors that are increasing the number of cases of accidents
in the A406 North circular road of UK which is one of the most congested
roads. Due to this reason regression analysis is being conducted over the
data to understand the trend as well as speech about the actual factor that
are creating the chances of accidents numbers in the roads of UK. It has
been found that the p- value of “Police officers presence at areas of
accident" is below 0.05. Moreover, medical assistance or physical facilities
in pedestrian crossing along with weather conditions and Road surface
conditions. Weather condition has a P value of 0.0518 which is above 0.05
48

but below 0.06. This signifies the fact weather condition is weakly
significant in impacting over enhancing the chances of accidents. Apart
from this factor all the other predicted variables are highly significant in
enhancing the tendencies of accidents in the roads of UK.
7. Discussion
Discussion is based on the road traffic accidents that mainly occurred in UK
among adults or older people. Through this study, it has revealed that
vulnerable road users which include motor cyclists, pedestrians. It account
for much greater proportion of road traffic and also identified the major
injuries causes both economical, emotional as well as physical harm. It is
an essential to identify the cost/price of road traffic injuries to community or
society.
Furthermore, Recommendation should be given over this fact that
physical facilities should be improved in the pedestrian crossing areas in
A406 North circular road of UK as well as improving the presence of police
officers in the areas where there is high chances of accidents should be
second layer of effectively. The light conditions and Road surface condition
should also be improved in order to avoid carriageway hazards it will listen
the chances of accidents when weather conditions are unfriendly. It has
been also found that pedestrians crossing should be enabled with sufficient
physical facilities that will enable the chances to lower accident prone
zones since from the analysis it has been found that partition crossing
without physical facilities have higher impact in rendering more amount of
accidents in the A-roads of UK. In case of weather conditions it has been
49
Paraphrase This Document
Need a fresh take? Get an instant paraphrase of this document with our AI Paraphraser

found that the P value is 0.051 which is above the 0.05 and but lower than
0.06 hence it is weakly significant in rendering impact over A-roads of UK.
On the other hand the light conditions needs severe improvement since the
p-value have come out in case of light conditions to be 0.01 which is
significant at 99% level of significance is the fact that it is an independent
variable that have the ability to printer significant impact over the response
variable as revealed by the data obtained from the last 11 years data.
Carriageway hazards have a p value of 0.02 which is quite low 95% level of
significance value of 0.05. In case of road service condition the p-value
came out to be 0.04 which is found to be most significant independent
variable that is able to render impact in changing the intensity of road
accidents in the A-roads of UK. . It has been also found that pedestrians
crossing should be enabled with sufficient physical facilities that will enable
the chances to lower accident prone zones since from the analysis it has
been found that partition crossing without physical facilities have higher
impact in rendering more amount of accidents in the A-roads of UK. In case
of weather conditions it has been found that the P value is 0.051 which is
above the 0.05 and but lower than 0.06 hence it is weakly significant in
rendering impact over A-roads of UK. On the other hand the light conditions
needs severe improvement since the p-value have come out in case of light
conditions to be 0.01 which is significant at 99% level of significance is the
fact that it is an independent variable that have the ability to printer
significant impact over the response variable as revealed by the data
obtained from the last 11 years data. Carriageway hazards have a p value
of 0.02 which is quite low 95% level of significance value of 0.05. In case of
road service condition the p-value came out to be 0.04 which is found to be
most significant independent variable that is able to render impact in
50

changing the intensity of road accidents in the A-roads of UK. It has been
also found that pedestrians crossing should be enabled with sufficient
physical facilities that will enable the chances to lower accident prone
zones since from the analysis it has been found that partition crossing
without physical facilities have higher impact in rendering more amount of
accidents in the A-roads of UK. In case of weather conditions it has been
found that the P value is 0.051 which is above the 0.05 and but lower than
0.06 hence it is weakly significant in rendering impact over A-roads of UK.
On the other hand the light conditions needs severe improvement since the
p-value have come out in case of light conditions to be 0.01 which is
significant at 99% level of significance is the fact that it is an independent
variable that have the ability to printer significant impact over the response
variable as revealed by the data obtained from the last 11 years data.
From the summary output the regression analysis effectively treated
depending upon the values that it has provided with statistical significance.
The multiple R value provides the existing level of correlation between the
independent variable and dependent variables which is found to be almost
98.54%. This is quite good. The R squared value is equals to 0.9710 which
incorporates the fact that patients within the response variable can be
predicted accuracy of 97.10% by the independent variables chosen for the
research. The adjusted R square is found to be 0.9594 which is 95.94 %
and this value came out based upon the number of independent variables
chosen and the sample size. It has been found that if more amount of
independent variables are used in that just ask where will reveal that the
model will have to pay penalty on the sample size is increased then the
result will be more accurate. Hence, the adjusted R square is a most e
instrument to understand the quality of the regression results. Significant P
51

value of test statistics is found to be below 0.05 and hence the model is
significant in analyzing the impact of over the number of accidents that
taking place in the A-roads of United Kingdom. In case of the police officers
that are present at the scene of accident it has been found that the
coefficient is positive while in case of pedestrians crossings with physical
facilities it is also positive but with a lower magnitude... In both of these
cases both the variables are found to render significant impact upon the
response variable. Carriageway hazards have a p value of 0.02 which is
quite low 95% level of significance value of 0.05. In case of road service
condition the p-value came out to be 0.04 which is found to be most
significant independent variable that is able to render impact in changing
the intensity of road accidents in the A-roads of UK.
8. Conclusion and recommendation
The result or outcome show that are leading the road traffic accidents due
to human errors, improper regulations. Main victims of People which mainly
include pedestrians and passengers. Furthermore, it has concluded that
public be sensitized and also encouraging the people in term of education,
observance of traffic regulations, overloading and careless overtaking. In
order to recognize the specific rights, need or requirements of pedestrians
or passenger. Government always encouraging or motivating the people to
construct good roads, provision of efficient public transport and maintain re-
training public services in proper manner.
The weather condition have a close to zero official value while the
carriageway hazards as a positive Coefficient value and light conditions
52
Secure Best Marks with AI Grader
Need help grading? Try our AI Grader for instant feedback on your assignments.

and Road surface condition have negative Coefficient value. The T -
statistics in case of police officers those of which are present at scene of
accidents is found to be 3.33 which is beyond the critical region of - 2.228
and + 2.228. The t statistic value reveals that the considered independent
variable is able to measure the variation with accuracy within the
independent variable. Similarly the t competition coaching that have
physical facilities have value of 3.34 which is critical region of - 2.228 to
that of + 2.228. It is quite significant and reflects the fact that the value is
quite good and it is responsible for the increase of this variation in the
response variable. In case of carriageway hazard, the tested value is found
to be critical region of - 2.228 that of + 2.228 since its value is 3.16 which is
quite decent and it signifies the fact that the variable can be tested for the
analysis. The t-stat value in case of road surface condition and that of the
light condition is found to be negative their t statistic value is beyond the
critical region of - 2.228 to that of + 2.228 and hence the can be tested for
the obtainment of the results. finally the people of statistics are measured
in case of all the variables and it has been found to be most significant in
case of police officers that are present in the scene of accident and the
people is came out to be 0.0075 which is much lower than that of 0.05. This
incorporate the fact that at 5% level of significance and 95% confidence
53

interval level the variable is significant enough in making a change within
the accidents that are taking place in the A-roads of United Kingdom.
Moreover, pedestrian crossing that has physical facilities significance in this
value is 0.0074 which is much lower than that of 0.05.
Recommendations are drawn over the fact that it is highly essential to
police officer that should be present in accident prone zones. Secondly
there is higher importance to the light conditions in the night or in Sub-
urban areas which requires significant improvement. The road service
conditions in the roads of UK should also be improved in order to avoid the
intensity of accidents which are found to get lowered after 2017 and
onwards.
54

9. Reference
brake.org.uk 2020.Data regarding road accidents in the UK Available at:
https://www.brake.org.uk/facts-resources/1653-uk-road-
casualties[accessed on 24th January 2020]
Cartwright, A., 2018. The psychological effects of road traffic accidents
(RTAs): an exploration of a United Kingdom medico-legal examiner's
career of RTA assessments. Psychiatry, psychology and law, 25(2),
pp.303-324.
Cartwright, A., and Roach, J., 2016. Fraudulently claiming following a road
traffic accident: A pilot study of UK residents' attitudes. Psychiatry,
psychology and law, 23(3), pp.446-461.
core.ac.UK (2020), Traffic Psychology and Driver Behavior, Available at:
https://core.ac.uk/download/pdf/81967216.pdf [Accessed on 16th February,
2020]
Data.gov.uk. 2020. Road Safety Data - Data.Gov.Uk. [online] Available at:
<https://data.gov.uk/dataset/cb7ae6f0-4be6-4935-9277-47e5ce24a11f/
road-safety-data> [Accessed 7 June 2020].
Gorea, R.K., 2016. Financial impact of road traffic accidents on the
society. International journal of ethics, trauma and victimology, 2(1),
pp.e6494-e6494.
Harris, G.L., Brodbelt, D., Church, D., Humm, K., McGreevy, P.D.,
Thomson, P.C., and O'Neill, D., 2018. Epidemiology, clinical management,
and outcomes of dogs involved in road traffic accidents in the United
55
Paraphrase This Document
Need a fresh take? Get an instant paraphrase of this document with our AI Paraphraser

Kingdom (2009–2014). Journal of Veterinary Emergency and Critical
Care, 28(2), pp.140-148.
Haynes, S., Estin, P.C., Lazarevski, S., Soosay, M. and Kor, A.L., 2019,
June. Data Analytics: Factors of Traffic Accidents in the UK. In 2019 10th
International Conference on Dependable Systems, Services and
Technologies (DESSERT) (pp. 120-126). IEEE.
Liu, G., Chen, S., Zeng, Z., Cui, H., Fang, Y., Gu, D., Yin, Z., and Wang, Z.,
2018. Risk factors for extremely serious road accidents: Results from the
National Road Accident Statistical Annual Report of China. PLoS
One, 13(8).
Lokala, U., Nowduri, S. and Sharma, P.K., 2017. Road Accidents Big data
Mining and Visualization using Support Vector Machines.
Morgan, J.I., Abbott, R., Furness, P., and Ramsay, J., 2016. UK rail
workers' perceptions of accident risk factors: an exploratory study.
International journal of industrial ergonomics, 55, pp.103-113.
Murray, J.K., Casey, R.A., Gale, E., Buffington, C.A.T., Roberts, C.,
Kinsman, R.H., and Gruffydd-Jones, T.J., 2017. Cohort Profile: The 'Bristol
Cats Study'(BCS)–a birth cohort of kittens owned by UK households.
International journal of epidemiology, 46(6), pp.1749-1750e.
Nævestad, T.O., Phillips, R.O., and Elvebakk, B., 2015. Traffic accidents
triggered by drivers at work–A survey and analysis of contributing factors.
Transportation research part F: traffic psychology and behavior, 34, pp.94-
107.
Nikitas, A., Kougias, I., Alyavina, E. and NjoyaTchouamou, E., 2017. How
can autonomous and connected vehicles, electro mobility, BRT, hyper loop,
shared-use mobility, and mobility-as-a-service shape transport futures for
the context of smart cities?Urban Science, 1(4), p.36.
56

publishing.service.gov.uk (2020) Impact of road accidents on the life of
people in UK Available at:
https://assets.publishing.service.gov.uk/government/uploads/system/
uploads/attachment_data/file/834585/reported-road-casualties-annual-
report-2018.pdf [accessed 29th January 2020]
racfoundation.org (2017) road accidents due to drink driving Available at:
https://www.racfoundation.org/motoring-faqs/safety [accessed 28th January
2020]
Rolison, J.J., Regev, S., Moutari, S., and Feeney, A., 2018. What are the
factors that contribute to road accidents? An assessment of law
enforcement views, ordinary drivers' opinions, and road accident records.
Accident Analysis & Prevention, 115, pp.11-24.
seriousinjurylaw.co.uk (2020) Reasons for traffic accidents in the UK
Available at: http://www.seriousinjurylaw.co.uk/resources/blog/5-major-
causes-of-uk-road-traffic-accidents-and-how-to-avoid-them/ [accessed 30th
January 2020]
Smith, A.P., 2016. A UK survey of driving behavior, fatigue, risk-taking, and
road traffic accidents. BMJ Open, 6(8).
statista.com (2018) Economic burden of traffic accidents in UK Available at:
https://www.statista.com/statistics/322862/average-cost-of-road-accidents-
and-casualties-in-great-britain-uk/ [accessed 25th January 2020]
togetherforsaferroads.org (2020) Economic impact of road accidents
Available at: https://www.togetherforsaferroads.org/blog/4-ways-road-
crashes-impact-the-economy/ [accessed 26th January 2020]
Wijnen, W. and Stipdonk, H., 2016. Social costs of road crashes: An
international analysis. Accident Analysis & Prevention, 94, pp.97-106.
57

Yannis, G., Evgenikos, P., Hoeglinger, S., Bos, N., Broughton, J., and
Lawton, B., 2016, October. Comparative analysis of road safety parameters
in the European motorways. In Proceedings of the 1st European Road
Infrastructure Congress, Leeds, UK (pp. 18-20).
58
Lawton, B., 2016, October. Comparative analysis of road safety parameters
in the European motorways. In Proceedings of the 1st European Road
Infrastructure Congress, Leeds, UK (pp. 18-20).
58
Secure Best Marks with AI Grader
Need help grading? Try our AI Grader for instant feedback on your assignments.

10. Appendix
Appendix 1: Analysis of Accidents in the A roads of UK 2009 - 2019
Table 2: 12 year’s data on Accidents in the A roads of UK 2009 -
2019(Road Safety Data - data.gov.uk. 2020)
Va
ria
ble
s
Su
m
of
Ac
cid
en
t
Se
ve
rity
Po
lic
e
Off
ice
r
Att
en
d
Sc
en
e
of
Ac
cid
en
t
S
u
m
of
Ur
ba
n
or
R
ur
al
Ar
ea
Carr
iage
way
Haz
ards
Sp
eci
al
Co
ndit
ion
s at
Sit
e
Ro
ad
Sur
fac
e
Co
ndit
ion
s
We
ath
er
Co
ndit
ion
s
Lig
ht
Co
ndit
ion
s
Ped
estri
ans
Cro
ssin
g
Phy
sica
l
Faci
litie
s
Ped
estri
ans
Cro
ssin
g
Hu
ma
n
Con
trol
Nu
mb
er
of
Ca
sua
ltie
s
To
tal
Nu
m
be
r
of
Ve
hic
les
To
tal
Po
lic
e
Fo
rce
inv
olv
ed
in
re
du
cin
g
the
Ac
cid
ent
ca
se
s
20
09
46
45
51
19
58
07
22
25
70
115
79
181
77
229
488
267
129
319
589
116
382
161
7
222
146
29
86
87
50
56
27
6
20
10
28
14
01
18
46
28
20
93
40
115
22
171
07
222
757
248
061
292
692
118
393
192
0
208
648
43
93
40
47
13
93
59

0
20
11
27
61
55
18
02
54
20
43
72
109
55
157
27
197
484
227
345
291
471
118
147
116
8
203
950
42
98
42
46
30
12
8
20
12
41
25
38
17
18
53
19
64
33
105
39
150
81
201
373
227
655
286
514
118
214
146
3
195
723
26
58
77
44
45
90
3
20
13
39
31
40
16
39
59
18
75
86
101
02
139
58
186
785
214
017
271
069
114
462
100
1
183
670
25
29
13
42
41
78
2
20
14
41
49
74
17
30
37
19
63
57
101
16
141
91
194
335
219
570
281
538
125
504
122
7
194
477
26
85
27
43
74
41
9
20
15
39
68
98
16
78
58
18
80
32
864
9
138
43
181
914
211
699
273
395
117
480
100
8
186
189
25
78
45
41
87
96
1
20
16
38
47
48
17
13
18
18
47
81
757
0
116
59
176
473
212
186
270
989
112
627
152
9
181
384
25
25
00
40
79
55
8
20
17
36
40
60
17
25
24
16
43
94
607
2
940
0
166
909
213
370
264
721
107
034 356
170
993
23
89
26
37
08
12
6
20
18
34
13
98
15
86
78
16
27
39
573
8
928
5
155
393
198
299
245
763
106
126
-
519
160
597
22
64
09
34
74
24
3
20
19
12
91
19
14
76
81
15
78
93
237
2
373
9
594
79
743
68
921
87
354
02 470
616
88
86
21
5
15
54
80
3
60
20
11
27
61
55
18
02
54
20
43
72
109
55
157
27
197
484
227
345
291
471
118
147
116
8
203
950
42
98
42
46
30
12
8
20
12
41
25
38
17
18
53
19
64
33
105
39
150
81
201
373
227
655
286
514
118
214
146
3
195
723
26
58
77
44
45
90
3
20
13
39
31
40
16
39
59
18
75
86
101
02
139
58
186
785
214
017
271
069
114
462
100
1
183
670
25
29
13
42
41
78
2
20
14
41
49
74
17
30
37
19
63
57
101
16
141
91
194
335
219
570
281
538
125
504
122
7
194
477
26
85
27
43
74
41
9
20
15
39
68
98
16
78
58
18
80
32
864
9
138
43
181
914
211
699
273
395
117
480
100
8
186
189
25
78
45
41
87
96
1
20
16
38
47
48
17
13
18
18
47
81
757
0
116
59
176
473
212
186
270
989
112
627
152
9
181
384
25
25
00
40
79
55
8
20
17
36
40
60
17
25
24
16
43
94
607
2
940
0
166
909
213
370
264
721
107
034 356
170
993
23
89
26
37
08
12
6
20
18
34
13
98
15
86
78
16
27
39
573
8
928
5
155
393
198
299
245
763
106
126
-
519
160
597
22
64
09
34
74
24
3
20
19
12
91
19
14
76
81
15
78
93
237
2
373
9
594
79
743
68
921
87
354
02 470
616
88
86
21
5
15
54
80
3
60

Appendix 2: Accident Severity
61
61
Paraphrase This Document
Need a fresh take? Get an instant paraphrase of this document with our AI Paraphraser

Appendix 3: Road Surface Conditions
Figure 1: (Road Safety Data - data.gov.uk. 2020)
62
Figure 1: (Road Safety Data - data.gov.uk. 2020)
62

Appendix 4: Carriageway Hazards
Appendix 5Accidents in Urban or Rural Area
63
Appendix 5Accidents in Urban or Rural Area
63

Appendix 6: Police Officer Attend Scene of Accident
Appendix 7: Special Conditions at Site
64
Appendix 7: Special Conditions at Site
64
Secure Best Marks with AI Grader
Need help grading? Try our AI Grader for instant feedback on your assignments.

Appendix 8: Weather Conditions
Appendix 9: Light Conditions
65
Appendix 9: Light Conditions
65

66
1 out of 66
Related Documents

Your All-in-One AI-Powered Toolkit for Academic Success.
+13062052269
info@desklib.com
Available 24*7 on WhatsApp / Email
Unlock your academic potential
© 2024 | Zucol Services PVT LTD | All rights reserved.