Apple's International Business Strategy: Financial Analysis & More
VerifiedAdded on 2023/07/07
|30
|7351
|232
Report
AI Summary
This report provides a comprehensive analysis of Apple's international business strategy, starting with a brief background of the company, including its business units and areas of operation. It delves into Apple's financial performance, examining revenue, cost of sales, profit, working capital ratio, quick ratio, price-earnings ratio, debt-to-equity ratio, and return on equity. The report identifies Apple's corporate strategy as related diversification and analyzes the company's capabilities based on the value chain, covering firm infrastructure, human resource management, technological development, procurement, inbound logistics, operations, outbound logistics, marketing and sales, and service. Furthermore, it assesses Apple's generic competitive position using a matrix, presents a strategy map highlighting diversity in smartphone products, market share, and research & development, and evaluates Apple's diversification strategy using a diversification matrix. The report also identifies Apple's key stakeholders and concludes with recommendations for the company's future strategic direction. Desklib offers a wealth of similar solved assignments and past papers to aid students in their studies.
INDIVIDUAL ASSIGNMENT 2
INTERNATIONAL BUSINESS STRATEGY
Lecture: Bui Thuy Duong
IB1705_Group 6
Name ID Student Mission
Nguyễn Việt Yên HE161504 IV, VII, IX
Mai Thị Bảo Ngọc HS163324 II, III
Nguyễn Thị Xuân Mai HS163337 VI
Nguyễn Thị Mỹ Linh HS163466 I
Đào Minh Sơn HS176140 V, VIII
1
INTERNATIONAL BUSINESS STRATEGY
Lecture: Bui Thuy Duong
IB1705_Group 6
Name ID Student Mission
Nguyễn Việt Yên HE161504 IV, VII, IX
Mai Thị Bảo Ngọc HS163324 II, III
Nguyễn Thị Xuân Mai HS163337 VI
Nguyễn Thị Mỹ Linh HS163466 I
Đào Minh Sơn HS176140 V, VIII
1
Paraphrase This Document
Need a fresh take? Get an instant paraphrase of this document with our AI Paraphraser
TABLE OF CONTENTS
I. BRIEF BACKGROUND OF THE APPLE COMPANY.............................................4
1. Business units & business areas of each unit..................................................................4
2. Place of operates.............................................................................................................4
3. Scope of the analysis.......................................................................................................4
II. APPLE FINACIAL ANALYSIS.....................................................................................5
1. Revenue, cost of sale, profit............................................................................................5
2. Working capital ratio.......................................................................................................6
3. Quick ratio......................................................................................................................7
4. Price-earnings ratio (P/E)...............................................................................................7
5. Debt-to-equity ratio.........................................................................................................8
6. Return on equity (ROE)..................................................................................................9
III. CORPORATE STRATEGY AND DIVERSIFICATION TYPE OF APPLE..........10
IV. ANALYSIS CAPABILITIES OF THE APPLE INC BASE ON THE VALUE
CHAIN....................................................................................................................................11
1. Firm infrastructure........................................................................................................12
2. Human resources management.....................................................................................12
3. Technological development..........................................................................................13
4. Procurement..................................................................................................................13
5. Inbound logistics...........................................................................................................13
6. Operations.....................................................................................................................13
7. Outbound logistics........................................................................................................13
8. Marketing and Sales......................................................................................................14
9. Service...........................................................................................................................14
V. APPLE’S GENERIC COMPETITIVE POSITION MATRIX.................................15
1. The capabilities of the company...................................................................................15
2
2. Justification...................................................................................................................16
VI. STRATEGY MAP..........................................................................................................17
1. Diversity in smartphone products.................................................................................17
2. Market share..................................................................................................................18
3. Research & Development.............................................................................................19
VII. APPLE’S DIVERSIFICATION STRATEGY-DIVERSIFICATION MATRIC....21
1. High Industry attractiveness, high Business unit competitive advantage.....................22
2. High Industry attractiveness, low-medium business unit competitive advantage........22
3. Low Industry attractiveness, high Business unit competitive advantage......................23
4. Low Industry attractiveness, low Business unit competitive advantage.......................24
VIII. APPLE’S STAKEHOLDERS.....................................................................................24
IX. RECOMMENDATION.................................................................................................25
X. REFERENCES...............................................................................................................27
3
⊘ This is a preview!⊘
Do you want full access?
Subscribe today to unlock all pages.
Trusted by 1+ million students worldwide
I. BRIEF BACKGROUND OF THE APPLE COMPANY
1. Business units and business areas of each unit
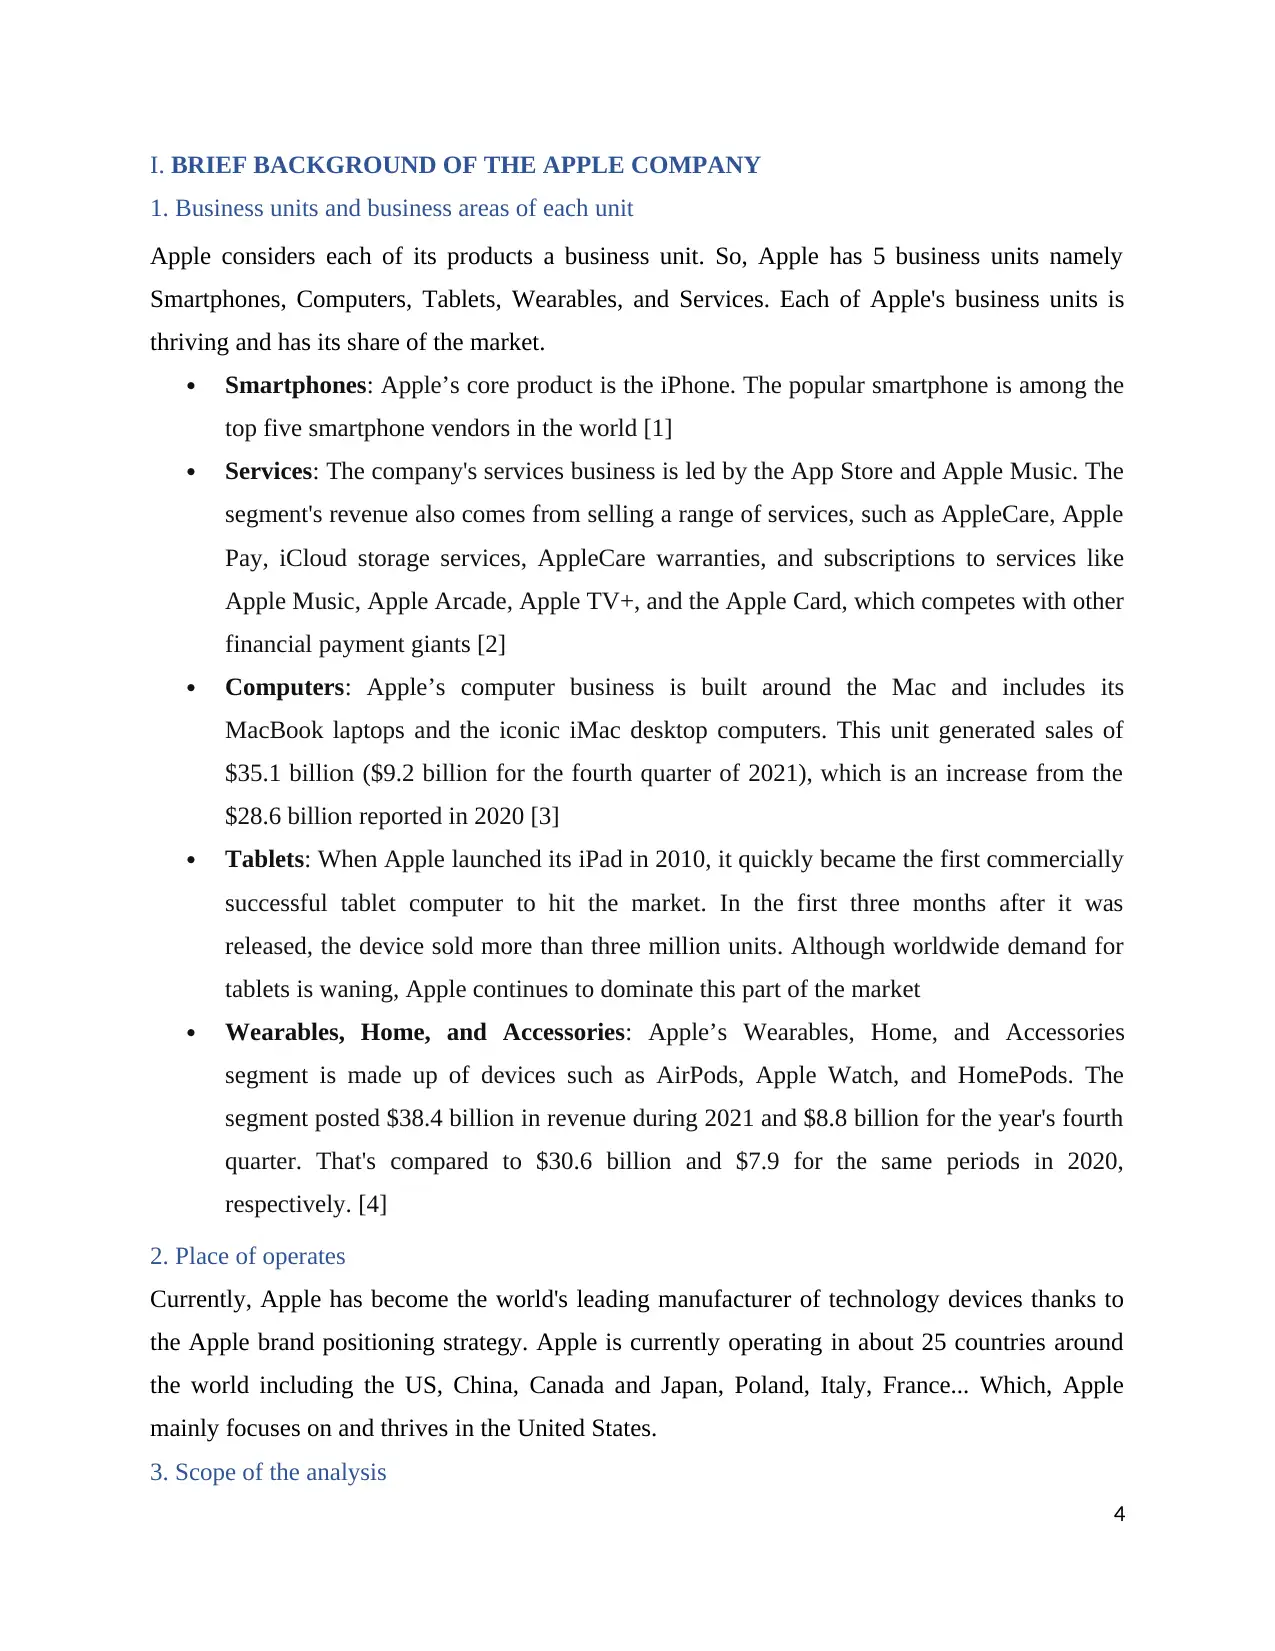
Apple considers each of its products a business unit. So, Apple has 5 business units namely
Smartphones, Computers, Tablets, Wearables, and Services. Each of Apple's business units is
thriving and has its share of the market.
Smartphones: Apple’s core product is the iPhone. The popular smartphone is among the
top five smartphone vendors in the world [1]
Services: The company's services business is led by the App Store and Apple Music. The
segment's revenue also comes from selling a range of services, such as AppleCare, Apple
Pay, iCloud storage services, AppleCare warranties, and subscriptions to services like
Apple Music, Apple Arcade, Apple TV+, and the Apple Card, which competes with other
financial payment giants [2]
Computers: Apple’s computer business is built around the Mac and includes its
MacBook laptops and the iconic iMac desktop computers. This unit generated sales of
$35.1 billion ($9.2 billion for the fourth quarter of 2021), which is an increase from the
$28.6 billion reported in 2020 [3]
Tablets: When Apple launched its iPad in 2010, it quickly became the first commercially
successful tablet computer to hit the market. In the first three months after it was
released, the device sold more than three million units. Although worldwide demand for
tablets is waning, Apple continues to dominate this part of the market
Wearables, Home, and Accessories: Apple’s Wearables, Home, and Accessories
segment is made up of devices such as AirPods, Apple Watch, and HomePods. The
segment posted $38.4 billion in revenue during 2021 and $8.8 billion for the year's fourth
quarter. That's compared to $30.6 billion and $7.9 for the same periods in 2020,
respectively. [4]
2. Place of operates
Currently, Apple has become the world's leading manufacturer of technology devices thanks to
the Apple brand positioning strategy. Apple is currently operating in about 25 countries around
the world including the US, China, Canada and Japan, Poland, Italy, France... Which, Apple
mainly focuses on and thrives in the United States.
3. Scope of the analysis
4
1. Business units and business areas of each unit
Apple considers each of its products a business unit. So, Apple has 5 business units namely
Smartphones, Computers, Tablets, Wearables, and Services. Each of Apple's business units is
thriving and has its share of the market.
Smartphones: Apple’s core product is the iPhone. The popular smartphone is among the
top five smartphone vendors in the world [1]
Services: The company's services business is led by the App Store and Apple Music. The
segment's revenue also comes from selling a range of services, such as AppleCare, Apple
Pay, iCloud storage services, AppleCare warranties, and subscriptions to services like
Apple Music, Apple Arcade, Apple TV+, and the Apple Card, which competes with other
financial payment giants [2]
Computers: Apple’s computer business is built around the Mac and includes its
MacBook laptops and the iconic iMac desktop computers. This unit generated sales of
$35.1 billion ($9.2 billion for the fourth quarter of 2021), which is an increase from the
$28.6 billion reported in 2020 [3]
Tablets: When Apple launched its iPad in 2010, it quickly became the first commercially
successful tablet computer to hit the market. In the first three months after it was
released, the device sold more than three million units. Although worldwide demand for
tablets is waning, Apple continues to dominate this part of the market
Wearables, Home, and Accessories: Apple’s Wearables, Home, and Accessories
segment is made up of devices such as AirPods, Apple Watch, and HomePods. The
segment posted $38.4 billion in revenue during 2021 and $8.8 billion for the year's fourth
quarter. That's compared to $30.6 billion and $7.9 for the same periods in 2020,
respectively. [4]
2. Place of operates
Currently, Apple has become the world's leading manufacturer of technology devices thanks to
the Apple brand positioning strategy. Apple is currently operating in about 25 countries around
the world including the US, China, Canada and Japan, Poland, Italy, France... Which, Apple
mainly focuses on and thrives in the United States.
3. Scope of the analysis
4
Paraphrase This Document
Need a fresh take? Get an instant paraphrase of this document with our AI Paraphraser
Analysis scope: International level
Valuation: Apple’s business is leading in the world. Up to now, with a market capitalization of
US$2.75 trillion as of May 2023, Apple was the largest company in the world that year.
Rounding out the top 5 are some of the most famous brands in the world, beating Amazon,
Google, and Microsoft. Apple is not only bigger than all 595 listed companies in the UK but also
bigger than all of the companies in France (235 companies) and India (1,242 companies). Apple
is twice the size of the entire German stock market, with 255 companies. This reflects the values
being given to companies that are: success and growth driven.
As of today, there are 2 billion devices in use by customers, up from 1.8 billion last year. [5]
II. APPLE’S FINANCIAL ANALYSIS
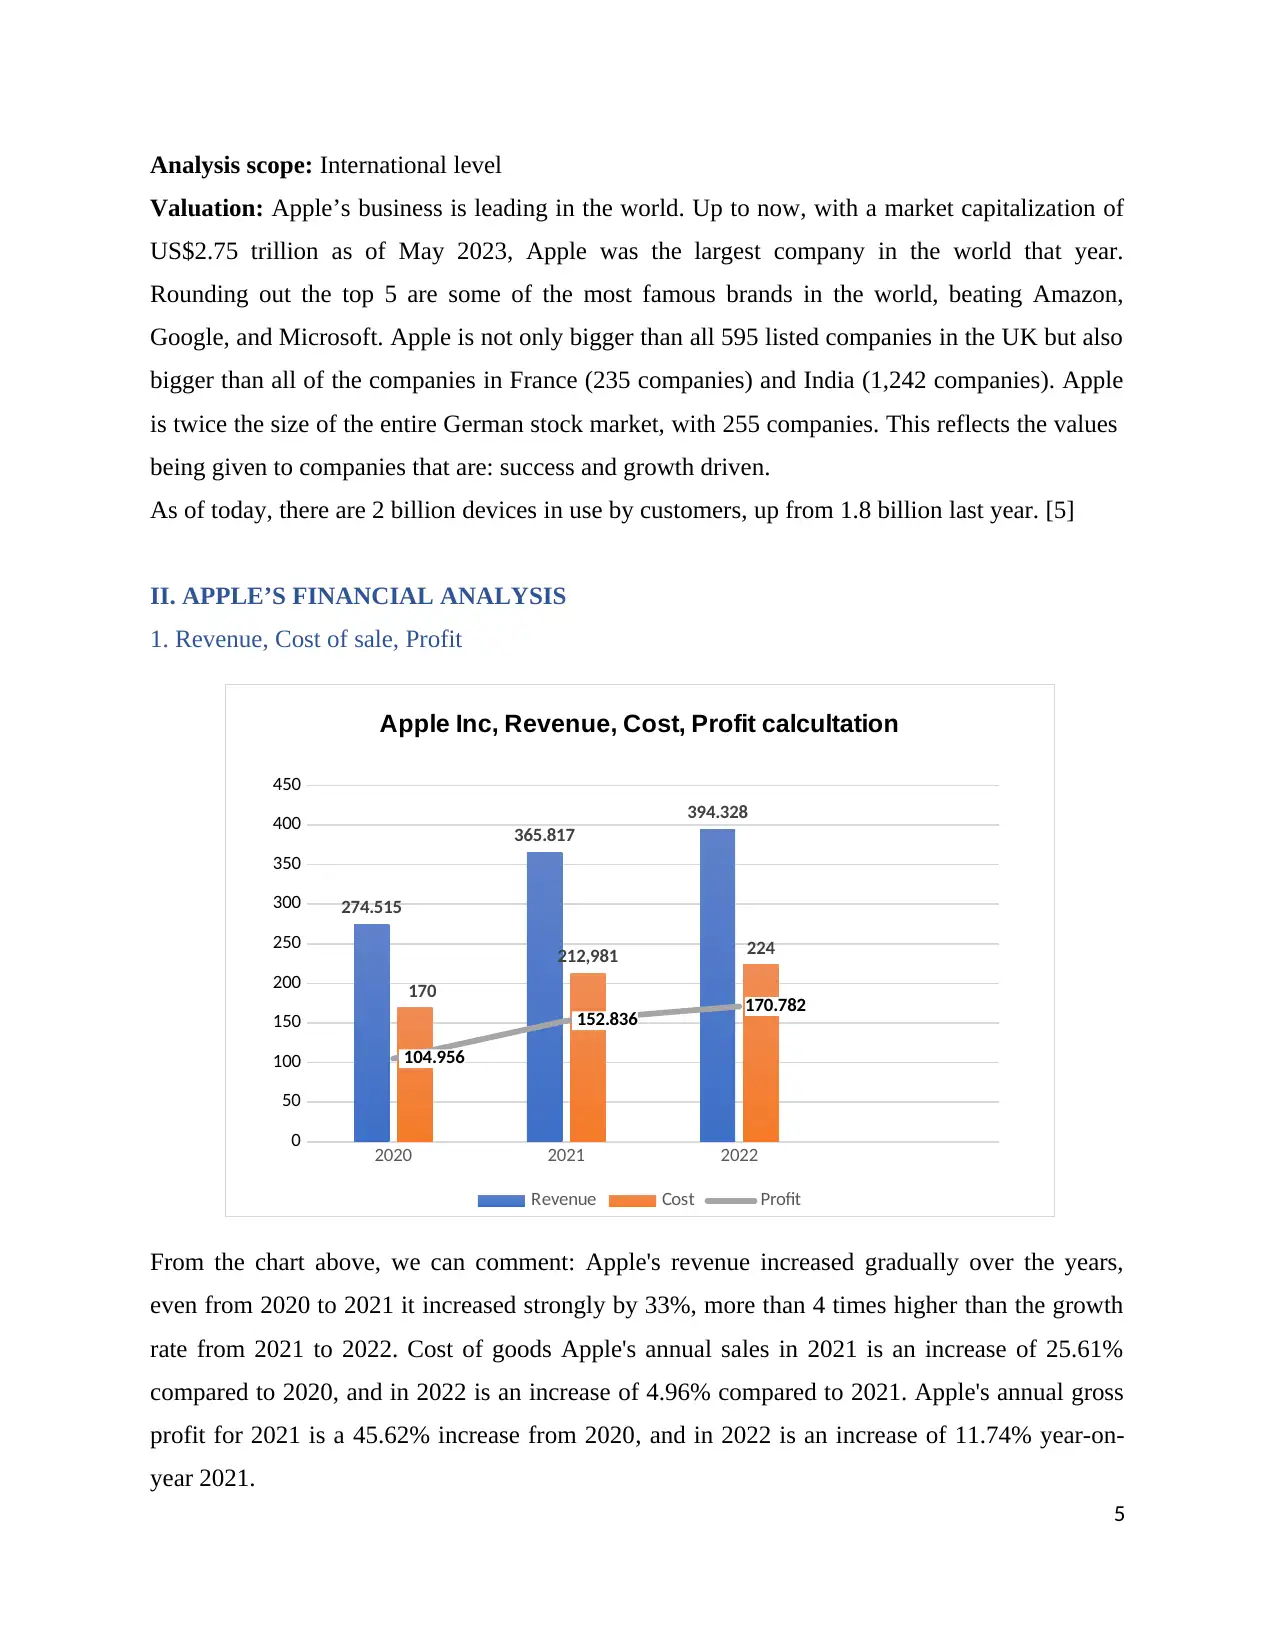
1. Revenue, Cost of sale, Profit
2020 2021 2022
0
50
100
150
200
250
300
350
400
450
274.515
365.817
394.328
170
212,981 224
104.956
152.836 170.782
Apple Inc, Revenue, Cost, Profit calcultation
Revenue Cost Profit
From the chart above, we can comment: Apple's revenue increased gradually over the years,
even from 2020 to 2021 it increased strongly by 33%, more than 4 times higher than the growth
rate from 2021 to 2022. Cost of goods Apple's annual sales in 2021 is an increase of 25.61%
compared to 2020, and in 2022 is an increase of 4.96% compared to 2021. Apple's annual gross
profit for 2021 is a 45.62% increase from 2020, and in 2022 is an increase of 11.74% year-on-
year 2021.
5
Valuation: Apple’s business is leading in the world. Up to now, with a market capitalization of
US$2.75 trillion as of May 2023, Apple was the largest company in the world that year.
Rounding out the top 5 are some of the most famous brands in the world, beating Amazon,
Google, and Microsoft. Apple is not only bigger than all 595 listed companies in the UK but also
bigger than all of the companies in France (235 companies) and India (1,242 companies). Apple
is twice the size of the entire German stock market, with 255 companies. This reflects the values
being given to companies that are: success and growth driven.
As of today, there are 2 billion devices in use by customers, up from 1.8 billion last year. [5]
II. APPLE’S FINANCIAL ANALYSIS
1. Revenue, Cost of sale, Profit
2020 2021 2022
0
50
100
150
200
250
300
350
400
450
274.515
365.817
394.328
170
212,981 224
104.956
152.836 170.782
Apple Inc, Revenue, Cost, Profit calcultation
Revenue Cost Profit
From the chart above, we can comment: Apple's revenue increased gradually over the years,
even from 2020 to 2021 it increased strongly by 33%, more than 4 times higher than the growth
rate from 2021 to 2022. Cost of goods Apple's annual sales in 2021 is an increase of 25.61%
compared to 2020, and in 2022 is an increase of 4.96% compared to 2021. Apple's annual gross
profit for 2021 is a 45.62% increase from 2020, and in 2022 is an increase of 11.74% year-on-
year 2021.
5
Thus, Apple's business activities in the last 3 years, including commercial transactions and sales
activities, are quite stable, and in general, bring profits to the corporation.
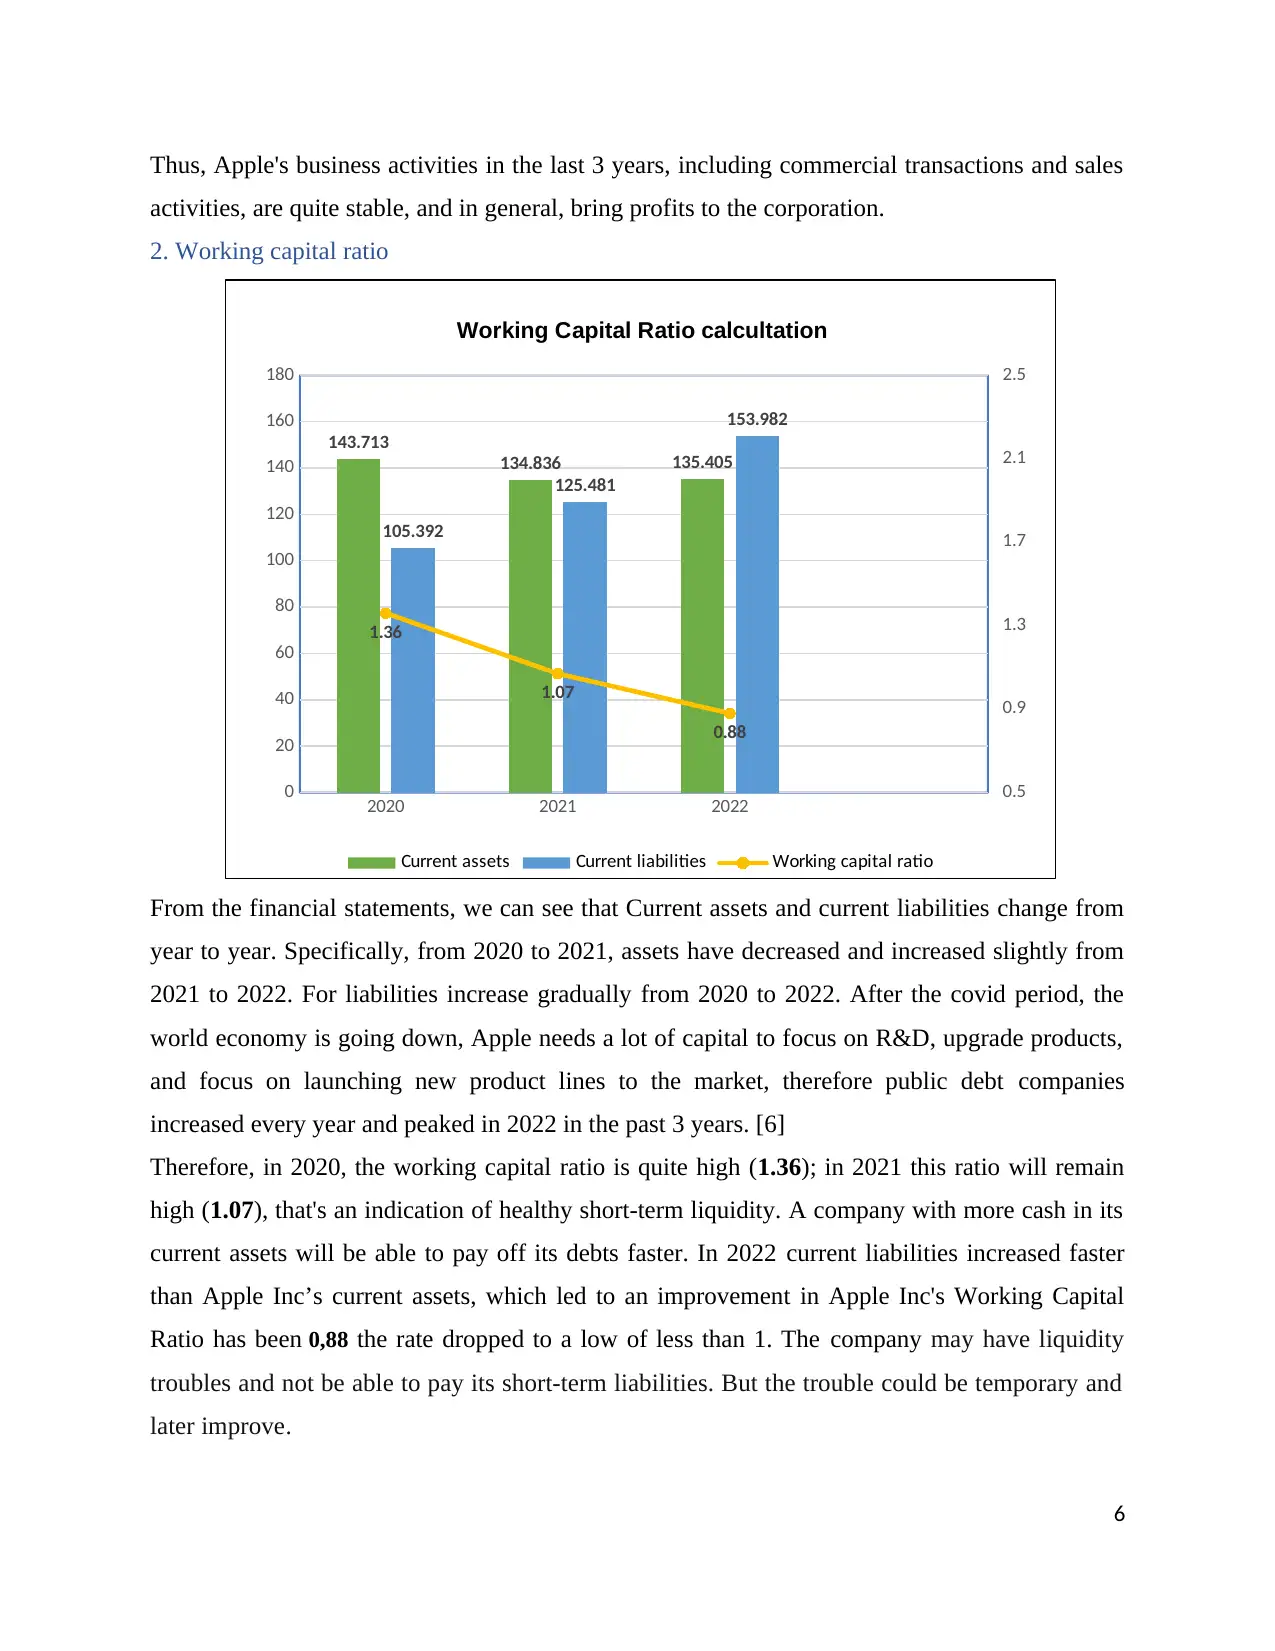
2. Working capital ratio
2020 2021 2022
0
20
40
60
80
100
120
140
160
180
0.5
0.9
1.3
1.7
2.1
2.5
143.713
134.836 135.405
105.392
125.481
153.982
1.36
1.07
0.88
Working Capital Ratio calcultation
Current assets Current liabilities Working capital ratio
From the financial statements, we can see that Current assets and current liabilities change from
year to year. Specifically, from 2020 to 2021, assets have decreased and increased slightly from
2021 to 2022. For liabilities increase gradually from 2020 to 2022. After the covid period, the
world economy is going down, Apple needs a lot of capital to focus on R&D, upgrade products,
and focus on launching new product lines to the market, therefore public debt companies
increased every year and peaked in 2022 in the past 3 years. [6]
Therefore, in 2020, the working capital ratio is quite high (1.36); in 2021 this ratio will remain
high (1.07), that's an indication of healthy short-term liquidity. A company with more cash in its
current assets will be able to pay off its debts faster. In 2022 current liabilities increased faster
than Apple Inc’s current assets, which led to an improvement in Apple Inc's Working Capital
Ratio has been 0,88 the rate dropped to a low of less than 1. The company may have liquidity
troubles and not be able to pay its short-term liabilities. But the trouble could be temporary and
later improve.
6
activities, are quite stable, and in general, bring profits to the corporation.
2. Working capital ratio
2020 2021 2022
0
20
40
60
80
100
120
140
160
180
0.5
0.9
1.3
1.7
2.1
2.5
143.713
134.836 135.405
105.392
125.481
153.982
1.36
1.07
0.88
Working Capital Ratio calcultation
Current assets Current liabilities Working capital ratio
From the financial statements, we can see that Current assets and current liabilities change from
year to year. Specifically, from 2020 to 2021, assets have decreased and increased slightly from
2021 to 2022. For liabilities increase gradually from 2020 to 2022. After the covid period, the
world economy is going down, Apple needs a lot of capital to focus on R&D, upgrade products,
and focus on launching new product lines to the market, therefore public debt companies
increased every year and peaked in 2022 in the past 3 years. [6]
Therefore, in 2020, the working capital ratio is quite high (1.36); in 2021 this ratio will remain
high (1.07), that's an indication of healthy short-term liquidity. A company with more cash in its
current assets will be able to pay off its debts faster. In 2022 current liabilities increased faster
than Apple Inc’s current assets, which led to an improvement in Apple Inc's Working Capital
Ratio has been 0,88 the rate dropped to a low of less than 1. The company may have liquidity
troubles and not be able to pay its short-term liabilities. But the trouble could be temporary and
later improve.
6
⊘ This is a preview!⊘
Do you want full access?
Subscribe today to unlock all pages.
Trusted by 1+ million students worldwide
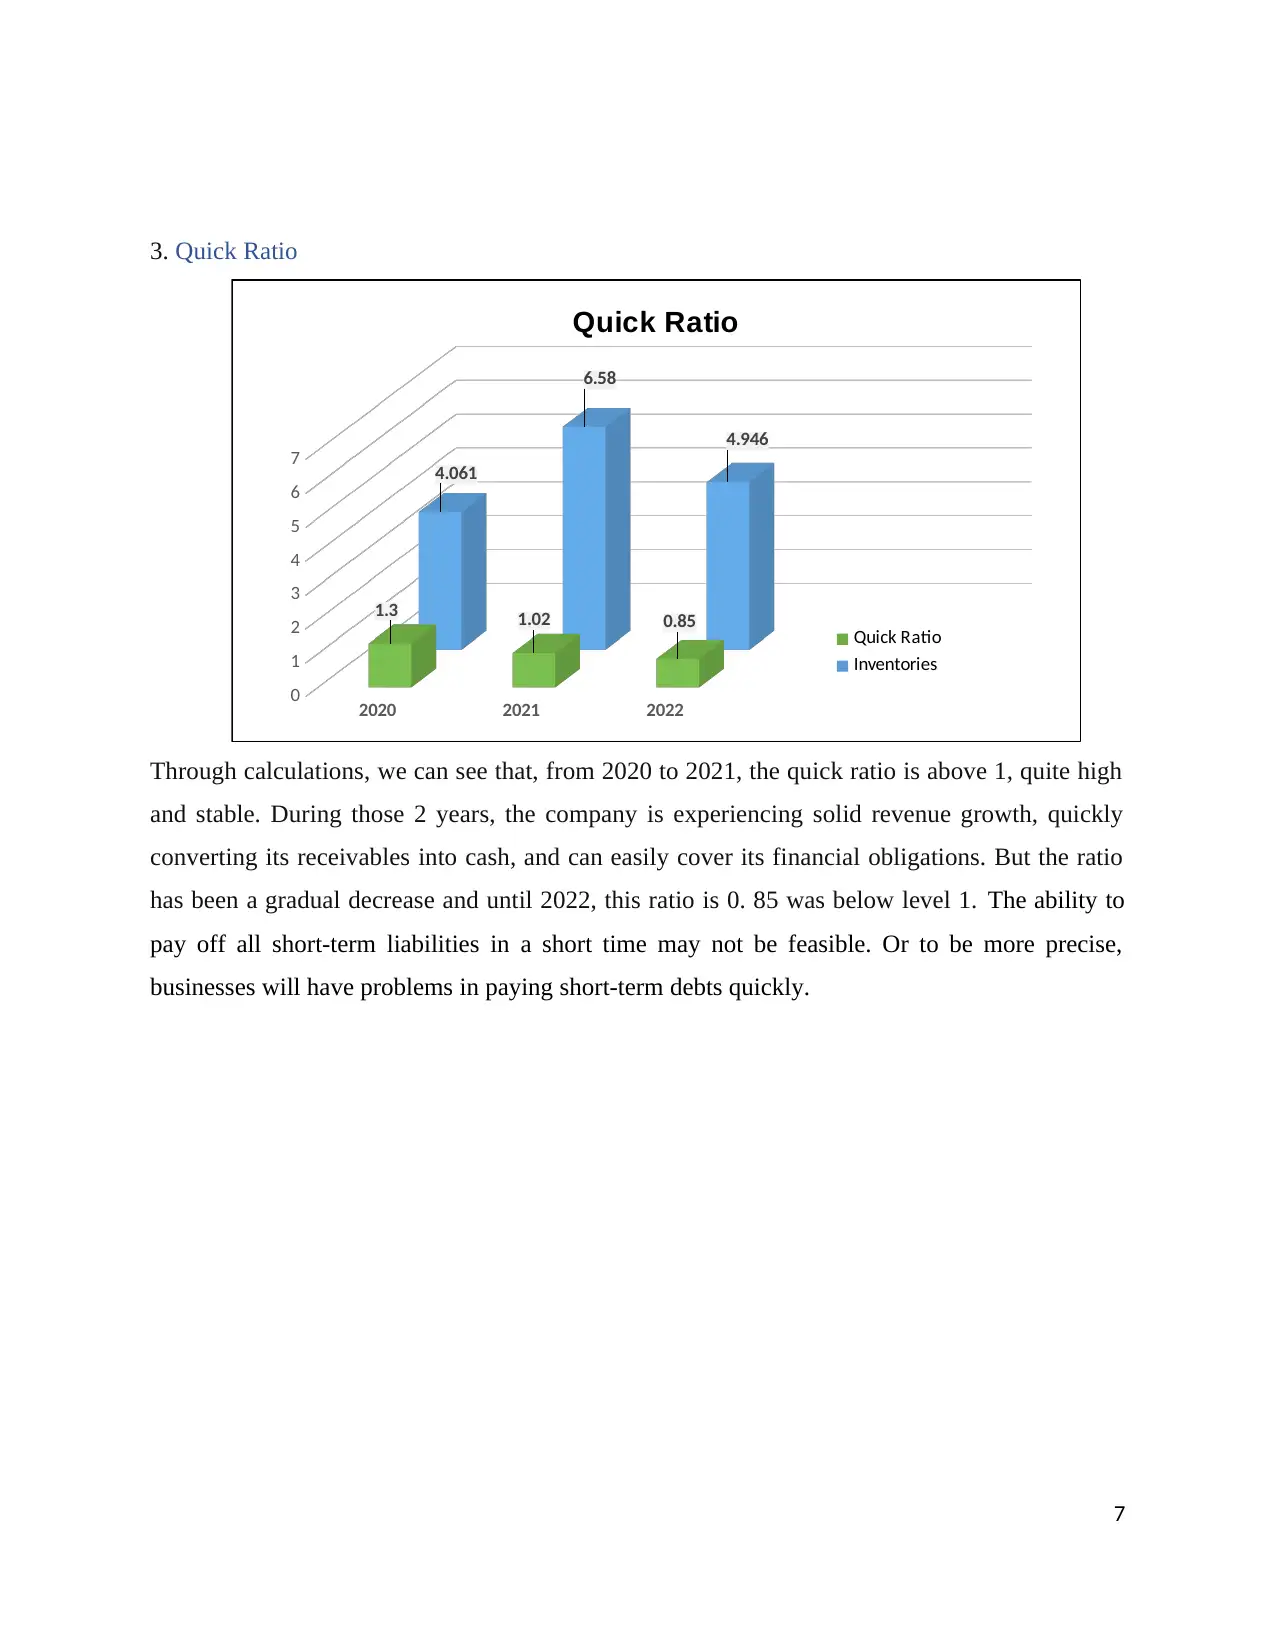
3. Quick Ratio
2020 2021 2022
0
1
2
3
4
5
6
7
1.3 1.02 0.85
4.061
6.58
4.946
Quick Ratio
Quick Ratio
Inventories
Through calculations, we can see that, from 2020 to 2021, the quick ratio is above 1, quite high
and stable. During those 2 years, the company is experiencing solid revenue growth, quickly
converting its receivables into cash, and can easily cover its financial obligations. But the ratio
has been a gradual decrease and until 2022, this ratio is 0. 85 was below level 1. The ability to
pay off all short-term liabilities in a short time may not be feasible. Or to be more precise,
businesses will have problems in paying short-term debts quickly.
7
Paraphrase This Document
Need a fresh take? Get an instant paraphrase of this document with our AI Paraphraser
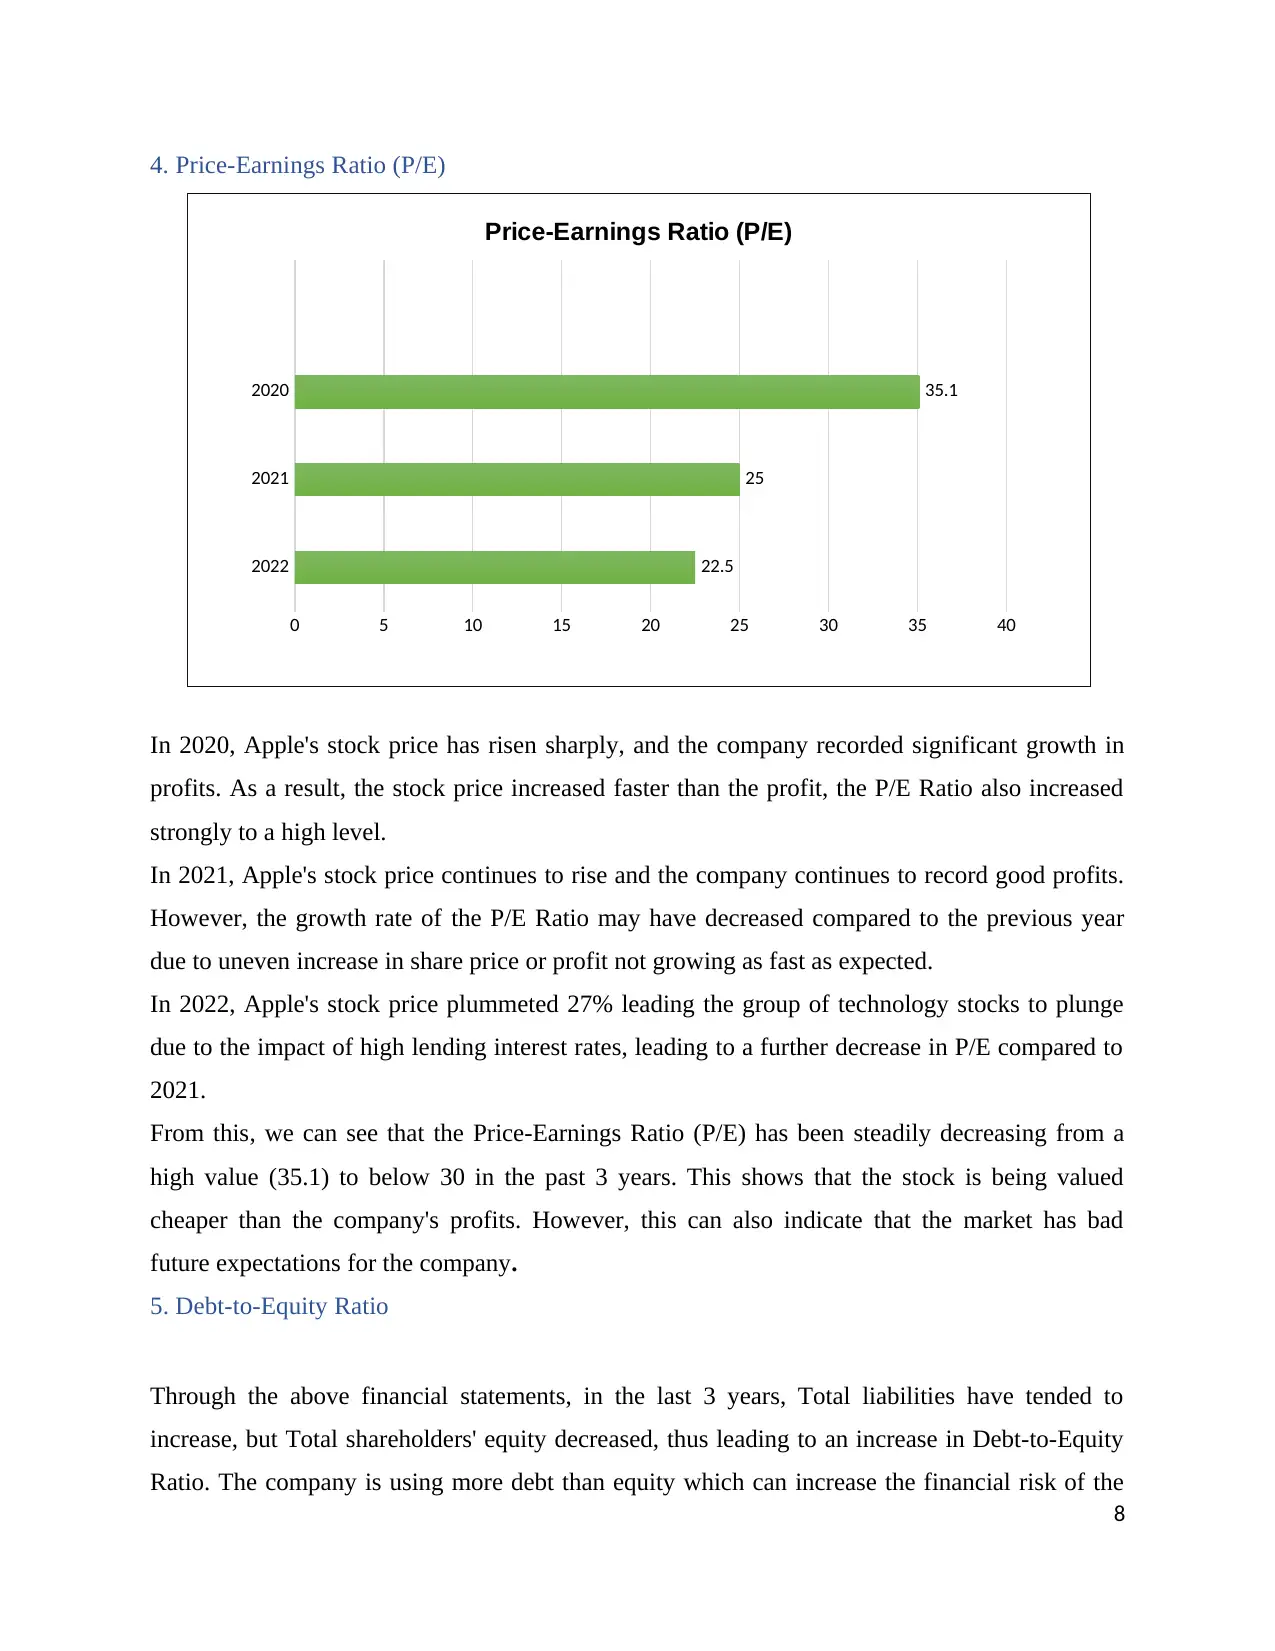
4. Price-Earnings Ratio (P/E)
2022
2021
2020
0 5 10 15 20 25 30 35 40
22.5
25
35.1
Price-Earnings Ratio (P/E)
In 2020, Apple's stock price has risen sharply, and the company recorded significant growth in
profits. As a result, the stock price increased faster than the profit, the P/E Ratio also increased
strongly to a high level.
In 2021, Apple's stock price continues to rise and the company continues to record good profits.
However, the growth rate of the P/E Ratio may have decreased compared to the previous year
due to uneven increase in share price or profit not growing as fast as expected.
In 2022, Apple's stock price plummeted 27% leading the group of technology stocks to plunge
due to the impact of high lending interest rates, leading to a further decrease in P/E compared to
2021.
From this, we can see that the Price-Earnings Ratio (P/E) has been steadily decreasing from a
high value (35.1) to below 30 in the past 3 years. This shows that the stock is being valued
cheaper than the company's profits. However, this can also indicate that the market has bad
future expectations for the company.
5. Debt-to-Equity Ratio
Through the above financial statements, in the last 3 years, Total liabilities have tended to
increase, but Total shareholders' equity decreased, thus leading to an increase in Debt-to-Equity
Ratio. The company is using more debt than equity which can increase the financial risk of the
8
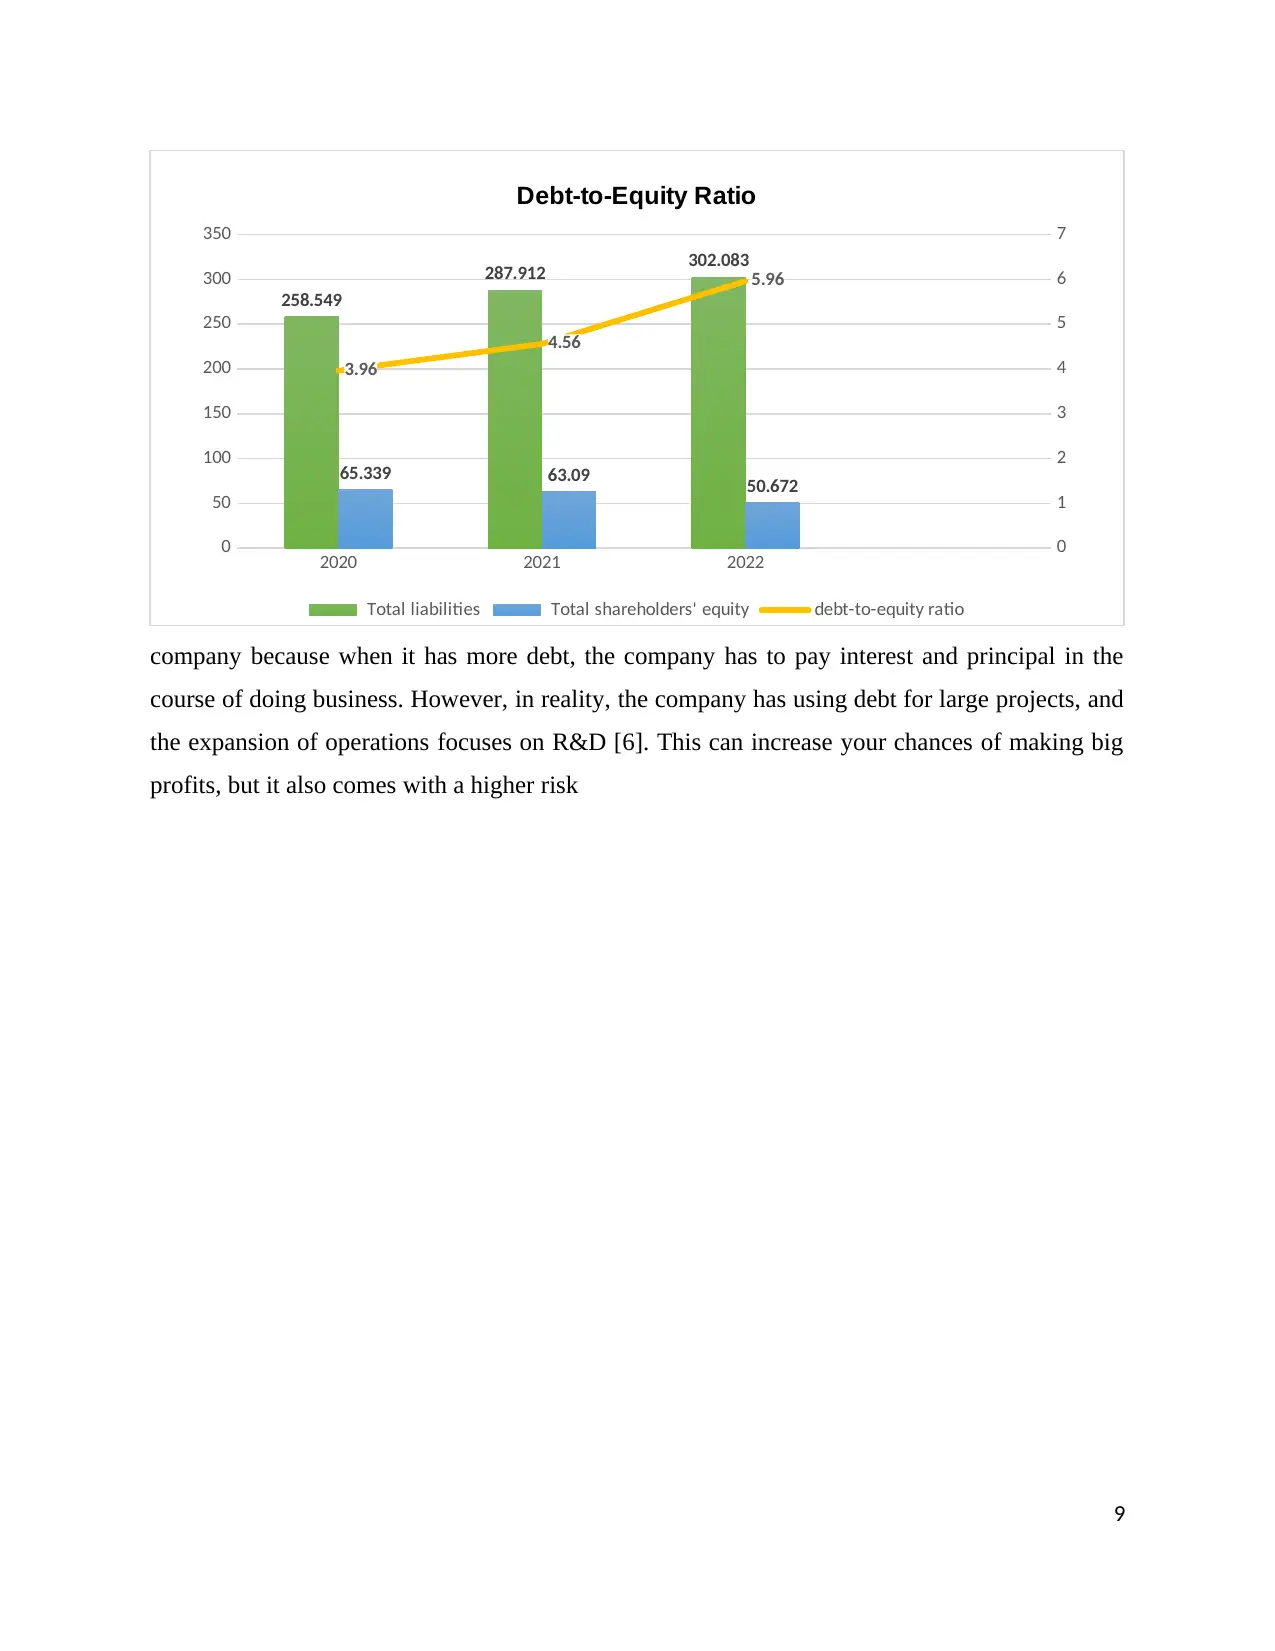
company because when it has more debt, the company has to pay interest and principal in the
course of doing business. However, in reality, the company has using debt for large projects, and
the expansion of operations focuses on R&D [6]. This can increase your chances of making big
profits, but it also comes with a higher risk
9
2020 2021 2022
0
50
100
150
200
250
300
350
0
1
2
3
4
5
6
7
258.549
287.912 302.083
65.339 63.09 50.672
3.96
4.56
5.96
Debt-to-Equity Ratio
Total liabilities Total shareholders' equity debt-to-equity ratio
⊘ This is a preview!⊘
Do you want full access?
Subscribe today to unlock all pages.
Trusted by 1+ million students worldwide
On the other hand, the owner's capital is quite low compared to total liabilities, according to the
report, revenue, and profit still increase at a stable and positive level. Therefore, it can be said
that Apple is using quite good financial leverage because revenue and profit are still increasing at
a stable and positive rate.
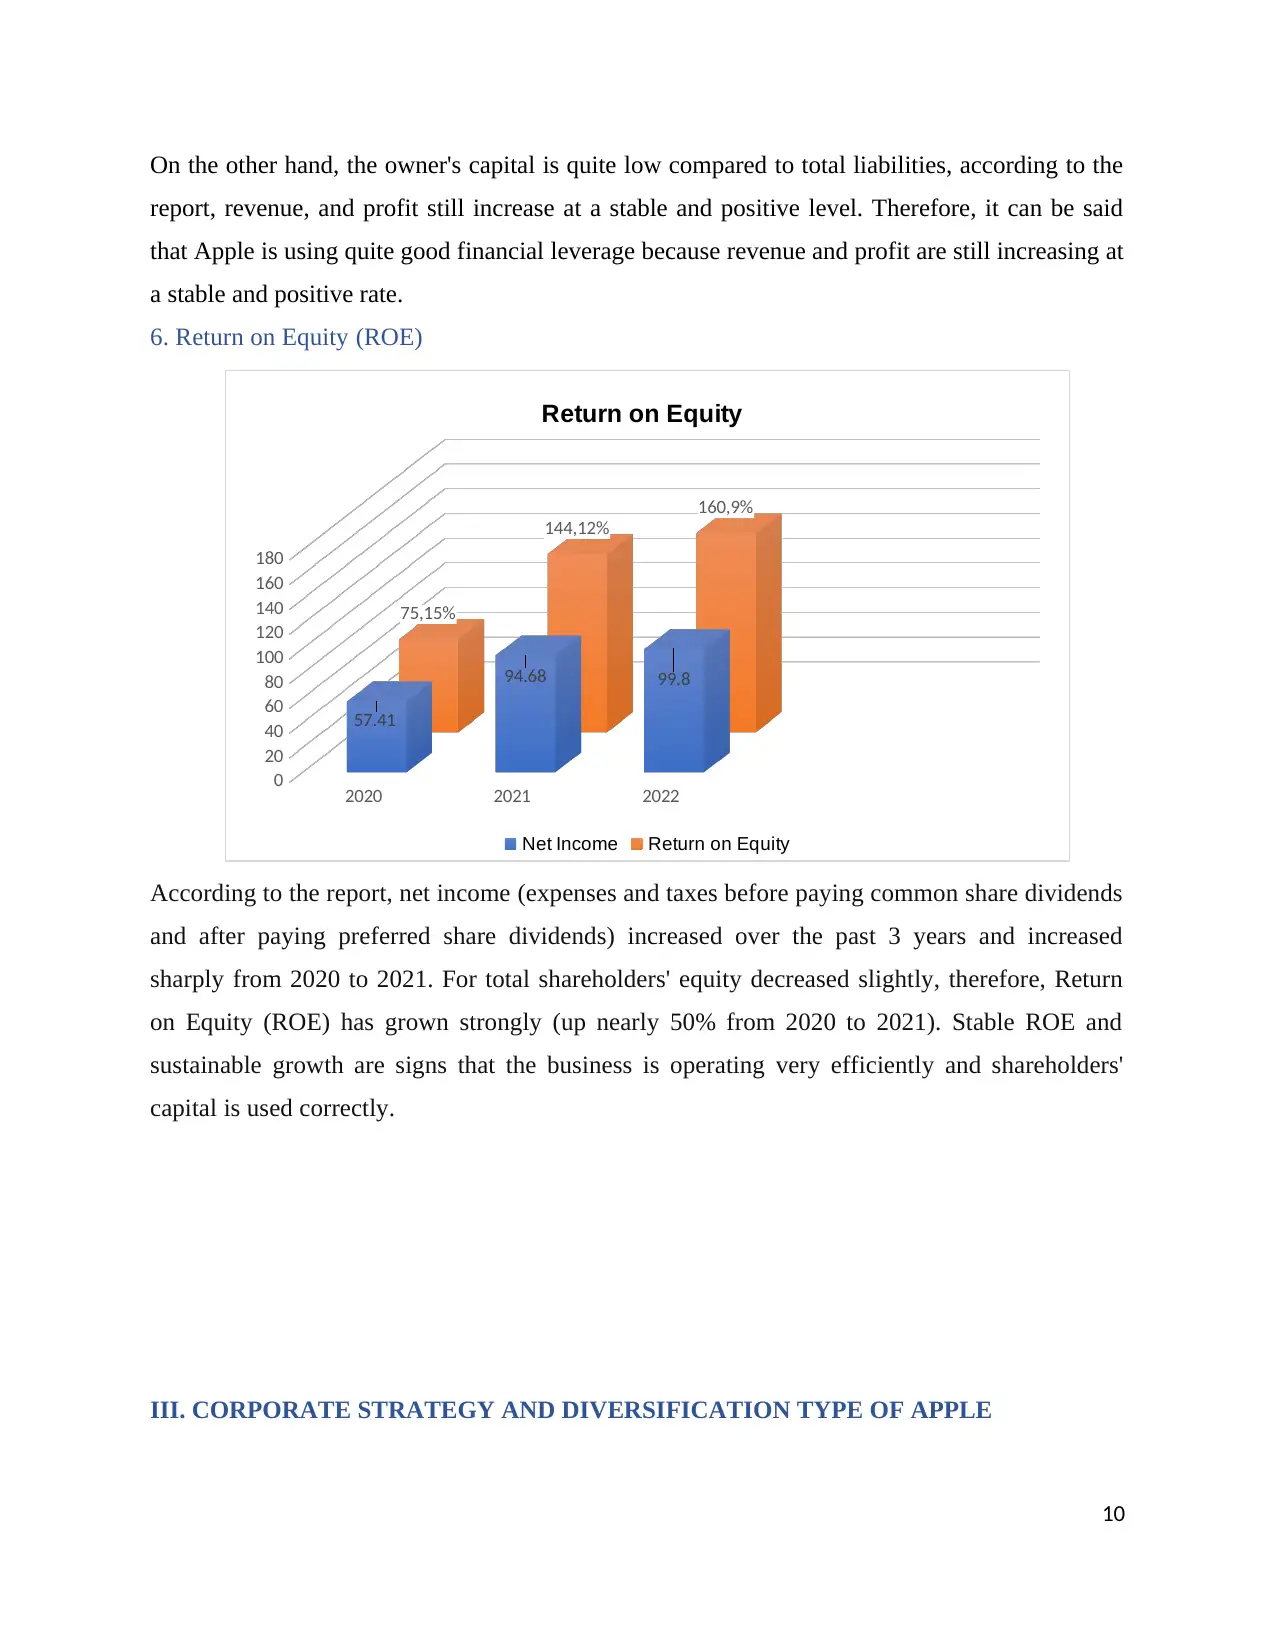
6. Return on Equity (ROE)
2020 2021 2022
0
20
40
60
80
100
120
140
160
180
57.41
94.68 99.8
75,15%
144,12%
160,9%
Return on Equity
Net Income Return on Equity
According to the report, net income (expenses and taxes before paying common share dividends
and after paying preferred share dividends) increased over the past 3 years and increased
sharply from 2020 to 2021. For total shareholders' equity decreased slightly, therefore, Return
on Equity (ROE) has grown strongly (up nearly 50% from 2020 to 2021). Stable ROE and
sustainable growth are signs that the business is operating very efficiently and shareholders'
capital is used correctly.
III. CORPORATE STRATEGY AND DIVERSIFICATION TYPE OF APPLE
10
report, revenue, and profit still increase at a stable and positive level. Therefore, it can be said
that Apple is using quite good financial leverage because revenue and profit are still increasing at
a stable and positive rate.
6. Return on Equity (ROE)
2020 2021 2022
0
20
40
60
80
100
120
140
160
180
57.41
94.68 99.8
75,15%
144,12%
160,9%
Return on Equity
Net Income Return on Equity
According to the report, net income (expenses and taxes before paying common share dividends
and after paying preferred share dividends) increased over the past 3 years and increased
sharply from 2020 to 2021. For total shareholders' equity decreased slightly, therefore, Return
on Equity (ROE) has grown strongly (up nearly 50% from 2020 to 2021). Stable ROE and
sustainable growth are signs that the business is operating very efficiently and shareholders'
capital is used correctly.
III. CORPORATE STRATEGY AND DIVERSIFICATION TYPE OF APPLE
10
Paraphrase This Document
Need a fresh take? Get an instant paraphrase of this document with our AI Paraphraser
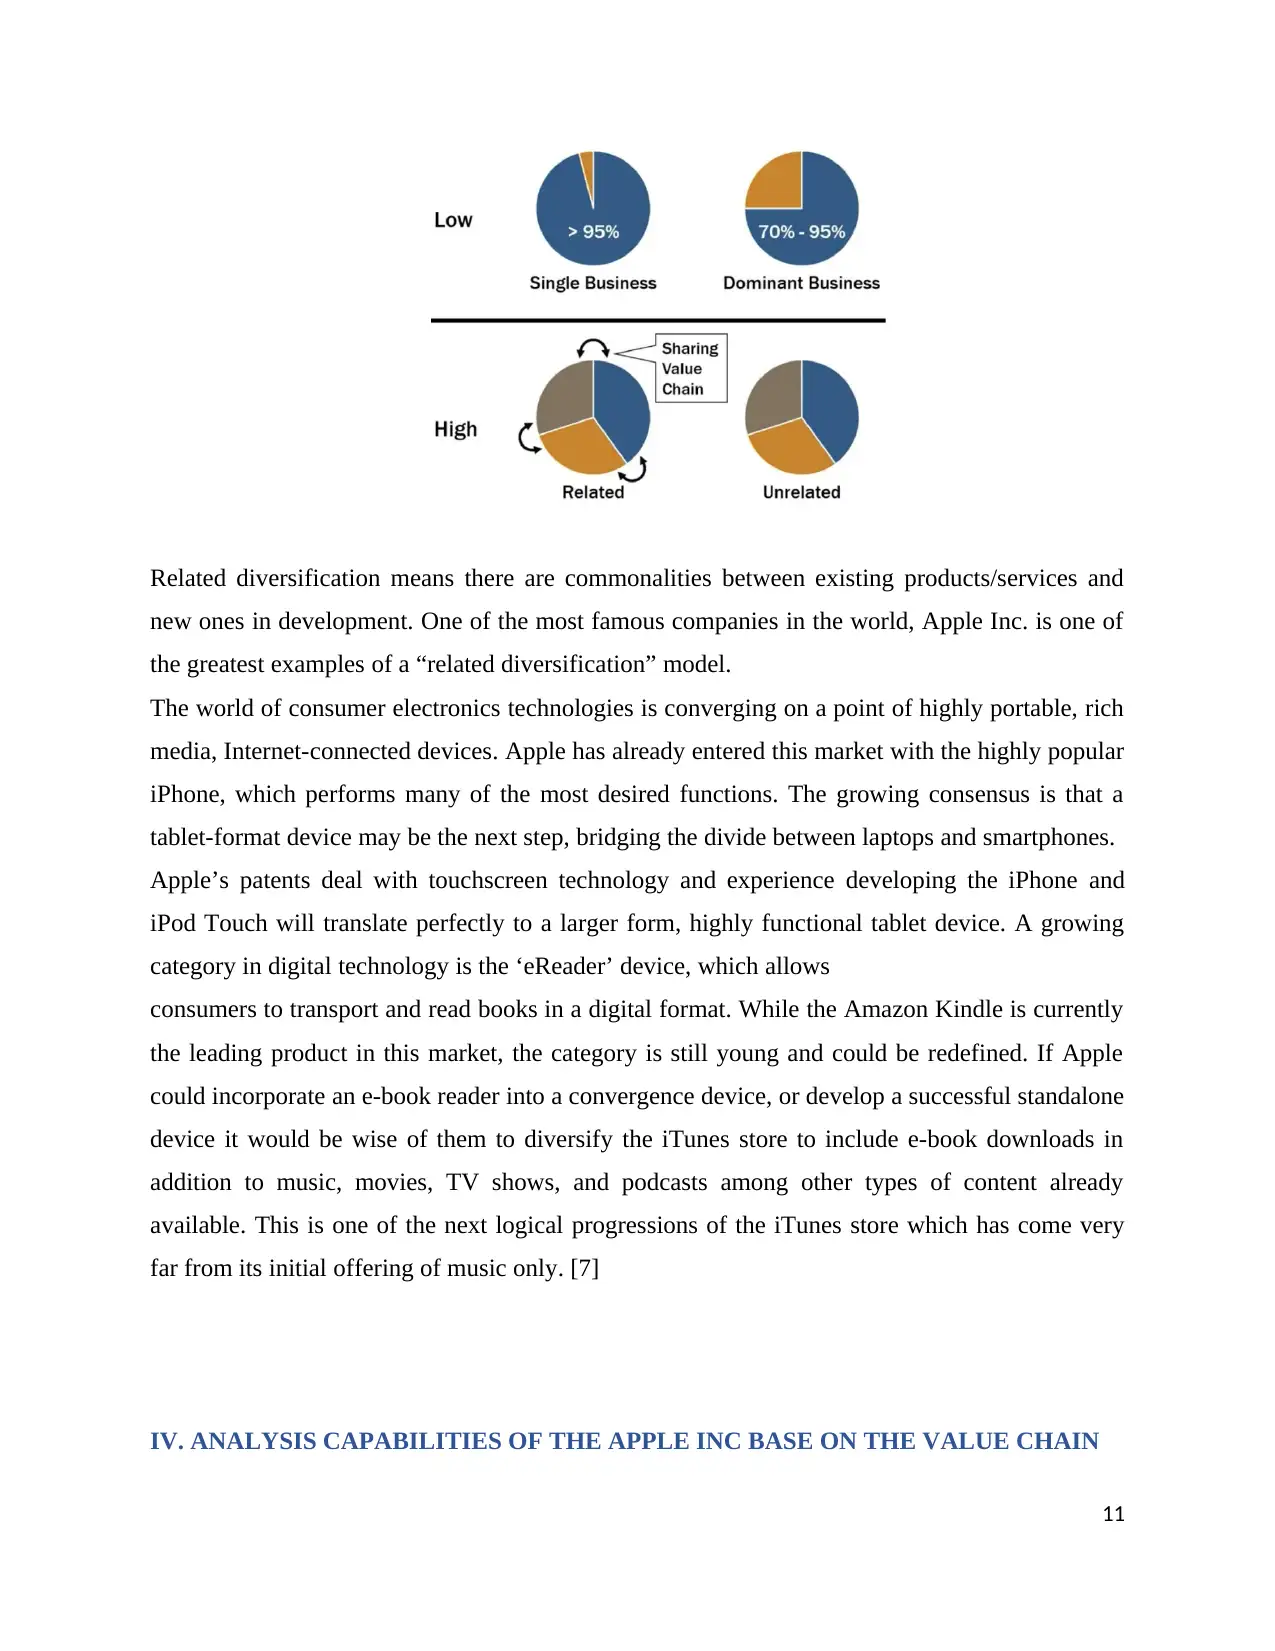
Related diversification means there are commonalities between existing products/services and
new ones in development. One of the most famous companies in the world, Apple Inc. is one of
the greatest examples of a “related diversification” model.
The world of consumer electronics technologies is converging on a point of highly portable, rich
media, Internet-connected devices. Apple has already entered this market with the highly popular
iPhone, which performs many of the most desired functions. The growing consensus is that a
tablet-format device may be the next step, bridging the divide between laptops and smartphones.
Apple’s patents deal with touchscreen technology and experience developing the iPhone and
iPod Touch will translate perfectly to a larger form, highly functional tablet device. A growing
category in digital technology is the ‘eReader’ device, which allows
consumers to transport and read books in a digital format. While the Amazon Kindle is currently
the leading product in this market, the category is still young and could be redefined. If Apple
could incorporate an e-book reader into a convergence device, or develop a successful standalone
device it would be wise of them to diversify the iTunes store to include e-book downloads in
addition to music, movies, TV shows, and podcasts among other types of content already
available. This is one of the next logical progressions of the iTunes store which has come very
far from its initial offering of music only. [7]
IV. ANALYSIS CAPABILITIES OF THE APPLE INC BASE ON THE VALUE CHAIN
11
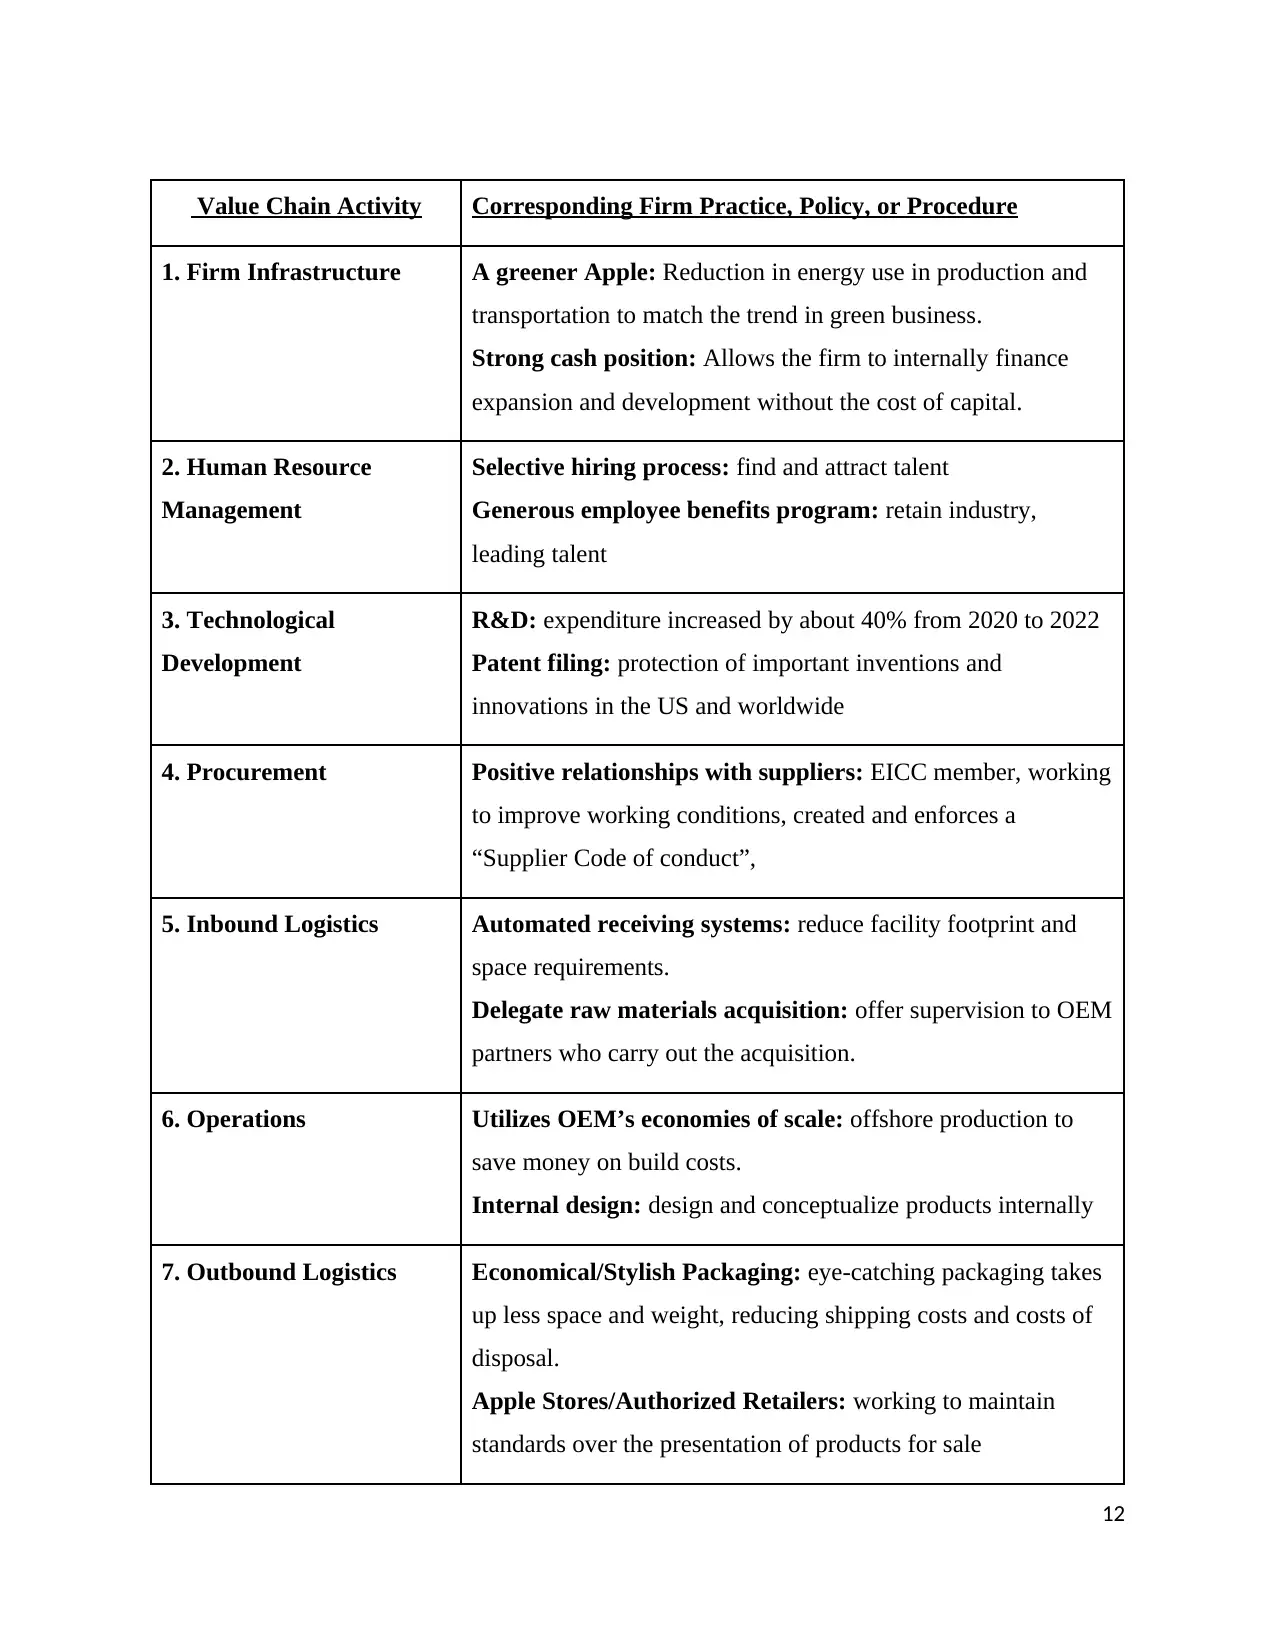
Value Chain Activity Corresponding Firm Practice, Policy, or Procedure
1. Firm Infrastructure A greener Apple: Reduction in energy use in production and
transportation to match the trend in green business.
Strong cash position: Allows the firm to internally finance
expansion and development without the cost of capital.
2. Human Resource
Management
Selective hiring process: find and attract talent
Generous employee benefits program: retain industry,
leading talent
3. Technological
Development
R&D: expenditure increased by about 40% from 2020 to 2022
Patent filing: protection of important inventions and
innovations in the US and worldwide
4. Procurement Positive relationships with suppliers: EICC member, working
to improve working conditions, created and enforces a
“Supplier Code of conduct”,
5. Inbound Logistics Automated receiving systems: reduce facility footprint and
space requirements.
Delegate raw materials acquisition: offer supervision to OEM
partners who carry out the acquisition.
6. Operations Utilizes OEM’s economies of scale: offshore production to
save money on build costs.
Internal design: design and conceptualize products internally
7. Outbound Logistics Economical/Stylish Packaging: eye-catching packaging takes
up less space and weight, reducing shipping costs and costs of
disposal.
Apple Stores/Authorized Retailers: working to maintain
standards over the presentation of products for sale
12
⊘ This is a preview!⊘
Do you want full access?
Subscribe today to unlock all pages.
Trusted by 1+ million students worldwide
1 out of 30
Related Documents


Your All-in-One AI-Powered Toolkit for Academic Success.
+13062052269
info@desklib.com
Available 24*7 on WhatsApp / Email
![[object Object]](/_next/static/media/star-bottom.7253800d.svg)
Unlock your academic potential
Copyright © 2020–2026 A2Z Services. All Rights Reserved. Developed and managed by ZUCOL.