Comprehensive Analysis: Australian Taxation Data (2013-2014)
VerifiedAdded on 2020/05/16
|9
|3085
|40
Report
AI Summary
This report analyzes Australian taxation data from the 2013-2014 financial year, focusing on lodgment methods (tax agent vs. self-prepare), income, and deductions. The analysis includes a descriptive overview of the dataset, classification of data types, and a discussion of data collection methods, specifically survey sampling. The report then presents statistical analyses, including frequency calculations, confidence interval calculations using the z-test, and chi-square tests to assess the association between age group and lodgment method. Graphical and numerical summaries are provided using STATKEY. Furthermore, the report explores the relationship between total income and total deduction amounts using scatterplots and Pearson correlation, providing insights into the distribution of income and the impact of lodgment methods on tax returns. The findings highlight differences in income levels and deduction patterns between those using tax agents and those self-preparing their returns.
Section 1
a. The dataset is a sample data of a financial year 2013 -2014 of Australian taxation office, the
data is collected on the basis of the lodgment method. The lodgment method is categorized as
tax agent and self-prepare. The people in Australia needed to lodge tax return after the end of
the financial year, so that people are using two ways to lodge the tax, the first one that they can
keep a tax agent or they can self-prepare. The study is based on the analysis of lodge tax return
after the end of the financial year. The data was selected for the 1000 people from the Australia
taxation office, it includes the information of gender, age group of people, lodgment method,
total income amount in a financial year and the total deduction amount as tax return in a
financial year.
b. The classification of dataset depends on the types on dataset, the types of datasets can be
defined in two categories as Primary data and the secondary data. The primary data collected
for a specific purpose from the relative population by using a questionnaire. The Secondary data
collected from internet resources for some other purpose. The dataset 1 is a taken from
Australian taxation office which is an internet resource without doing any survey or a specific
purpose, thus it can be considered as a secondary data type. (Thomas, 2011).
The data can be represented in numeric or text form which have 2 or more than 2 categories,
the categories of the data may be represented as nominal or the ordinal level. (Maciejewski,
2011)
The description of the variables in the selected dataset are defined below,
The variable gender has been categorized into two categories, the categories are male and
female. Thus it have two categories which indicates variable gender is a nominal level variable.
The variable age_range holds constant values of age of people. Thus, it can be consider as a
quantitative variable.
The variable lodgment_method has been categorized into two categories of lodge as Tax agent
and Self prepare, Thus it have two categories which indicates variable gender is a nominal level
variable.
The variable tot_in_amt holds constant values of total income of a person in a financial year, so
it is a quantitative variable.
The variable tot_ded_amt holds constant values of total deduction amount of a person in a
financial year, so it is a quantitative variable.
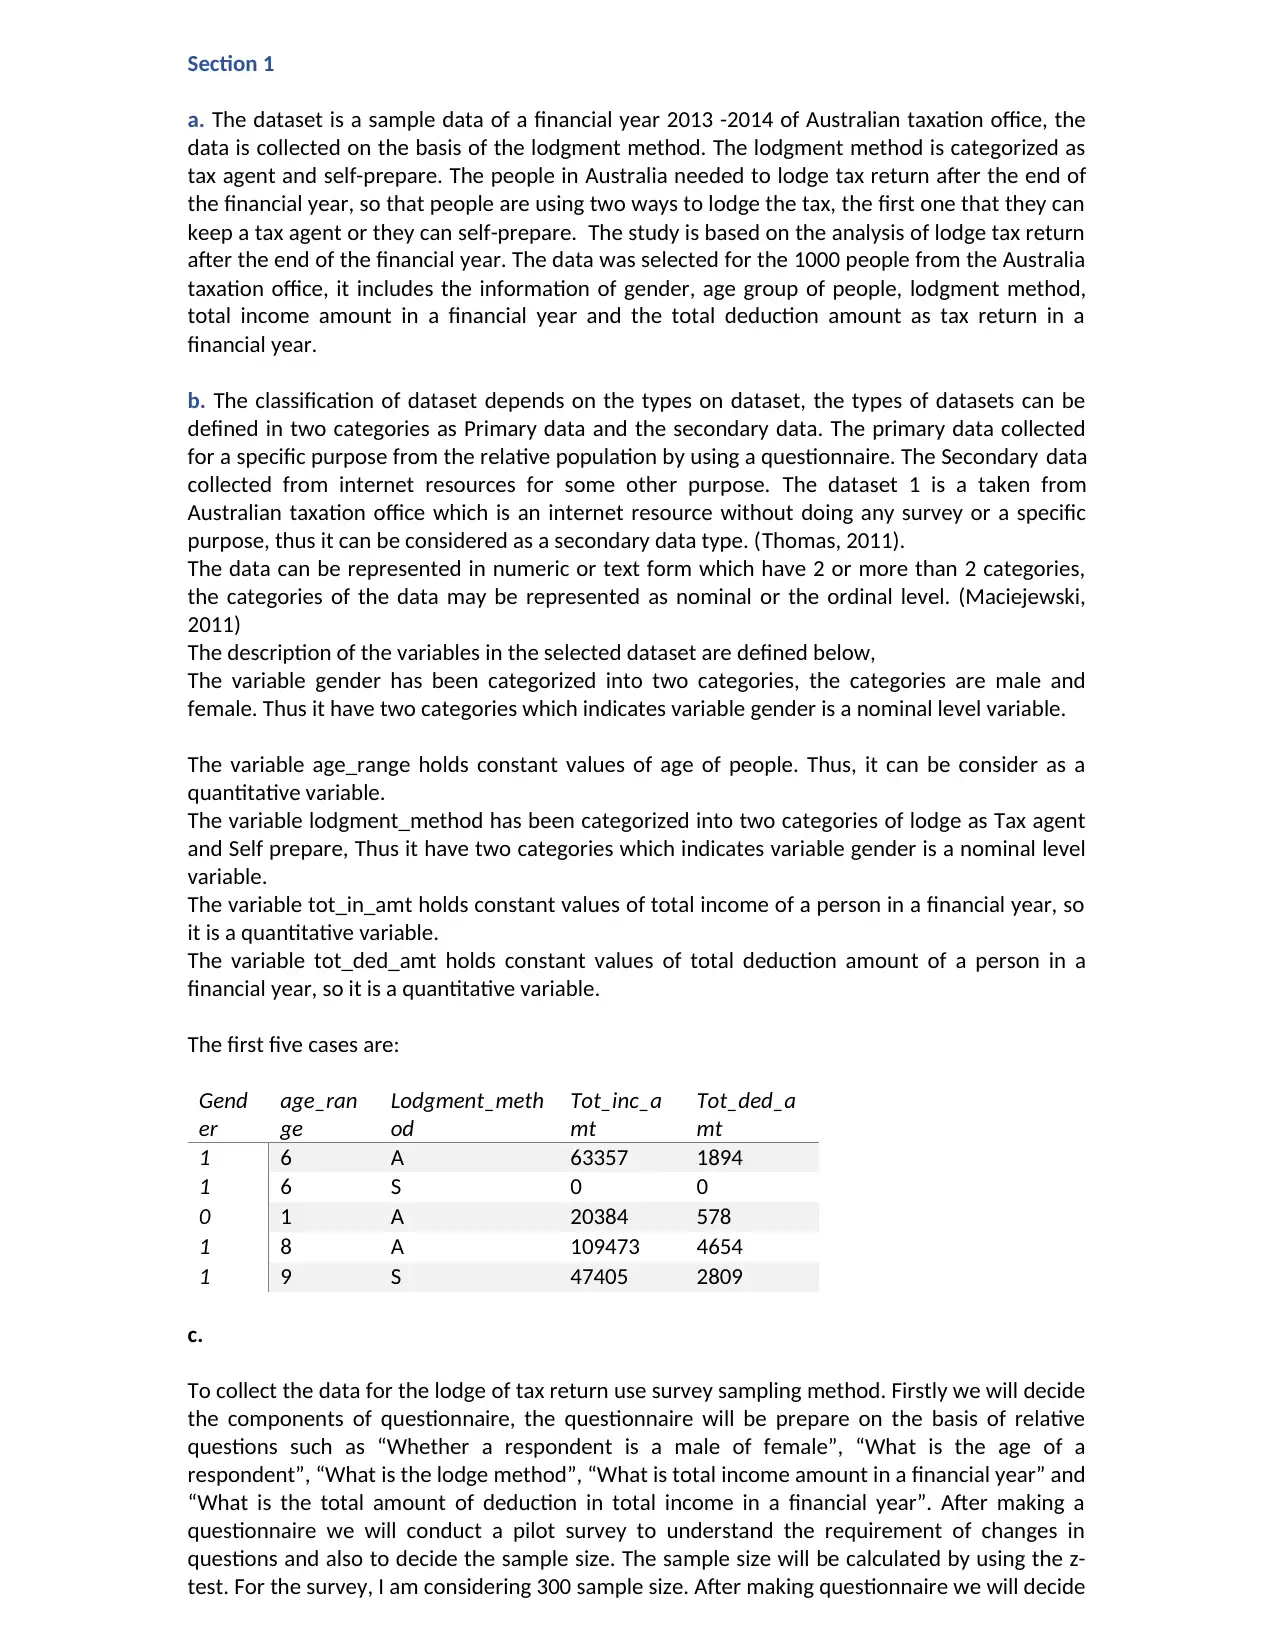
The first five cases are:
Gend
er
age_ran
ge
Lodgment_meth
od
Tot_inc_a
mt
Tot_ded_a
mt
1 6 A 63357 1894
1 6 S 0 0
0 1 A 20384 578
1 8 A 109473 4654
1 9 S 47405 2809
c.
To collect the data for the lodge of tax return use survey sampling method. Firstly we will decide
the components of questionnaire, the questionnaire will be prepare on the basis of relative
questions such as “Whether a respondent is a male of female”, “What is the age of a
respondent”, “What is the lodge method”, “What is total income amount in a financial year” and
“What is the total amount of deduction in total income in a financial year”. After making a
questionnaire we will conduct a pilot survey to understand the requirement of changes in
questions and also to decide the sample size. The sample size will be calculated by using the z-
test. For the survey, I am considering 300 sample size. After making questionnaire we will decide
a. The dataset is a sample data of a financial year 2013 -2014 of Australian taxation office, the
data is collected on the basis of the lodgment method. The lodgment method is categorized as
tax agent and self-prepare. The people in Australia needed to lodge tax return after the end of
the financial year, so that people are using two ways to lodge the tax, the first one that they can
keep a tax agent or they can self-prepare. The study is based on the analysis of lodge tax return
after the end of the financial year. The data was selected for the 1000 people from the Australia
taxation office, it includes the information of gender, age group of people, lodgment method,
total income amount in a financial year and the total deduction amount as tax return in a
financial year.
b. The classification of dataset depends on the types on dataset, the types of datasets can be
defined in two categories as Primary data and the secondary data. The primary data collected
for a specific purpose from the relative population by using a questionnaire. The Secondary data
collected from internet resources for some other purpose. The dataset 1 is a taken from
Australian taxation office which is an internet resource without doing any survey or a specific
purpose, thus it can be considered as a secondary data type. (Thomas, 2011).
The data can be represented in numeric or text form which have 2 or more than 2 categories,
the categories of the data may be represented as nominal or the ordinal level. (Maciejewski,
2011)
The description of the variables in the selected dataset are defined below,
The variable gender has been categorized into two categories, the categories are male and
female. Thus it have two categories which indicates variable gender is a nominal level variable.
The variable age_range holds constant values of age of people. Thus, it can be consider as a
quantitative variable.
The variable lodgment_method has been categorized into two categories of lodge as Tax agent
and Self prepare, Thus it have two categories which indicates variable gender is a nominal level
variable.
The variable tot_in_amt holds constant values of total income of a person in a financial year, so
it is a quantitative variable.
The variable tot_ded_amt holds constant values of total deduction amount of a person in a
financial year, so it is a quantitative variable.
The first five cases are:
Gend
er
age_ran
ge
Lodgment_meth
od
Tot_inc_a
mt
Tot_ded_a
mt
1 6 A 63357 1894
1 6 S 0 0
0 1 A 20384 578
1 8 A 109473 4654
1 9 S 47405 2809
c.
To collect the data for the lodge of tax return use survey sampling method. Firstly we will decide
the components of questionnaire, the questionnaire will be prepare on the basis of relative
questions such as “Whether a respondent is a male of female”, “What is the age of a
respondent”, “What is the lodge method”, “What is total income amount in a financial year” and
“What is the total amount of deduction in total income in a financial year”. After making a
questionnaire we will conduct a pilot survey to understand the requirement of changes in
questions and also to decide the sample size. The sample size will be calculated by using the z-
test. For the survey, I am considering 300 sample size. After making questionnaire we will decide
Paraphrase This Document
Need a fresh take? Get an instant paraphrase of this document with our AI Paraphraser
the place (relevant population) for the survey, so that sample will not be biased and will be a
representative of the population. We can use two methods to collect the data, first one is online
survey and second one is off line survey. I am using offline survey method, so that respondent
can easily understand the requirement of the questionnaire. (Ian, 2008)
The data is collected by using a survey method with a specific purpose, so it is a primary data
type.
The variables are defined below,
The variable gender has been categorized into two categories, the categories are male and
female. Thus it is a nominal level variable.
The variable age_range holds constant values of age of people. Thus, it can be consider as a
quantitative variable.
The variable lodgment_method has been categorized into two categories of lodge as Tax agent
and Self prepare, thus it is a nominal level variable.
The variable tot_in_amt holds constant values of total income of a person in a financial year, so
it is a quantitative variable.
The variable tot_ded_amt holds constant values of total deduction amount of a person in a
financial year, so it is a quantitative variable.
Section 2
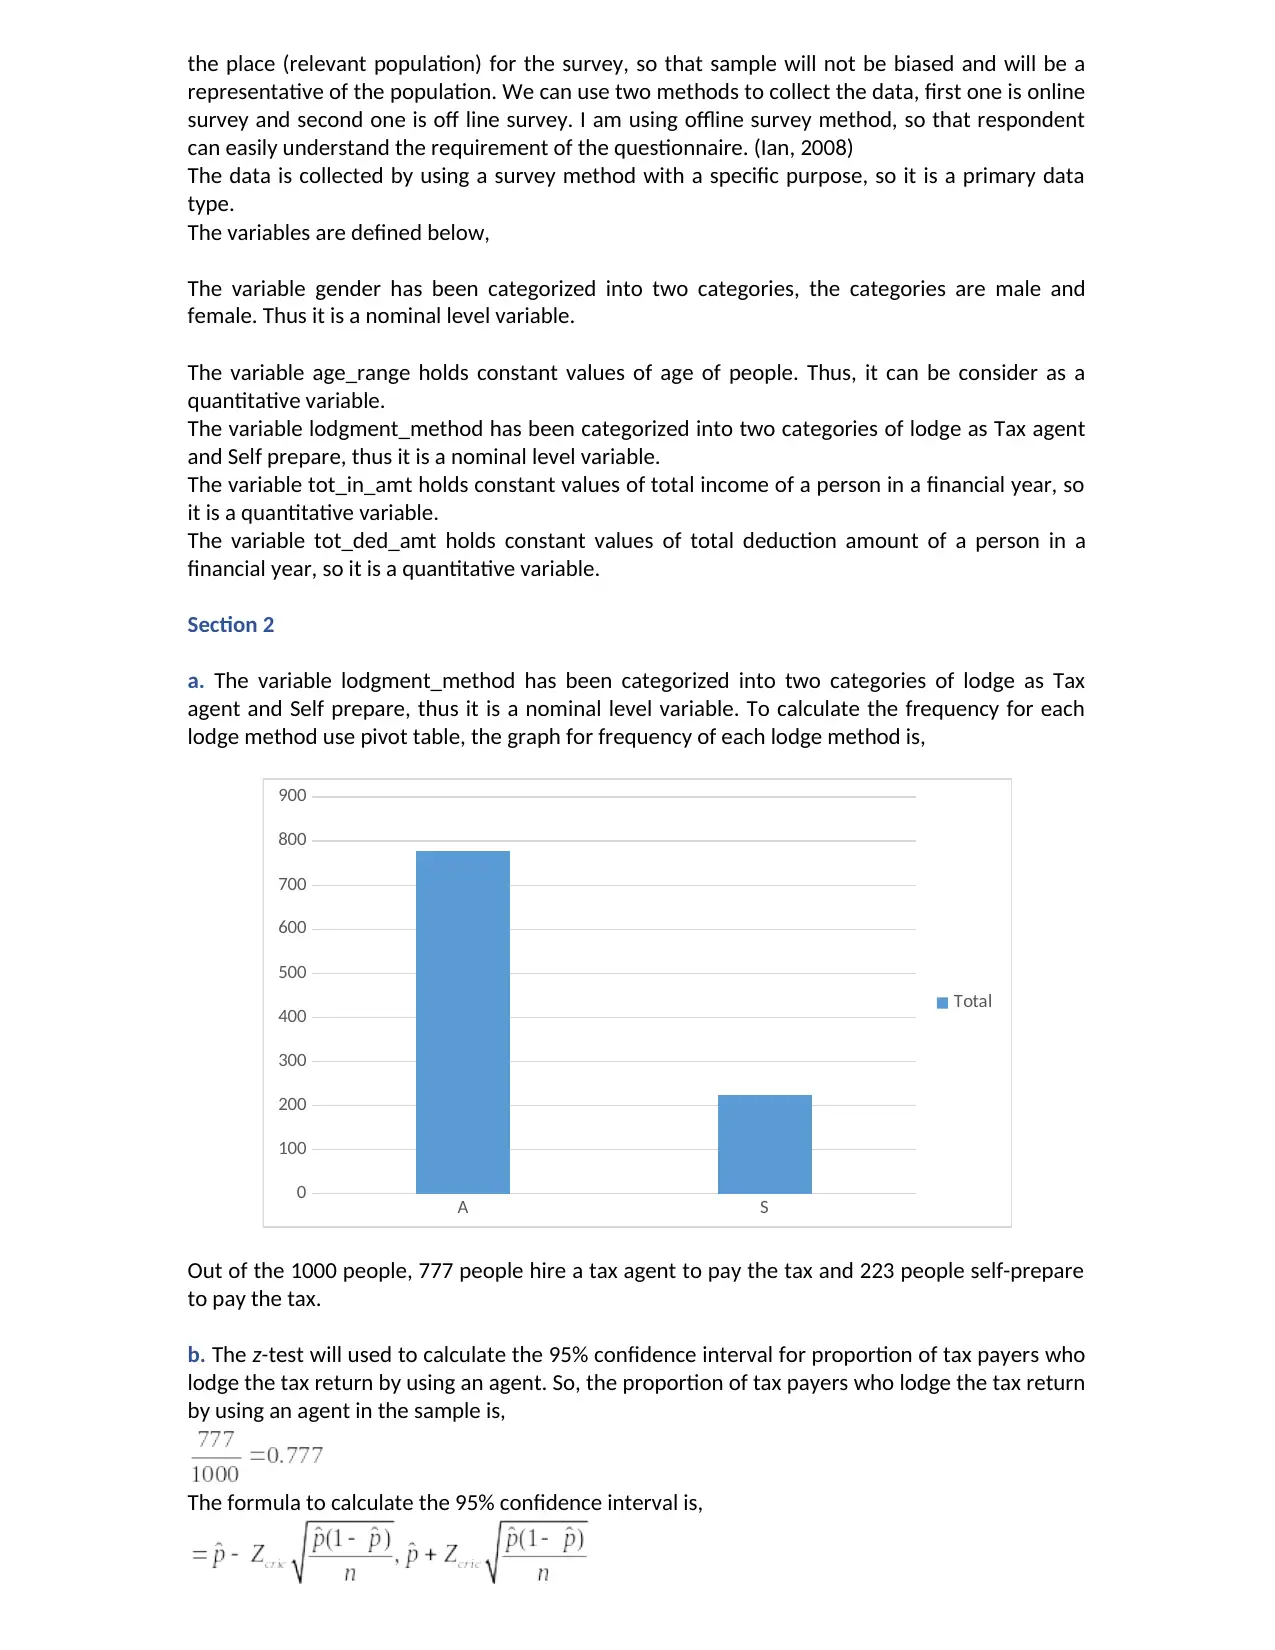
a. The variable lodgment_method has been categorized into two categories of lodge as Tax
agent and Self prepare, thus it is a nominal level variable. To calculate the frequency for each
lodge method use pivot table, the graph for frequency of each lodge method is,
A S
0
100
200
300
400
500
600
700
800
900
Total
Out of the 1000 people, 777 people hire a tax agent to pay the tax and 223 people self-prepare
to pay the tax.
b. The z-test will used to calculate the 95% confidence interval for proportion of tax payers who
lodge the tax return by using an agent. So, the proportion of tax payers who lodge the tax return
by using an agent in the sample is,
The formula to calculate the 95% confidence interval is,
representative of the population. We can use two methods to collect the data, first one is online
survey and second one is off line survey. I am using offline survey method, so that respondent
can easily understand the requirement of the questionnaire. (Ian, 2008)
The data is collected by using a survey method with a specific purpose, so it is a primary data
type.
The variables are defined below,
The variable gender has been categorized into two categories, the categories are male and
female. Thus it is a nominal level variable.
The variable age_range holds constant values of age of people. Thus, it can be consider as a
quantitative variable.
The variable lodgment_method has been categorized into two categories of lodge as Tax agent
and Self prepare, thus it is a nominal level variable.
The variable tot_in_amt holds constant values of total income of a person in a financial year, so
it is a quantitative variable.
The variable tot_ded_amt holds constant values of total deduction amount of a person in a
financial year, so it is a quantitative variable.
Section 2
a. The variable lodgment_method has been categorized into two categories of lodge as Tax
agent and Self prepare, thus it is a nominal level variable. To calculate the frequency for each
lodge method use pivot table, the graph for frequency of each lodge method is,
A S
0
100
200
300
400
500
600
700
800
900
Total
Out of the 1000 people, 777 people hire a tax agent to pay the tax and 223 people self-prepare
to pay the tax.
b. The z-test will used to calculate the 95% confidence interval for proportion of tax payers who
lodge the tax return by using an agent. So, the proportion of tax payers who lodge the tax return
by using an agent in the sample is,
The formula to calculate the 95% confidence interval is,
The critical value is 1.96. So,
c. The 95% confidence interval is (0.7512, 0.8028). The lower limit is 0.751 and the upper limit is
0.8028.
Section 3
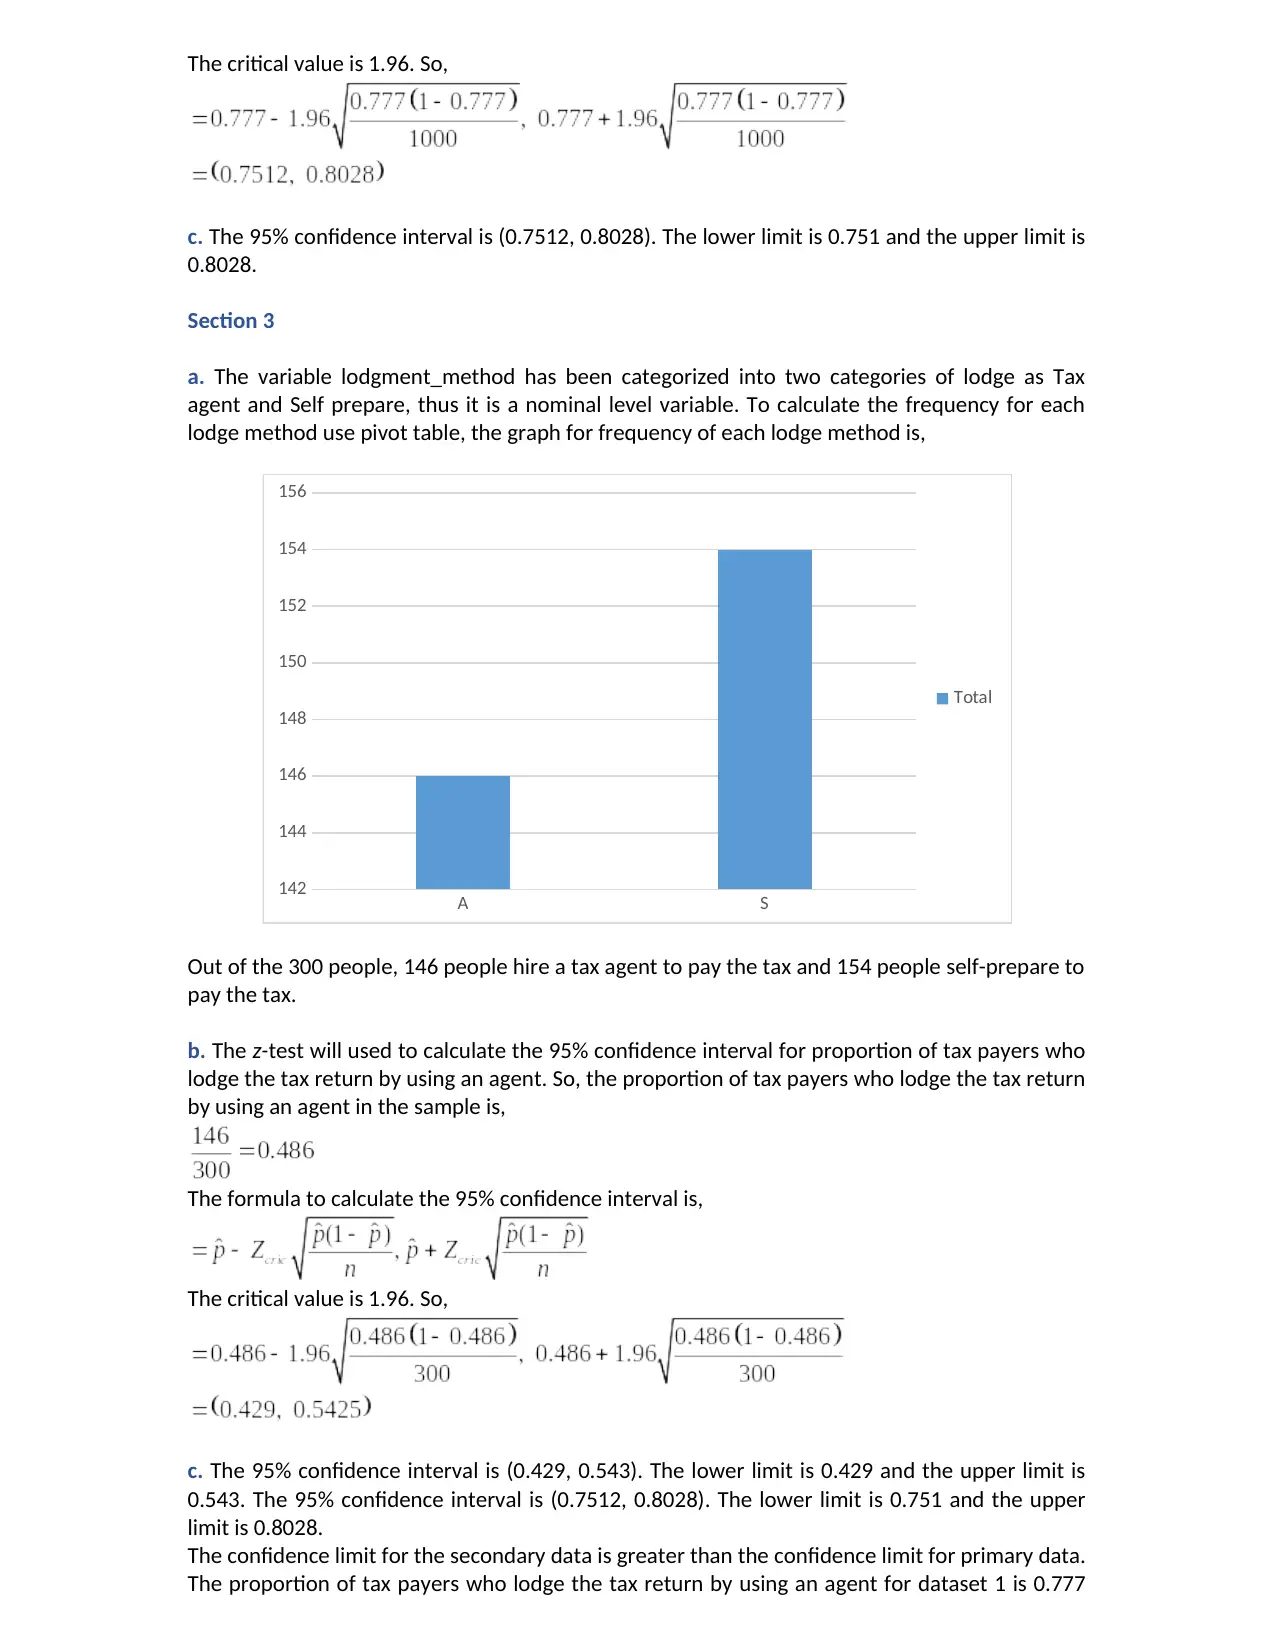
a. The variable lodgment_method has been categorized into two categories of lodge as Tax
agent and Self prepare, thus it is a nominal level variable. To calculate the frequency for each
lodge method use pivot table, the graph for frequency of each lodge method is,
A S
142
144
146
148
150
152
154
156
Total
Out of the 300 people, 146 people hire a tax agent to pay the tax and 154 people self-prepare to
pay the tax.
b. The z-test will used to calculate the 95% confidence interval for proportion of tax payers who
lodge the tax return by using an agent. So, the proportion of tax payers who lodge the tax return
by using an agent in the sample is,
The formula to calculate the 95% confidence interval is,
The critical value is 1.96. So,
c. The 95% confidence interval is (0.429, 0.543). The lower limit is 0.429 and the upper limit is
0.543. The 95% confidence interval is (0.7512, 0.8028). The lower limit is 0.751 and the upper
limit is 0.8028.
The confidence limit for the secondary data is greater than the confidence limit for primary data.
The proportion of tax payers who lodge the tax return by using an agent for dataset 1 is 0.777
c. The 95% confidence interval is (0.7512, 0.8028). The lower limit is 0.751 and the upper limit is
0.8028.
Section 3
a. The variable lodgment_method has been categorized into two categories of lodge as Tax
agent and Self prepare, thus it is a nominal level variable. To calculate the frequency for each
lodge method use pivot table, the graph for frequency of each lodge method is,
A S
142
144
146
148
150
152
154
156
Total
Out of the 300 people, 146 people hire a tax agent to pay the tax and 154 people self-prepare to
pay the tax.
b. The z-test will used to calculate the 95% confidence interval for proportion of tax payers who
lodge the tax return by using an agent. So, the proportion of tax payers who lodge the tax return
by using an agent in the sample is,
The formula to calculate the 95% confidence interval is,
The critical value is 1.96. So,
c. The 95% confidence interval is (0.429, 0.543). The lower limit is 0.429 and the upper limit is
0.543. The 95% confidence interval is (0.7512, 0.8028). The lower limit is 0.751 and the upper
limit is 0.8028.
The confidence limit for the secondary data is greater than the confidence limit for primary data.
The proportion of tax payers who lodge the tax return by using an agent for dataset 1 is 0.777
⊘ This is a preview!⊘
Do you want full access?
Subscribe today to unlock all pages.
Trusted by 1+ million students worldwide
and the proportion of tax payers who lodge the tax return by using an agent for the data set 2 is
0.486.
Section 4
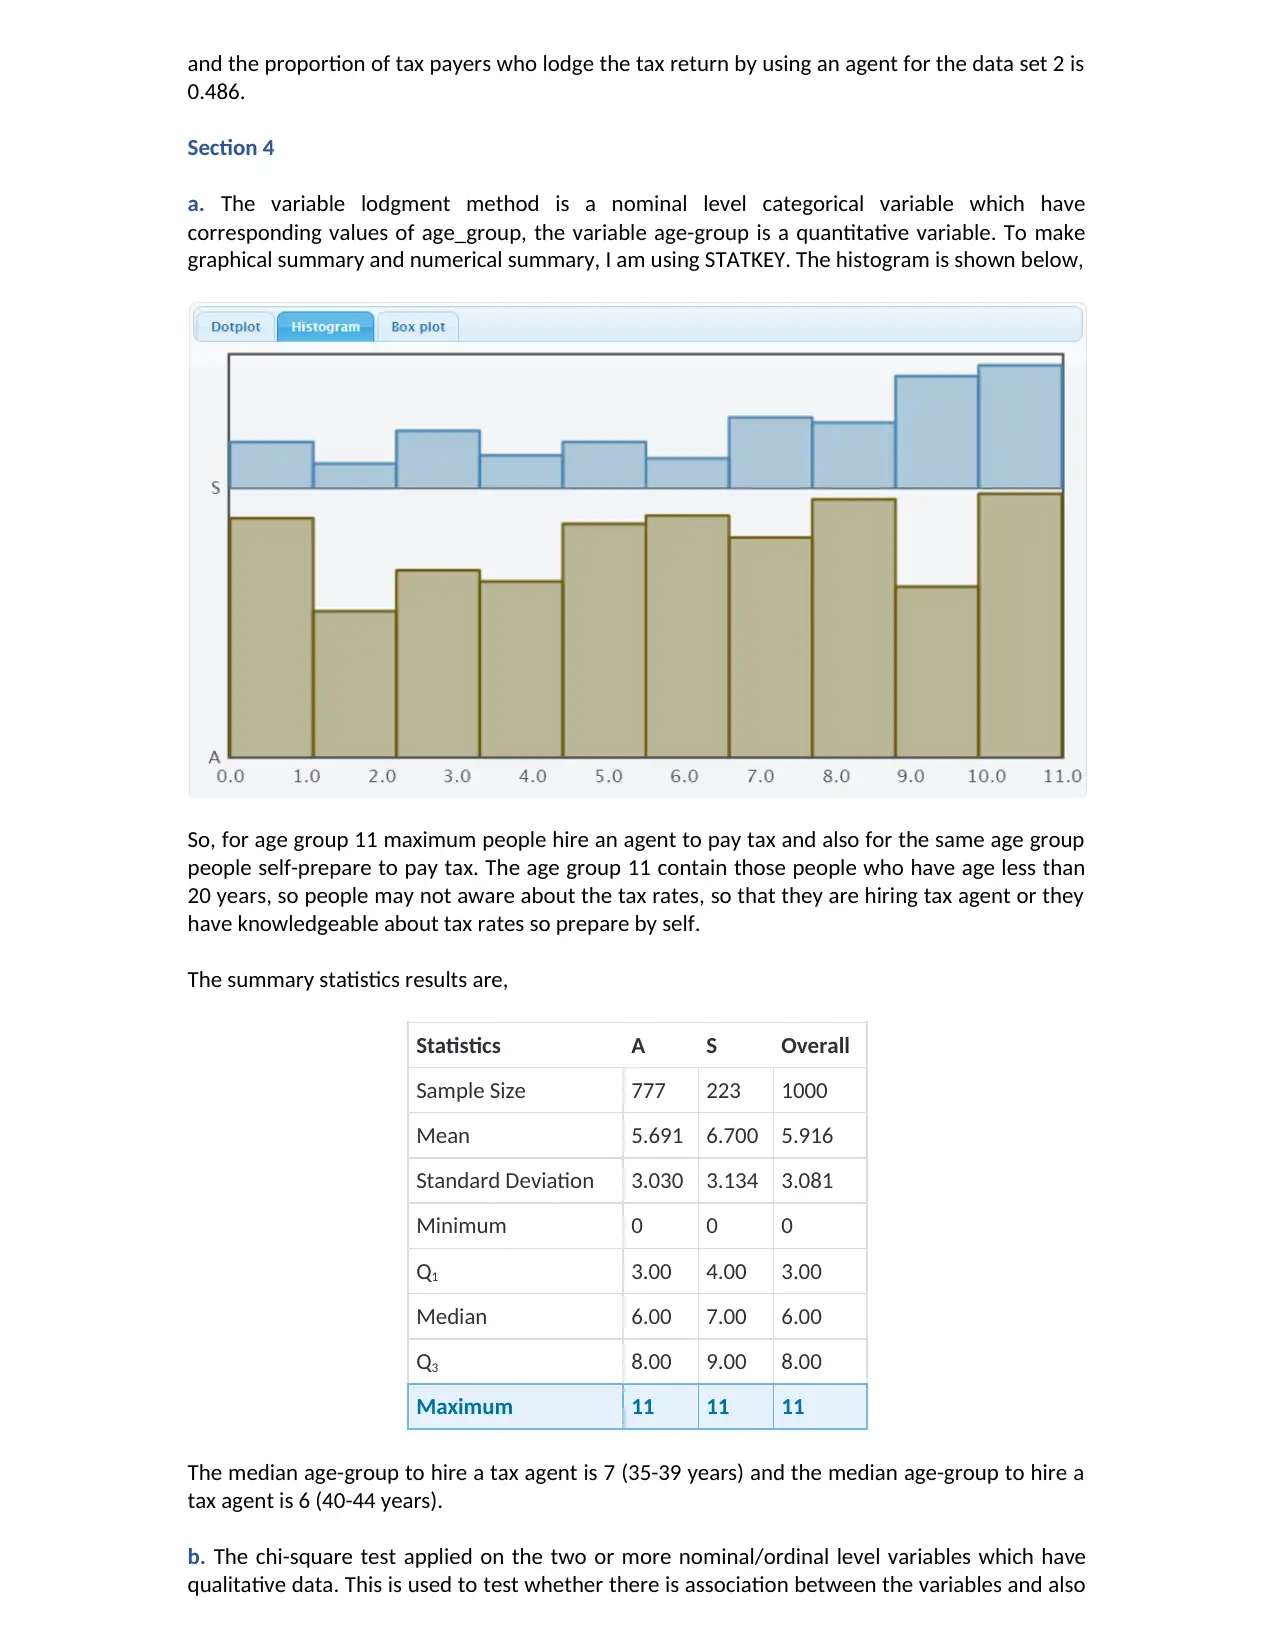
a. The variable lodgment method is a nominal level categorical variable which have
corresponding values of age_group, the variable age-group is a quantitative variable. To make
graphical summary and numerical summary, I am using STATKEY. The histogram is shown below,
So, for age group 11 maximum people hire an agent to pay tax and also for the same age group
people self-prepare to pay tax. The age group 11 contain those people who have age less than
20 years, so people may not aware about the tax rates, so that they are hiring tax agent or they
have knowledgeable about tax rates so prepare by self.
The summary statistics results are,
Statistics A S Overall
Sample Size 777 223 1000
Mean 5.691 6.700 5.916
Standard Deviation 3.030 3.134 3.081
Minimum 0 0 0
Q1 3.00 4.00 3.00
Median 6.00 7.00 6.00
Q3 8.00 9.00 8.00
Maximum 11 11 11
The median age-group to hire a tax agent is 7 (35-39 years) and the median age-group to hire a
tax agent is 6 (40-44 years).
b. The chi-square test applied on the two or more nominal/ordinal level variables which have
qualitative data. This is used to test whether there is association between the variables and also
0.486.
Section 4
a. The variable lodgment method is a nominal level categorical variable which have
corresponding values of age_group, the variable age-group is a quantitative variable. To make
graphical summary and numerical summary, I am using STATKEY. The histogram is shown below,
So, for age group 11 maximum people hire an agent to pay tax and also for the same age group
people self-prepare to pay tax. The age group 11 contain those people who have age less than
20 years, so people may not aware about the tax rates, so that they are hiring tax agent or they
have knowledgeable about tax rates so prepare by self.
The summary statistics results are,
Statistics A S Overall
Sample Size 777 223 1000
Mean 5.691 6.700 5.916
Standard Deviation 3.030 3.134 3.081
Minimum 0 0 0
Q1 3.00 4.00 3.00
Median 6.00 7.00 6.00
Q3 8.00 9.00 8.00
Maximum 11 11 11
The median age-group to hire a tax agent is 7 (35-39 years) and the median age-group to hire a
tax agent is 6 (40-44 years).
b. The chi-square test applied on the two or more nominal/ordinal level variables which have
qualitative data. This is used to test whether there is association between the variables and also
Paraphrase This Document
Need a fresh take? Get an instant paraphrase of this document with our AI Paraphraser
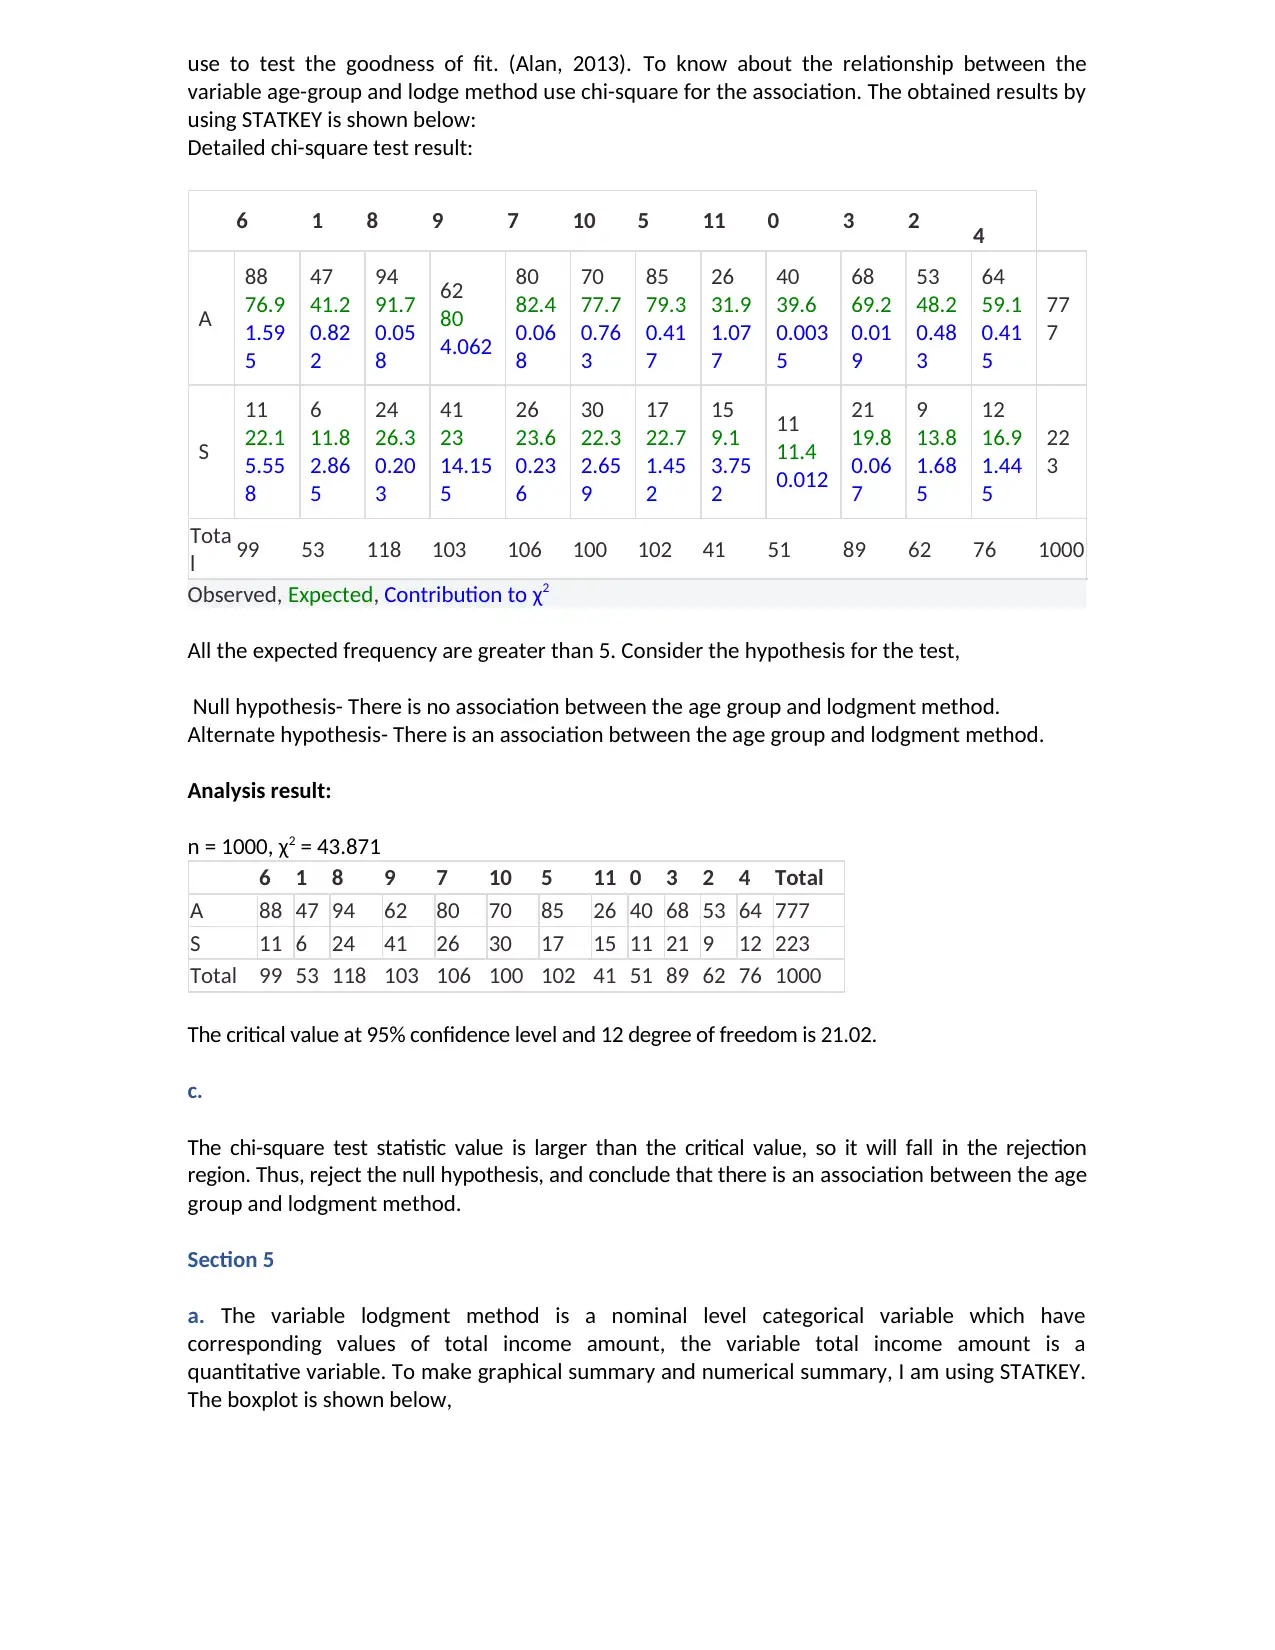
use to test the goodness of fit. (Alan, 2013). To know about the relationship between the
variable age-group and lodge method use chi-square for the association. The obtained results by
using STATKEY is shown below:
Detailed chi-square test result:
6 1 8 9 7 10 5 11 0 3 2 4
A
88
76.9
1.59
5
47
41.2
0.82
2
94
91.7
0.05
8
62
80
4.062
80
82.4
0.06
8
70
77.7
0.76
3
85
79.3
0.41
7
26
31.9
1.07
7
40
39.6
0.003
5
68
69.2
0.01
9
53
48.2
0.48
3
64
59.1
0.41
5
77
7
S
11
22.1
5.55
8
6
11.8
2.86
5
24
26.3
0.20
3
41
23
14.15
5
26
23.6
0.23
6
30
22.3
2.65
9
17
22.7
1.45
2
15
9.1
3.75
2
11
11.4
0.012
21
19.8
0.06
7
9
13.8
1.68
5
12
16.9
1.44
5
22
3
Tota
l 99 53 118 103 106 100 102 41 51 89 62 76 1000
Observed, Expected, Contribution to χ2
All the expected frequency are greater than 5. Consider the hypothesis for the test,
Null hypothesis- There is no association between the age group and lodgment method.
Alternate hypothesis- There is an association between the age group and lodgment method.
Analysis result:
n = 1000, χ2 = 43.871
6 1 8 9 7 10 5 11 0 3 2 4 Total
A 88 47 94 62 80 70 85 26 40 68 53 64 777
S 11 6 24 41 26 30 17 15 11 21 9 12 223
Total 99 53 118 103 106 100 102 41 51 89 62 76 1000
The critical value at 95% confidence level and 12 degree of freedom is 21.02.
c.
The chi-square test statistic value is larger than the critical value, so it will fall in the rejection
region. Thus, reject the null hypothesis, and conclude that there is an association between the age
group and lodgment method.
Section 5
a. The variable lodgment method is a nominal level categorical variable which have
corresponding values of total income amount, the variable total income amount is a
quantitative variable. To make graphical summary and numerical summary, I am using STATKEY.
The boxplot is shown below,
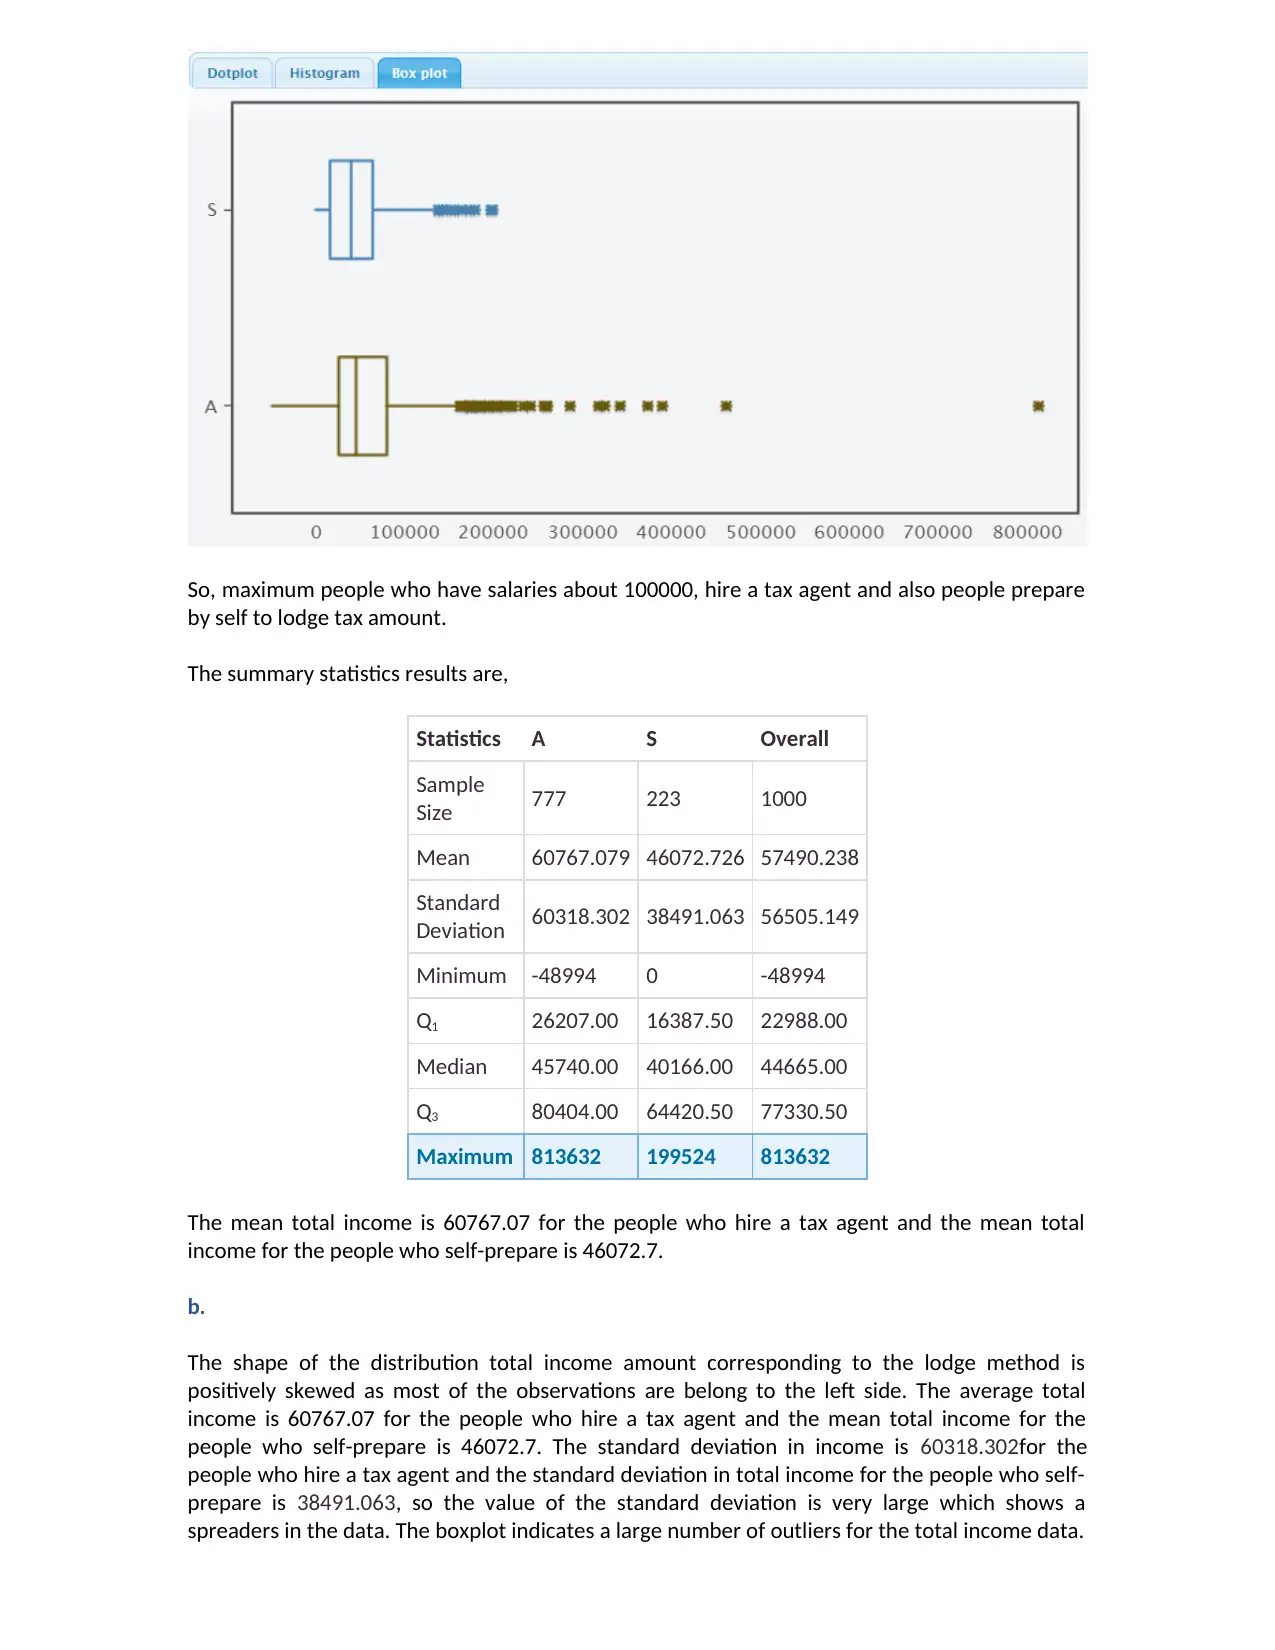
So, maximum people who have salaries about 100000, hire a tax agent and also people prepare
by self to lodge tax amount.
The summary statistics results are,
Statistics A S Overall
Sample
Size 777 223 1000
Mean 60767.079 46072.726 57490.238
Standard
Deviation 60318.302 38491.063 56505.149
Minimum -48994 0 -48994
Q1 26207.00 16387.50 22988.00
Median 45740.00 40166.00 44665.00
Q3 80404.00 64420.50 77330.50
Maximum 813632 199524 813632
The mean total income is 60767.07 for the people who hire a tax agent and the mean total
income for the people who self-prepare is 46072.7.
b.
The shape of the distribution total income amount corresponding to the lodge method is
positively skewed as most of the observations are belong to the left side. The average total
income is 60767.07 for the people who hire a tax agent and the mean total income for the
people who self-prepare is 46072.7. The standard deviation in income is 60318.302for the
people who hire a tax agent and the standard deviation in total income for the people who self-
prepare is 38491.063, so the value of the standard deviation is very large which shows a
spreaders in the data. The boxplot indicates a large number of outliers for the total income data.
⊘ This is a preview!⊘
Do you want full access?
Subscribe today to unlock all pages.
Trusted by 1+ million students worldwide
Section 6
a.
The Pearson correlation (Association test) test applied to test whether there is a relationship in
the population. It is applied on the quantitative samples, the two variables should be measured
in the interval or ratio level. The results of the test indicates whether the population correlation
coefficient is 0 or not. (Gravetter & Wallnau, 2010)
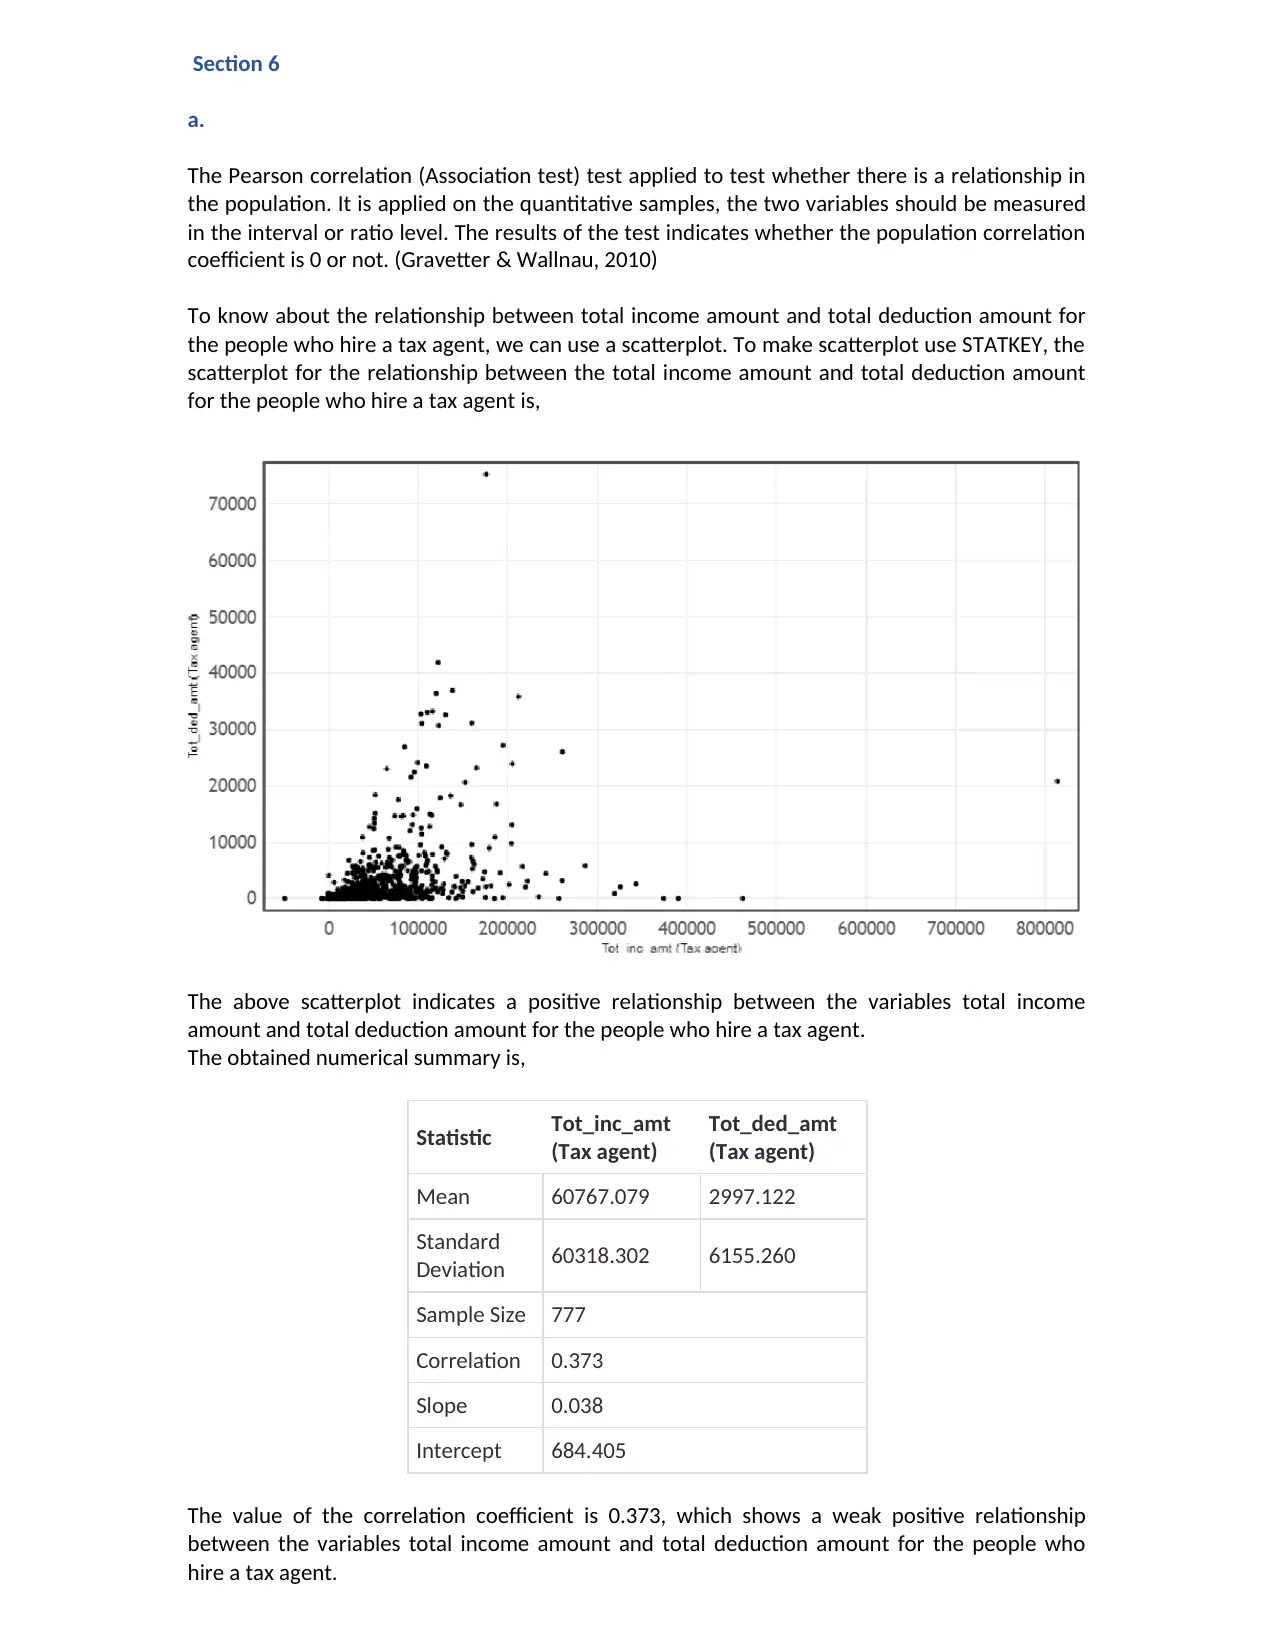
To know about the relationship between total income amount and total deduction amount for
the people who hire a tax agent, we can use a scatterplot. To make scatterplot use STATKEY, the
scatterplot for the relationship between the total income amount and total deduction amount
for the people who hire a tax agent is,
The above scatterplot indicates a positive relationship between the variables total income
amount and total deduction amount for the people who hire a tax agent.
The obtained numerical summary is,
Statistic Tot_inc_amt
(Tax agent)
Tot_ded_amt
(Tax agent)
Mean 60767.079 2997.122
Standard
Deviation 60318.302 6155.260
Sample Size 777
Correlation 0.373
Slope 0.038
Intercept 684.405
The value of the correlation coefficient is 0.373, which shows a weak positive relationship
between the variables total income amount and total deduction amount for the people who
hire a tax agent.
a.
The Pearson correlation (Association test) test applied to test whether there is a relationship in
the population. It is applied on the quantitative samples, the two variables should be measured
in the interval or ratio level. The results of the test indicates whether the population correlation
coefficient is 0 or not. (Gravetter & Wallnau, 2010)
To know about the relationship between total income amount and total deduction amount for
the people who hire a tax agent, we can use a scatterplot. To make scatterplot use STATKEY, the
scatterplot for the relationship between the total income amount and total deduction amount
for the people who hire a tax agent is,
The above scatterplot indicates a positive relationship between the variables total income
amount and total deduction amount for the people who hire a tax agent.
The obtained numerical summary is,
Statistic Tot_inc_amt
(Tax agent)
Tot_ded_amt
(Tax agent)
Mean 60767.079 2997.122
Standard
Deviation 60318.302 6155.260
Sample Size 777
Correlation 0.373
Slope 0.038
Intercept 684.405
The value of the correlation coefficient is 0.373, which shows a weak positive relationship
between the variables total income amount and total deduction amount for the people who
hire a tax agent.
Paraphrase This Document
Need a fresh take? Get an instant paraphrase of this document with our AI Paraphraser
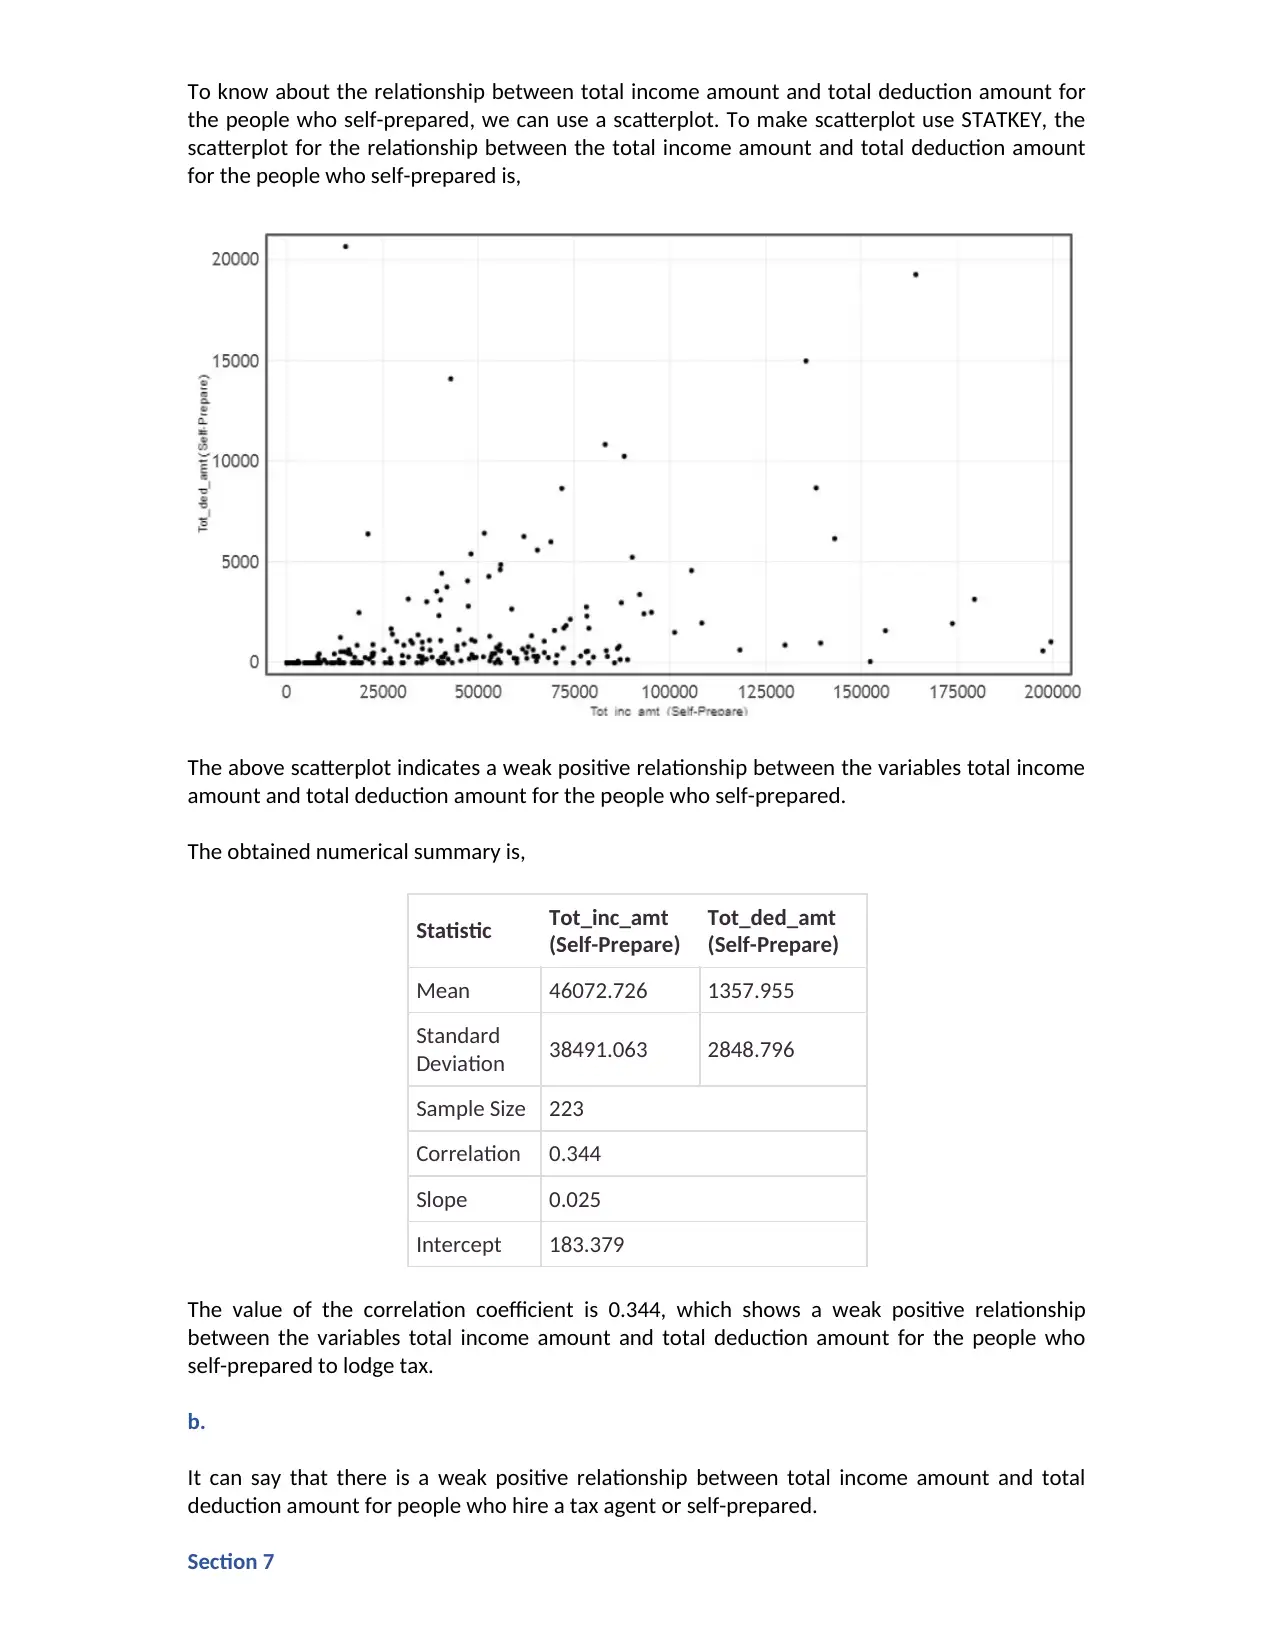
To know about the relationship between total income amount and total deduction amount for
the people who self-prepared, we can use a scatterplot. To make scatterplot use STATKEY, the
scatterplot for the relationship between the total income amount and total deduction amount
for the people who self-prepared is,
The above scatterplot indicates a weak positive relationship between the variables total income
amount and total deduction amount for the people who self-prepared.
The obtained numerical summary is,
Statistic Tot_inc_amt
(Self-Prepare)
Tot_ded_amt
(Self-Prepare)
Mean 46072.726 1357.955
Standard
Deviation 38491.063 2848.796
Sample Size 223
Correlation 0.344
Slope 0.025
Intercept 183.379
The value of the correlation coefficient is 0.344, which shows a weak positive relationship
between the variables total income amount and total deduction amount for the people who
self-prepared to lodge tax.
b.
It can say that there is a weak positive relationship between total income amount and total
deduction amount for people who hire a tax agent or self-prepared.
Section 7
a.
Out of the 1000 people in the dataset-1, 777 people hire a tax agent to pay the tax and 223
people self-prepare to pay the tax, and Out of the 300 people in the dataset-2, 146 people hire a
tax agent to pay the tax and 154 people self-prepare to pay the tax.
The 95% confidence interval is (0.429, 0.543). The lower limit is 0.429 and the upper limit is
0.543. The 95% confidence interval is (0.7512, 0.8028). The lower limit is 0.751 and the upper
limit is 0.8028. The confidence limit for the secondary data is greater than the confidence limit
for primary data. The proportion of tax payers who lodge the tax return by using an agent for
dataset 1 is 0.777 and the proportion of tax payers who lodge the tax return by using an agent
for the data set 2 is 0.486. The age group 11 contain those people who have age less than 20
years, so people may not aware about the tax rates, so that they are hiring tax agent or they
have knowledgeable about tax rates so prepare by self. The chi-square test statistic indicates that
there is an association between the age group and lodgment method. The mean total income is
60767.07 for the people who hire a tax agent and the mean total income for the people who
self-prepare is 46072.7.
The shape of the distribution total income amount corresponding to the lodge method is
positively skewed as most of the observations are belong to the left side. The average total
income is 60767.07 for the people who hire a tax agent and the mean total income for the
people who self-prepare is 46072.7. The standard deviation in income is 60318.302 for the
people who hire a tax agent and the standard deviation in total income for the people who self-
prepare is 38491.063, so the value of the standard deviation is very large which shows a
spreaders in the data. The boxplot indicates a large number of outliers for the total income data.
. There is a weak positive relationship between total income amount and total deduction
amount for people who hire a tax agent or self-prepared.
b.
The shape of the distribution total income amount corresponding to the lodge method is
positively skewed as most of the observations are belong to the left side. Thus, data may not be
collected accurately or the level of measurements may not be justified according to the
questions. There is a possibility non-distributed data for income amount. Thus, for the further
research researcher should make an appropriate questionnaire, so that people should provide
correct information about the total income and total deduction amount as a tax in a financial
year.
References
Alan, A. (2013). Categorical Data Analysis. John Wiley & Sons.
Ian, B. (2008). Questionnaire Design: How to Plan, Structure and Write Survey Material for
Effective Market Research. Kogan Page publishers.
Gravetter F. & Wallnau. L. (2010). Essentials of Statistics for the Behavioral Sciences. Cengage
Learning.
Maciejewski, R. (2011). Data Representations, Transformations and Statistics for Visual
Reasoning. Morgan & Claypool Publishers.
Thomas, P.V. (2011). Secondary Data Analysis. Oxford university press.
⊘ This is a preview!⊘
Do you want full access?
Subscribe today to unlock all pages.
Trusted by 1+ million students worldwide
1 out of 9
Related Documents


Your All-in-One AI-Powered Toolkit for Academic Success.
+13062052269
info@desklib.com
Available 24*7 on WhatsApp / Email
![[object Object]](/_next/static/media/star-bottom.7253800d.svg)
Unlock your academic potential
Copyright © 2020–2026 A2Z Services. All Rights Reserved. Developed and managed by ZUCOL.