Analysis of Chicago Crime Data (2012-2016) Using Real-Time Analytics

Verified

Added on  2023/06/06

|29
|1588
|118
Report
AI Summary
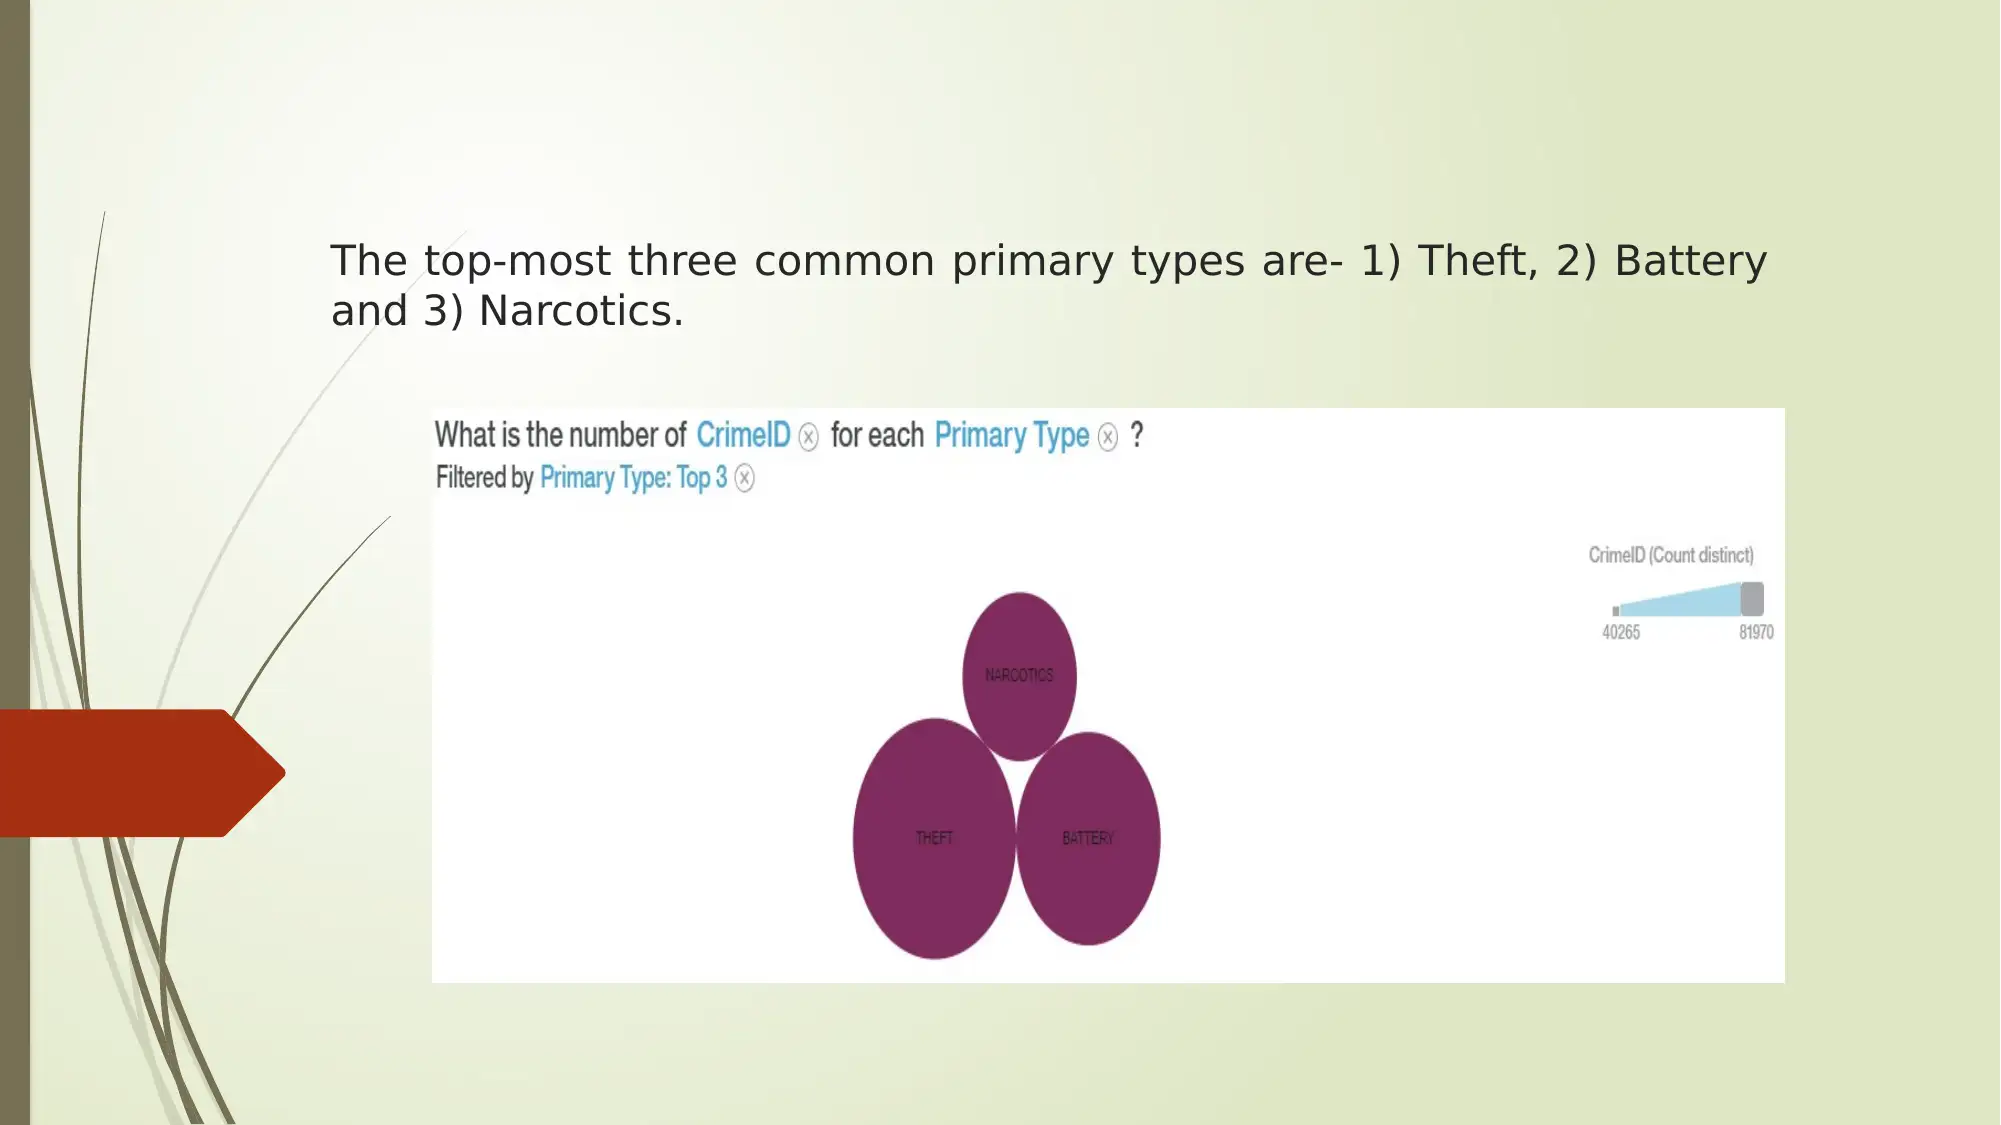
This report provides an analysis of Chicago crime data from 2012 to 2016 using real-time analytics. The data, sourced from the Chicago Police Department's CLEAR system, includes reported crime incidents (excluding murders) categorized by location blocks to protect victim privacy. The analysis identifies crime trends, high-crime locations, and common crime types, offering insights for law enforcement and non-profit organizations. Key findings include the prevalence of theft, battery, and narcotics offenses, with streets and residences being the most vulnerable locations. The report also highlights the districts with the highest and lowest crime rates, the busiest days for crime, and trends in domestic violence. Recommendations are made to the Police Chief based on these insights, emphasizing stricter measures for theft, increased vigilance in high-crime areas, and enhanced arrest rates. The research reflects on the challenges of analyzing large datasets and organizing findings to provide actionable solutions for crime reduction in Chicago.
Document Page
Real Time Analytics
- Analysis of Chicago Crime Data
tabler-icon-diamond-filled.svg

Paraphrase This Document

Need a fresh take? Get an instant paraphrase of this document with our AI Paraphraser
Document Page
Introduction:
The undertaken data set reflects the reports of incidents of crime (except
murders) happened in Chicago city from 2012 to 2016.
The data set is gathered from the Chicago Law Enforcement Analysis and
Reporting (CLEAR) of Chicago Police department.
To protect the privacy of crime victims, the crime incidents are gathered as
per the specific locations as per block levels.
The weekend bloodshed of Chicago is not at all new and police is trying to
control the crime by various kinds of steps. Shopping malls, markets,
streets, apartments and pavements are not at all safe in Chicago
irrespective of seasons or days of the week.
Presence of local gangs, availability of guns, domestic dissatisfaction and
anxiety, tendency to commit crimes, instant spread of contagions and
destructive nature of racism are the significant causes of high rate of
crimes in Chicago.
Document Page
Aim and Target Audience:
The main aim of the research report is to provide the variety and interests
insights in the lights of the crime survey data. Also, it would like to develop
the proper measures to control crimes.
The target audience of the IBM analytical report are mainly non-profit
organizations and the middle as well as top management of the law
enforcement agency.
Document Page
Research Reporting:
The analysis has been done with the help of the IBM Watson software.
The interpretation refers crime rates and scenarios in Chicago in the
contemporary period.
The representation in the contemporary period is one of the primary and
most useful methods used for the purpose of visual representation of
large data and trends.
Taking this into consideration, this form of analysis and interpretation
has been used for the concerned study.
tabler-icon-diamond-filled.svg

Paraphrase This Document

Need a fresh take? Get an instant paraphrase of this document with our AI Paraphraser
Document Page
The total number of reported crime is 361741 in Chicago during the tenure
of survey.
Document Page
32 kinds of different primary crimes were reported in this survey.
Document Page
The top 21 location descriptions with respect to crimes are- 1) Street, 2) Residence, 3)
Apartment, 4) Sidewalk, 5) Other, 6) Parking lot/ Garage (Non-residential), 7) Alley, 8)
Residential yard (Front/Back), 9) School, Public and Building, 10) Small Retail Store, 11)
Residence Porch/Hallway, 12) Vehicle Non-commercial, 13) Residence Garage, 14)
Restaurant, 15) Department store, 16) Grocery Food Store, 17) Gas Station, 18) Park
Property, 19) Bar or Tavern, 20) CTA Platform, 21) Commercial/Business office.
tabler-icon-diamond-filled.svg

Paraphrase This Document

Need a fresh take? Get an instant paraphrase of this document with our AI Paraphraser
Document Page
The least 10 location descriptions with respect to time are- 1) Yard, 2) Vehicle-Other Ride
Service, 3) CTA Tracks-Right of Way, 4) Airport Terminal Mezzanine - Non-Secure Area, 5)
Airport Transportation System (ATS), 6) Newsstand, 7) Savings and Loan, 8) Forest
Preserve, 9) Cemetery and 10) Delivery Truck.
Document Page
The top-most three common primary types are- 1) Theft, 2) Battery
and 3) Narcotics.
Document Page
The least three common primary types are- 1) Non-Criminal, 2) Human
Trafficking and 3) Non-criminal (Subject specified).
tabler-icon-diamond-filled.svg

Paraphrase This Document

Need a fresh take? Get an instant paraphrase of this document with our AI Paraphraser
Document Page
The number of years of ‘Years’ of reported crimes in this data file is 5
that are 2012, 2013, 2014, 2015 and 2016.
Document Page
The number of crimes reported in this data file in December are given as-
1) 2012 (10.84 K), 2) 2013 (9.84 K), 3) 2014 (8.6 K), 4) 2015 (19) and 5)
2016 (31).
chevron_up_icon
1 out of 29
circle_padding
hide_on_mobile
zoom_out_icon
[object Object]