Kingfisher Bay Housing Market: Price and Rental Analysis Report
VerifiedAdded on 2020/05/28
|15
|2963
|67
Report
AI Summary
This report provides an in-depth analysis of house prices and rental data in Kingfisher Bay, Melbourne. The analysis, conducted on a provided dataset, examines various factors influencing house prices, including house condition, suburb location, and proximity to amenities. The report addresses questions regarding average house prices, the impact of outliers and extreme values on average calculations, and the proportion of houses with high rental values. It explores the relationship between house prices and rental investments, analyzes the impact of suburb and house condition on prices, and investigates concerns raised by real estate agents regarding weekly rents in different suburbs. Statistical methods are used to test hypotheses and draw conclusions about the Kingfisher Bay housing market.
Running head: HOUSE PRICS IN KINGFISHER BAY
HOUSE PRICS IN KINGFISHER BAY
Name of Student
Name of the University
Author Note
HOUSE PRICS IN KINGFISHER BAY
Name of Student
Name of the University
Author Note
Paraphrase This Document
Need a fresh take? Get an instant paraphrase of this document with our AI Paraphraser
1HOUSE PRICS IN KINGFISHER BAY
Executive Summary:
This is an analysis on the survey data on house prices and rents of Kingfisher Bay in Melbourne.
Melbourne is recorded to experience a hike in the rental and the selling prices of properties. This
situation is expected to result from the lack of available properties for the purpose. Kingfisher
Bay is recorded as the most expensive city among all. This developed idea regarding the city is
to be analysis through a data set. The data are being collected on lots of points like the prices of
houses, the weekly rent of the houses, the present condition of the houses, distance of the houses
from railway stations, bus stands, shops and on lots of other criteria. Few questions are to
answered in the process of this analysis. Different criteria are compared and tested and recorded.
The test explains the dependency among the parameters and whether the ideas have to be
believed or not. The results are constructed, written and recorded. The answered are being
written in the letter in the body.
2HOUSE PRICS IN KINGFISHER BAY
Table of Contents
Houses in Kingfisher Bay:...............................................................................................................4
House prices vs. conditions/suburbs................................................................................................5
House prices vs. factors influencing house prices:..........................................................................7
Concerns raised by real estate agents and developers.....................................................................9
Future surveys:...............................................................................................................................10
References:....................................................................................................................................12
⊘ This is a preview!⊘
Do you want full access?
Subscribe today to unlock all pages.
Trusted by 1+ million students worldwide
3HOUSE PRICS IN KINGFISHER BAY
Date: 20th December 2017
To: Hannah Zhou, Director, Housing Affordability Division, Real Estate Institute
From: Sandy Stedwell, Manager, Research and Analysis, Real Estate Institute
Subject: Analysis of Kingfisher Bay’s housing and rental data
Dear Hannah,
I went through your letter. I understand that there is a significant increase in the house
and rental prices in Melbourne due to the lack of available rental properties. The city of
Kingfisher Bay is remarked as the most expensive area and the Kingfisher Bay council is
worried about it. They want a proper diagnosis regarding the matter.
I have analyzed the whole data set provided by you and formulated the answers for each
and every of your question. The answers are attached below. The answers are according to the
heading and the numbering of the questions.
Paraphrase This Document
Need a fresh take? Get an instant paraphrase of this document with our AI Paraphraser
4HOUSE PRICS IN KINGFISHER BAY
Houses in Kingfisher Bay:
(a) From the overall summary analysis of the house prices, it can be said that the average of the
house prices in Kingfisher bay is $888.575. Prices may vary from the average in a range of
29.6634. Highest recorded price is $811 and the total prices vary within a range of $1569.
(b) Average or mean is generally gets generally calculated as a measure of the middle point of a
dataset but sometim4sw median gets preferred instead. Lots of reasons can be sited for this such
as the case of outliers. An outlier is a data points in a data set which is far away from the stream
line. Every data sets are generally streamlined in a category. They are arranged with proper gaps
in them and the gaps are more or less in the same category like a gap of 1 point, a gap of two
point, gap of three point and like that. A data point that is falling completely outside of the
streamline means it may have a gap of 15 points are called outliers. These outlier points can be a
strong disadvantage because in the process of the average calculation. The data points are added
up first and then get divided by the total number of data. The total can get severely affected with
the outliers and the average can get deviated greatly. Another problem can be of extreme values.
A dataset can have lots of very low values or lots of very high values. This also can affect the
average calculation because during the addition and the division of the data, the average can get
alienated toward the extreme values and hence the middle will never get highlighted. Another
problem is regarding the symmetric distributions. A data set can be symmetrically distributed.
This can be easily understood with plotting the dataset since dataset with symmetric distribution
will generate a symmetric diagram which will be equally centered throughout the whole plotting
area. The graph which does not shows all such characteristics are called a asymmetrical
distribution. Median is always a preferred measure for the middle points regarding the
5HOUSE PRICS IN KINGFISHER BAY
asymmetrical distributions since these kind of distributional division may contain the lots of
diverted points and they may deviated the average from the required point. The median does not
get effected by these point since it is calculation of the middle point. The middle point can never
move towards any direction or may have a shift of a single point.
(c) Total number of houses in Kingfisher Bay as recorded in the dataset is 120 and the average
prices of the houses are $887 (Noru 2012.). The dataset has a collection of 120 points and the
house prices are recorded for Kingfisher Bay. The average price is the indicator of the prevailing
prices in the area. And average can also get deviated by a limit. This deviation is an example of
practical situations. The total range of the prices that is the difference between the lowest price
and the highest price is. This is the overall variation region for the prices (Miller 2013).
(d) The sample size here is 120 and the number of houses in Kingfisher bay with rents more
than 1 million is 43. Hence the proportion of success is 0.35833. Now the standard error for this
proportion is 0.043773 that is the error proportion and the portion that can vary up to this level
(Pituch, Whittaker and Stevens 2015). The variation limits are: The lower limit is 27.25% and
the higher limit is 44.41%.
House prices vs. conditions/suburbs:
(a) The house conditions of the area are analyzed. Kingfisher Bay is considered to an old city
with lots of old houses with new houses as well. According to the data, the condition of the
houses can be described as:
15 houses are in a very poor condition, 40 houses are poor condition means in a condition
which is slightly better than the first 15 houses, 42 Houses are in a really good conditions and the
rest of the 23 houses are in moderate condition. This condition factor plays an important role in
⊘ This is a preview!⊘
Do you want full access?
Subscribe today to unlock all pages.
Trusted by 1+ million students worldwide
6HOUSE PRICS IN KINGFISHER BAY
deciding the price level of the houses. The houses which are in a very poor condition need
immediate attention or which may decrease the price for these houses.
(b) In the study of differences in:
(1) Houses are classified in according to the conditions in the different suburbs. There are three
suburbs in the whole region. Kingfisher bay is not considered to be a very newly developed
area. There are old houses as well as new houses and moderately aged houses. They can be
classified in a group according to the conditions of the houses which is largely dependent on
ages. Analysis shows that there is less number of houses which are in a very poor condition
regarding all of the suburbs. Again there are moderate number of houses which in a poor
condition and good condition. This classification is true for all of the suburbs. A little less
number of houses are in excellent conditions as in comparison to the good conditions and poor
conditions and this is again the same for all the suburbs.
(2) The house prices can also be classified according to the condition in the different suburbs.
Houses which are in god conditions and which are highly maintained will obviously generate
higher revenues and the low condition houses will generate less revenue. The average prices of
the houses are in very poor conditions are comparatively low and the houses which are
comparatively in a better conditions has a comparatively high average prices. The same goes
with the houses in good and in excellent conditions. They have greater average prices.
(3) A comparison is being made between the house prices in the different suburbs. All the prices
are recorded and being calculated for the average price. It can be seen that Suburb A has the
lowest average price. The Suburb B has the medium of the averages and the Suburb C has the
lowest of the average prices.
Paraphrase This Document
Need a fresh take? Get an instant paraphrase of this document with our AI Paraphraser
7HOUSE PRICS IN KINGFISHER BAY
(c) Suburbs and house conditions has an impact on the prices but lots of other factors are also
responsible like the distances from the bus stand, train stand, shops. People always demand for
this kind of things as this goes in the case of regular uses. Every one travels on a regular basis for
whatever the reasons it like going to the workplace, going to the schools and lots more. Again
day needs can only be made easy when there is a shop around. If people are staying somewhere
on a regular basis, these are the factor which obviously needed to get considered. What exactly is
the style of kitchen and what is the bathroom style. Kitchen is most important part of any
household and it should include each and every amenity and the modern amenities. The
bathrooms should also be provided with the modern amenities. Prices also depends on storey
number, the number of room is the house, on the presence of air conditions. All of them can be
considered as the basic factors.
House prices vs. factors influencing house prices:
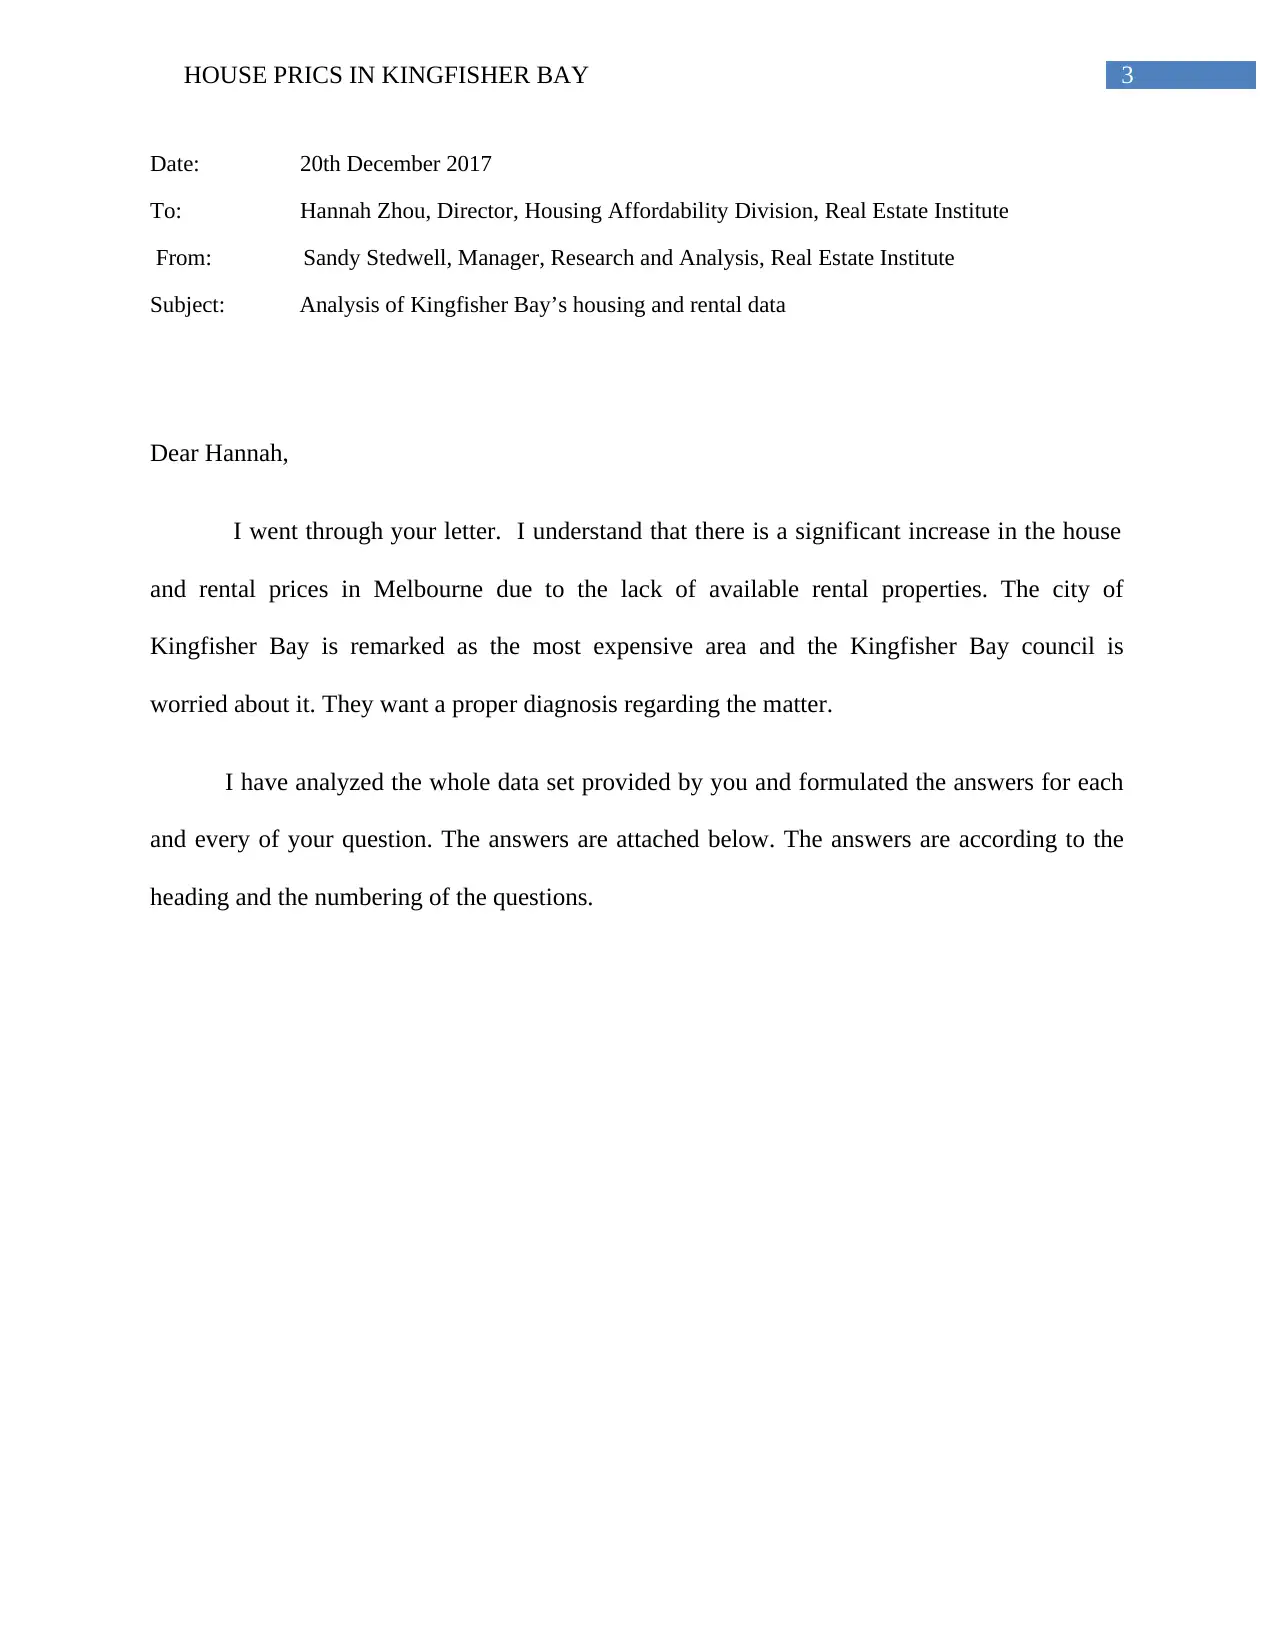
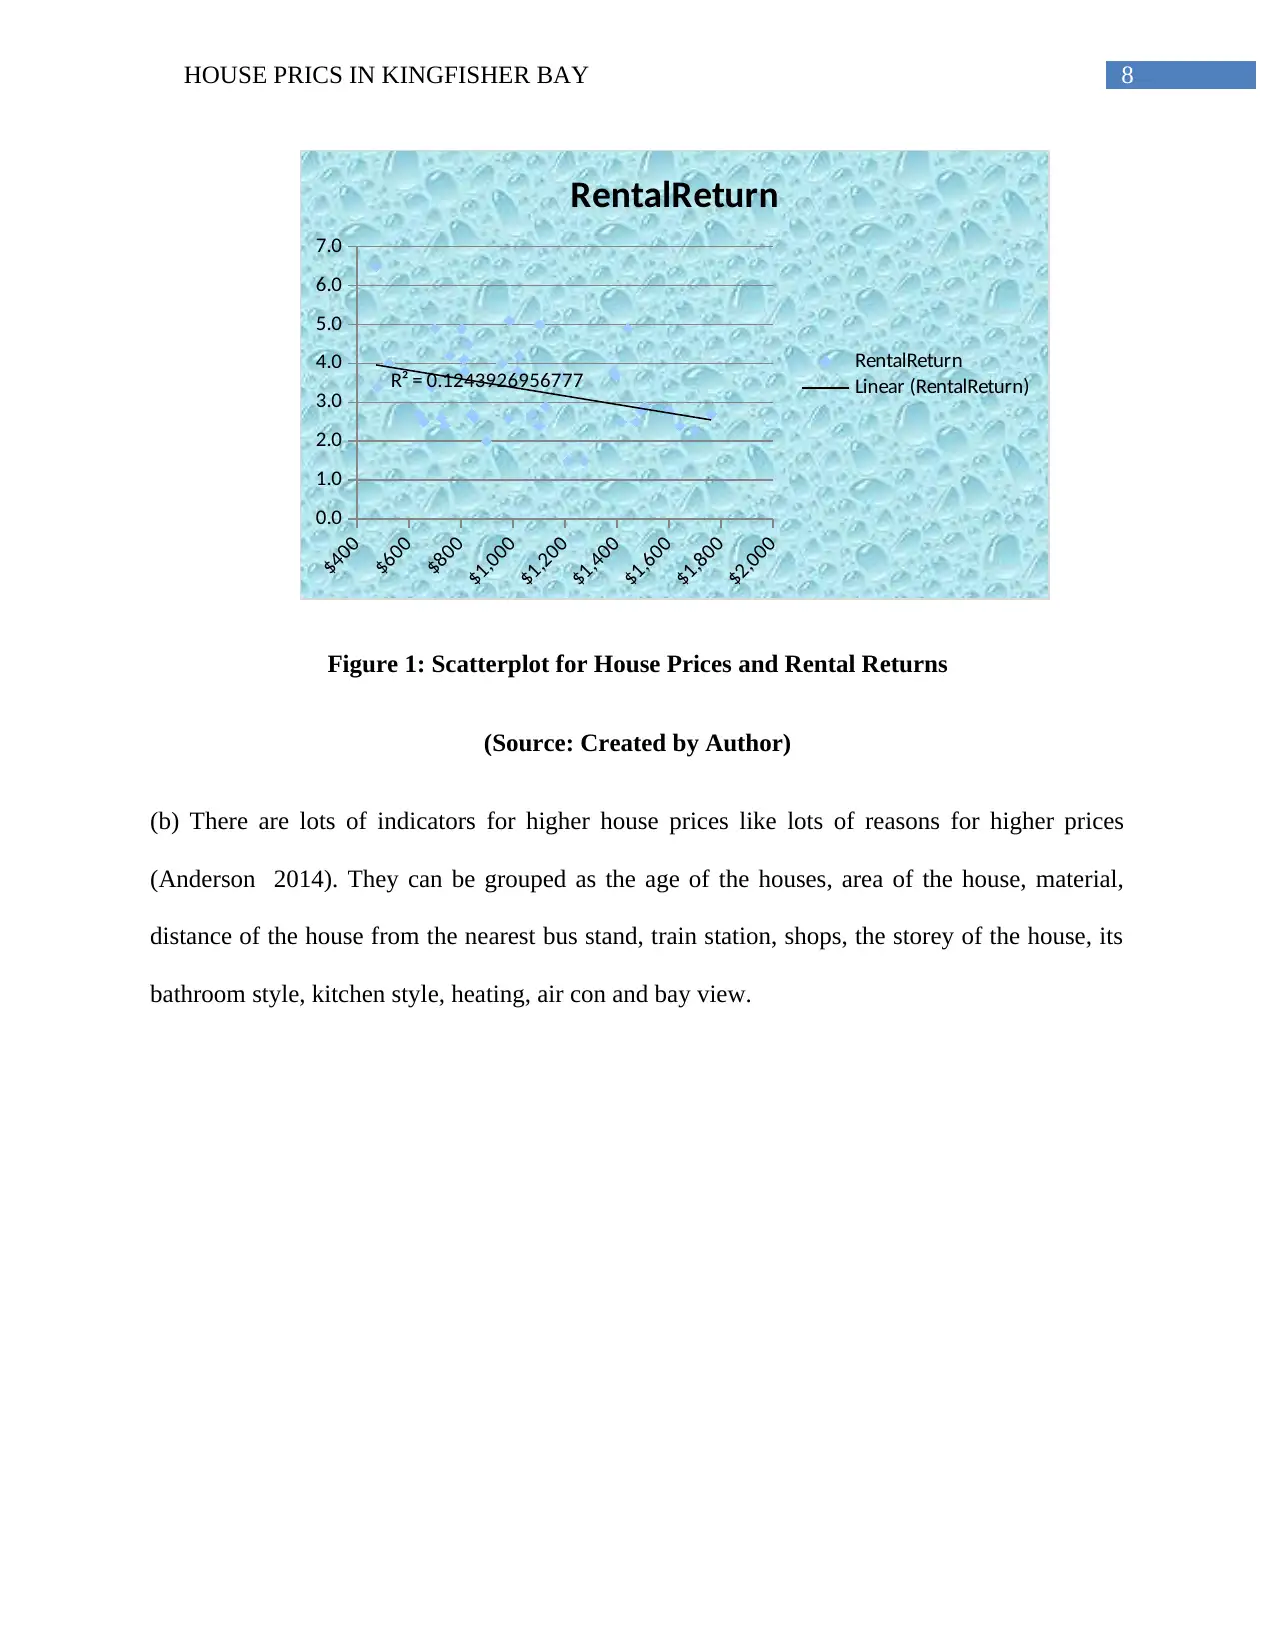
(a)To be checked that whether the higher house prices are driven by good rental investments
(Altman et al. 2013). The test can be done through the regression testing method where the
dependent factor is the prices and the independent factor is the rental returns (Urdan 2016).
Theory for the test can be set as:
Higher rental prices depend on people seeking higher rental investment vs The
rental prices does not depends on the people seeking higher rental investment.
From the analysis, it can clearly be seen that the first theory can be rejected and it can be
said that higher rentals are not depended on people seeking good rental investment. Scatter plot
of the two factors including the trend line is shown below:
(c) Suburbs and house conditions has an impact on the prices but lots of other factors are also
responsible like the distances from the bus stand, train stand, shops. People always demand for
this kind of things as this goes in the case of regular uses. Every one travels on a regular basis for
whatever the reasons it like going to the workplace, going to the schools and lots more. Again
day needs can only be made easy when there is a shop around. If people are staying somewhere
on a regular basis, these are the factor which obviously needed to get considered. What exactly is
the style of kitchen and what is the bathroom style. Kitchen is most important part of any
household and it should include each and every amenity and the modern amenities. The
bathrooms should also be provided with the modern amenities. Prices also depends on storey
number, the number of room is the house, on the presence of air conditions. All of them can be
considered as the basic factors.
House prices vs. factors influencing house prices:
(a)To be checked that whether the higher house prices are driven by good rental investments
(Altman et al. 2013). The test can be done through the regression testing method where the
dependent factor is the prices and the independent factor is the rental returns (Urdan 2016).
Theory for the test can be set as:
Higher rental prices depend on people seeking higher rental investment vs The
rental prices does not depends on the people seeking higher rental investment.
From the analysis, it can clearly be seen that the first theory can be rejected and it can be
said that higher rentals are not depended on people seeking good rental investment. Scatter plot
of the two factors including the trend line is shown below:
8HOUSE PRICS IN KINGFISHER BAY
$400
$600
$800
$1,000
$1,200
$1,400
$1,600
$1,800
$2,000
0.0
1.0
2.0
3.0
4.0
5.0
6.0
7.0
R² = 0.1243926956777
RentalReturn
RentalReturn
Linear (RentalReturn)
Figure 1: Scatterplot for House Prices and Rental Returns
(Source: Created by Author)
(b) There are lots of indicators for higher house prices like lots of reasons for higher prices
(Anderson 2014). They can be grouped as the age of the houses, area of the house, material,
distance of the house from the nearest bus stand, train station, shops, the storey of the house, its
bathroom style, kitchen style, heating, air con and bay view.
⊘ This is a preview!⊘
Do you want full access?
Subscribe today to unlock all pages.
Trusted by 1+ million students worldwide
9HOUSE PRICS IN KINGFISHER BAY
Concerns raised by real estate agents and developers.
(a)
(1) Suburb-A: The weekly rents of Suburb-A in Kingfisher bay are given. It is to be checked
that whether the average weekly rent in the area is $600 (Konietschke and Pauly 2014). This
testing can be done through some statistical procedure. The basic theory and the alternative
theory are stated:
The average price is below $600 vs The average prices in more than or equal to $600.
The analysis clearly shows that the basic theory is to rejected and the average weekly rent
will be greater than or equal to $600.
(2) Suburb-B: The weekly rents of Suburb-B in Kingfisher bay are given. It is to be checked that
whether the average weekly rent in the area is $600. This testing can be done through some
statistical procedure. The basic theory and the alternative theory is stated:
The average price is below $600 vs The average prices in more than or equal to $600.
The analysis clearly shows that the basic theory is to rejected and the average weekly rent
will be greater than or equal to $600.
(3) Suburb-C: The weekly rents of Suburb-C in Kingfisher bay are given. It is to be checked that
whether the average weekly rent in the area is $600 (Kuznetsova 2015). This testing can be done
through some statistical procedure. The basic theory and the alternative theory is stated:
Paraphrase This Document
Need a fresh take? Get an instant paraphrase of this document with our AI Paraphraser
10HOUSE PRICS IN KINGFISHER BAY
The average price is below $600 vs The average prices in more than or equal to $600.
The analysis clearly shows that the basic theory is to rejected and the average weekly rent
will be greater than or equal to $600.
(b) The Kingfisher Bay area us known as not to be a newly developed area. The houses are
believed to be quite old and the lacks maintenance. This believe is to be checked here and this
can be done with the help of the data set. It can be check that whether majority of the houses in
the area is old or not and whether they lack developments. To be checked is whether there is a
lack of development is the Kingfisher Bay as at least 75% of the houses in this area are 10 years
or older (Snyder et al. 2014). This can be checked through the statistical testing procedure. The
theory for testing will be:
Less than 75% of the houses age 10 years or more vs More than or equally 75% of the
houses age 10 years or more
Future surveys:
Regarding the future surveys for the purpose of comparison and tracking of house prices
(Gravetter 2016). The required sample sizes are to be calculated under the light of two
categories:
11HOUSE PRICS IN KINGFISHER BAY
(a) Future surveys need a specific sample size to be carried on and to keep the average at
$50000. This required sample size can be calculated through some statistical methods. It
can be said that the required sample size is 120.
(b) Number of samples should be taken to carry a survey can be calculated. The survey is to be
conducted Keeping in mind that the proportion of vacant houses in the locality will be 3%.
Analysis says that the required sample size is 342.
⊘ This is a preview!⊘
Do you want full access?
Subscribe today to unlock all pages.
Trusted by 1+ million students worldwide
1 out of 15
Related Documents


Your All-in-One AI-Powered Toolkit for Academic Success.
+13062052269
info@desklib.com
Available 24*7 on WhatsApp / Email
![[object Object]](/_next/static/media/star-bottom.7253800d.svg)
Unlock your academic potential
Copyright © 2020–2025 A2Z Services. All Rights Reserved. Developed and managed by ZUCOL.