Report on London's Housing Market: Supply, Demand, and Equilibrium
VerifiedAdded on 2023/06/08
|14
|2372
|338
Report
AI Summary
This report examines the supply and demand dynamics within the London housing market, focusing on the impact of factors such as Covid-19 on housing and rental prices. It employs supply and demand equilibrium diagrams to illustrate concepts like shifts in supply and demand curves, elastic and inelastic demand, and elastic and inelastic supply. The report highlights how changes in price, consumer income, and external events influence market equilibrium, ultimately affecting housing affordability and availability in London. The analysis concludes that understanding the interplay between supply and demand is crucial for addressing challenges in the housing market.

The Assessment Task
Paraphrase This Document
Need a fresh take? Get an instant paraphrase of this document with our AI Paraphraser
Table of Content
INTRODUCTION.........................................................................................................................4
MAIN BODY..................................................................................................................................4
A basic supply and demand equilibrium diagrams......................................................................5
Supply Curve shift to the Right...................................................................................................6
Supply to the left..........................................................................................................................7
Demand to the right.....................................................................................................................7
Demand to the left.......................................................................................................................8
Elastic demand.............................................................................................................................9
Inelastic demand........................................................................................................................10
Elastic supply.............................................................................................................................11
Inelastic supply..........................................................................................................................12
CONCLUSION............................................................................................................................13
REFERENCES............................................................................................................................14

⊘ This is a preview!⊘
Do you want full access?
Subscribe today to unlock all pages.
Trusted by 1+ million students worldwide
INTRODUCTION
Demand is the want of the person in order to buy the specific commodity has sufficient
purchasing power. The demand can be defined, as it is dependent on the buying capacity of the
costumer for particular goods and services(Golpîra and Khan, 2019). There is no change in other
factors, change in the prices of commodity make fluctuation in the demand of the specific
commodity in the target market. The respective price at which the given products are being sell
and same is purchase by the consumer is called as the demand of the commodity. In this
respective report, the housing market in London for buying and renting property has seen main
increases in prices over the past few years. Thus this report will analyse the factors which are
impacting the shift in the supply and demand of the property in London.
Whereas supply is defined as the total amount of manufactured goods and services and are
available to the sell in order to meet the needs of the market is known as the supply. They have
direct relationship in the supply and the prices of the product as when the price of the products
more then the supply of the given goods also increases, as the seller always sell their products on
higher prices by which they can ensures the higher revenue and profitability to their business.
For example, when the price of the pen rises then the seller will manufacture and supply of tis
pen by which they can ensures the higher sales and profitability in the target market.
Market equilibrium is defined as the state where the demand of the individual is completed
by the supply of the commodity as or can say that the price of the commodity is sale as the
consumer can pay for it. Equilibrium is the state in which the overall price of quality is meeting
the purchasing power of the consumer and they are comfortable to buy the particular commodity
in the target market. Quantity demand is the aspects which is demanded by the customer for a
particular commodity in the target market. This report also covers the concept of market
equilibrium and analyse the factors impacting the same. All such discussion is based on above
given situation in which the prices of housing and renting in rapidly increasing.
MAIN BODY
Due to the huge impact pf Covid-19, UK is going through the major impact. The people who
are living in UK is facing the increasing prices of housing and renting within the UK. There are
various factors which is impacting the supply and demand for the same. This can be due to the
unemployment within the country as the people are going through the major change in their lives
Paraphrase This Document
Need a fresh take? Get an instant paraphrase of this document with our AI Paraphraser
and they are not able to settle down their expenses. Due to which the prices of housing and
renting increases as the house owner trying to increase its earning through renting and in such
way the rising prices is impacting the overall supply and demand in the market. In current
marker the pricing of the housing rises and this can be due to the various factors which are
explained below with the help of appropriate diagrams.
A basic supply and demand equilibrium diagrams
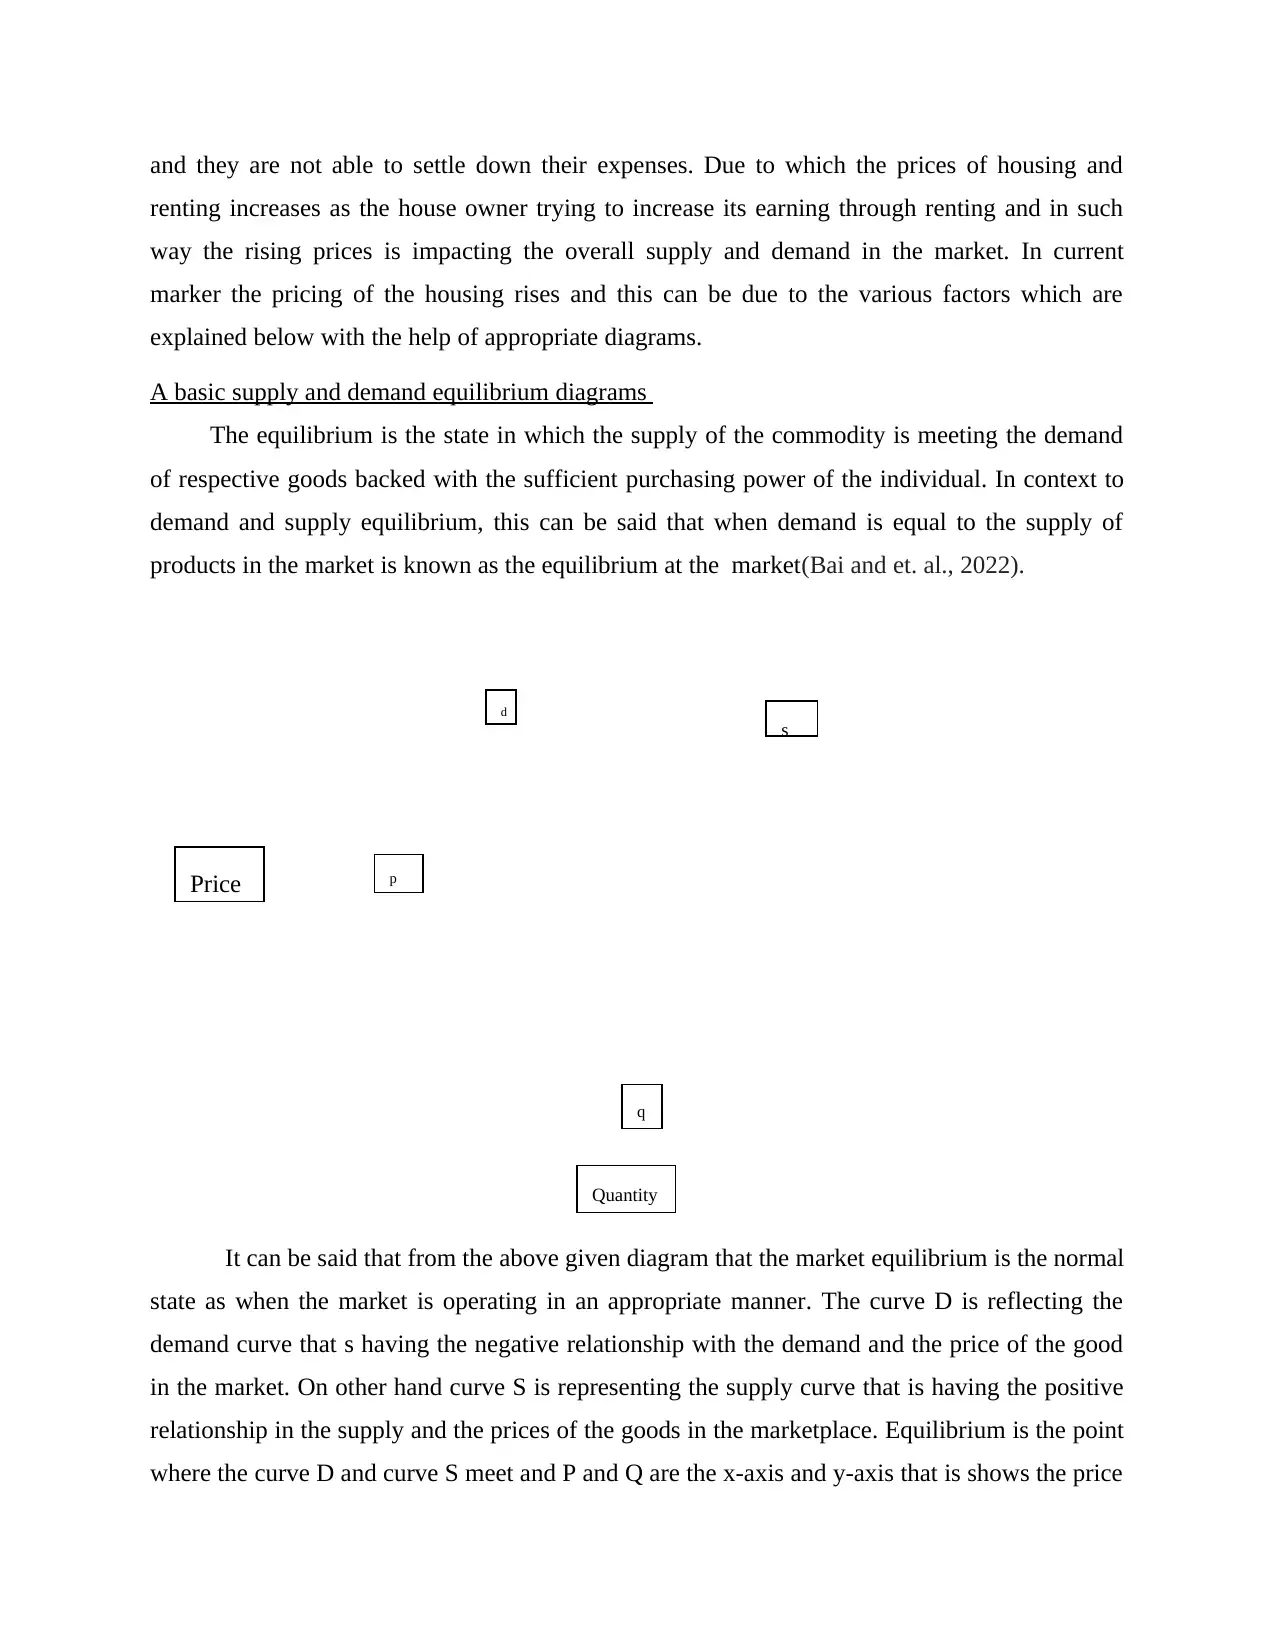
The equilibrium is the state in which the supply of the commodity is meeting the demand
of respective goods backed with the sufficient purchasing power of the individual. In context to
demand and supply equilibrium, this can be said that when demand is equal to the supply of
products in the market is known as the equilibrium at the market(Bai and et. al., 2022).
It can be said that from the above given diagram that the market equilibrium is the normal
state as when the market is operating in an appropriate manner. The curve D is reflecting the
demand curve that s having the negative relationship with the demand and the price of the good
in the market. On other hand curve S is representing the supply curve that is having the positive
relationship in the supply and the prices of the goods in the marketplace. Equilibrium is the point
where the curve D and curve S meet and P and Q are the x-axis and y-axis that is shows the price
Price
d
s
p
Quantity
q
renting increases as the house owner trying to increase its earning through renting and in such
way the rising prices is impacting the overall supply and demand in the market. In current
marker the pricing of the housing rises and this can be due to the various factors which are
explained below with the help of appropriate diagrams.
A basic supply and demand equilibrium diagrams
The equilibrium is the state in which the supply of the commodity is meeting the demand
of respective goods backed with the sufficient purchasing power of the individual. In context to
demand and supply equilibrium, this can be said that when demand is equal to the supply of
products in the market is known as the equilibrium at the market(Bai and et. al., 2022).
It can be said that from the above given diagram that the market equilibrium is the normal
state as when the market is operating in an appropriate manner. The curve D is reflecting the
demand curve that s having the negative relationship with the demand and the price of the good
in the market. On other hand curve S is representing the supply curve that is having the positive
relationship in the supply and the prices of the goods in the marketplace. Equilibrium is the point
where the curve D and curve S meet and P and Q are the x-axis and y-axis that is shows the price
Price
d
s
p
Quantity
q
of the commodity is favourable in the market. In such way the market equilibrium is maintaining
with the sufficient supply of goods and services in the targeted market.
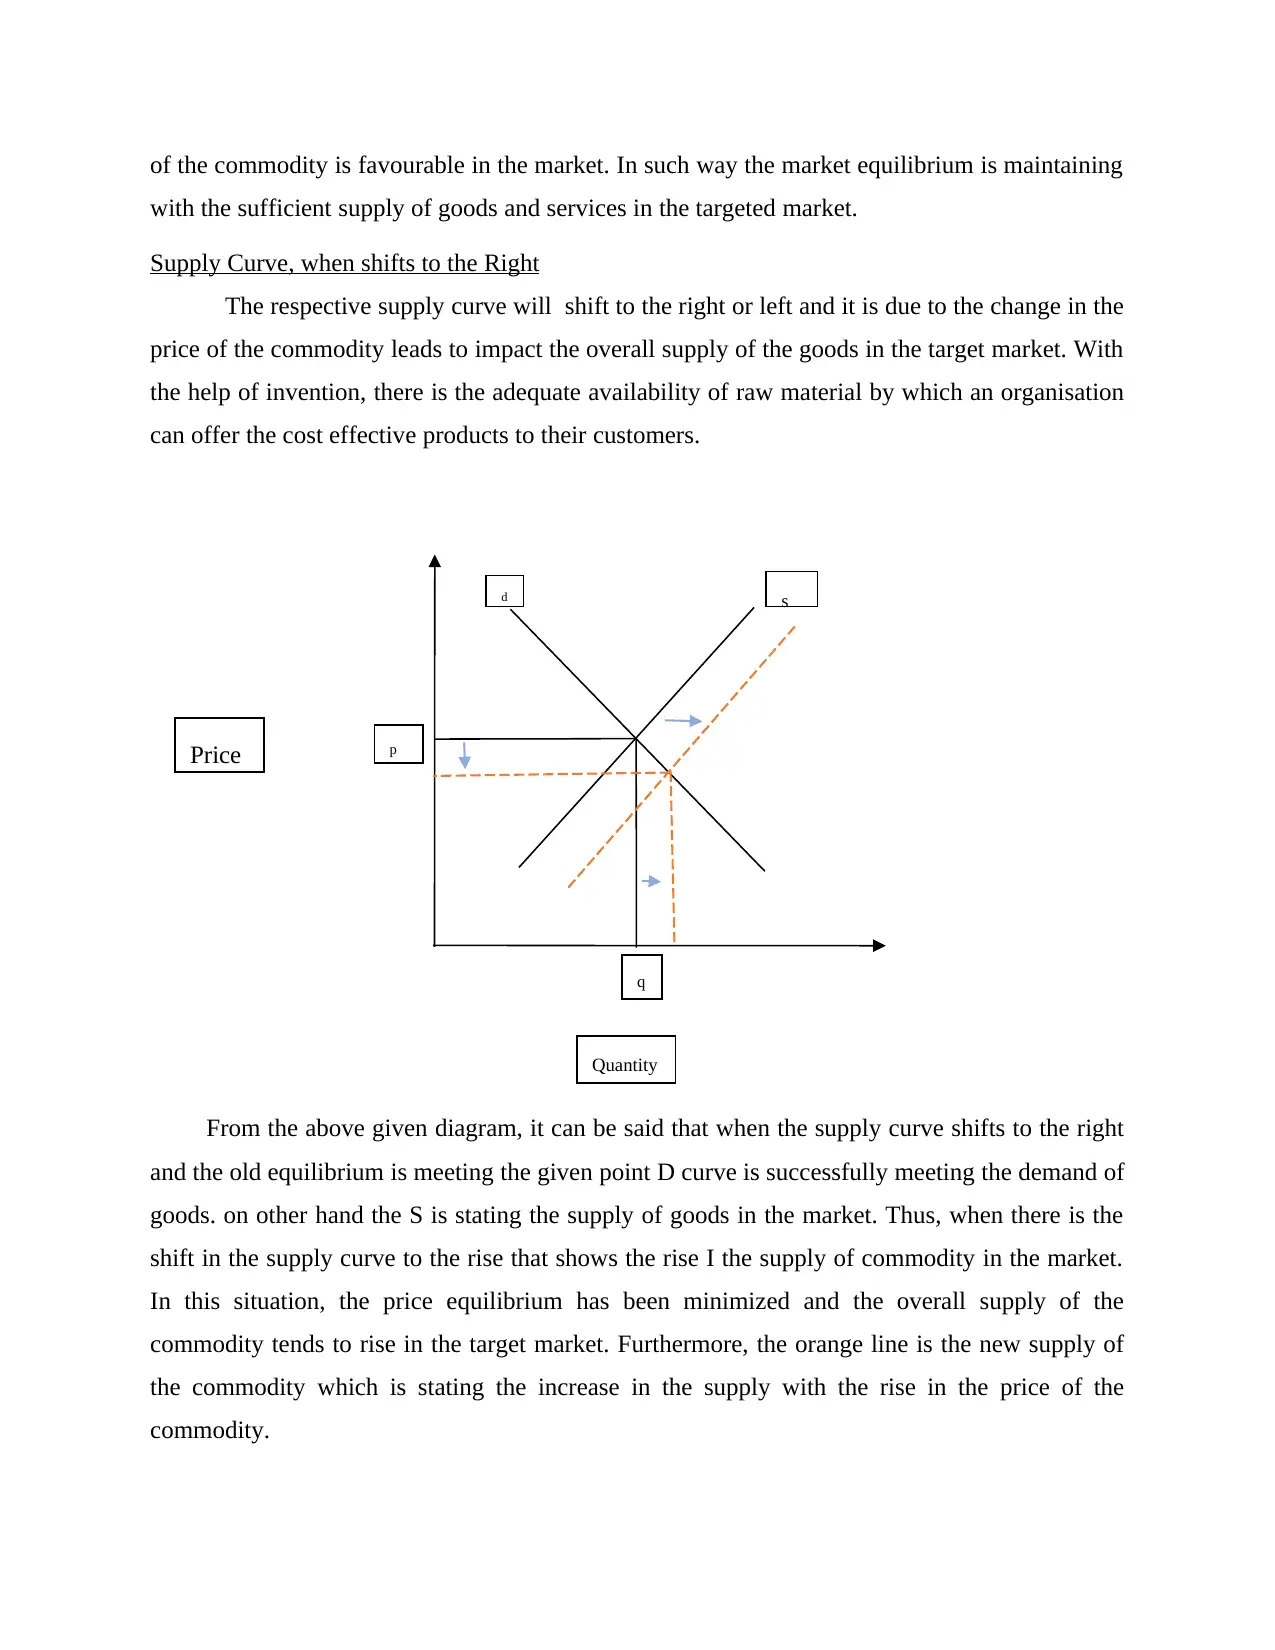
Supply Curve, when shifts to the Right
The respective supply curve will shift to the right or left and it is due to the change in the
price of the commodity leads to impact the overall supply of the goods in the target market. With
the help of invention, there is the adequate availability of raw material by which an organisation
can offer the cost effective products to their customers.
From the above given diagram, it can be said that when the supply curve shifts to the right
and the old equilibrium is meeting the given point D curve is successfully meeting the demand of
goods. on other hand the S is stating the supply of goods in the market. Thus, when there is the
shift in the supply curve to the rise that shows the rise I the supply of commodity in the market.
In this situation, the price equilibrium has been minimized and the overall supply of the
commodity tends to rise in the target market. Furthermore, the orange line is the new supply of
the commodity which is stating the increase in the supply with the rise in the price of the
commodity.
Price
d s
p
Quantity
q
with the sufficient supply of goods and services in the targeted market.
Supply Curve, when shifts to the Right
The respective supply curve will shift to the right or left and it is due to the change in the
price of the commodity leads to impact the overall supply of the goods in the target market. With
the help of invention, there is the adequate availability of raw material by which an organisation
can offer the cost effective products to their customers.
From the above given diagram, it can be said that when the supply curve shifts to the right
and the old equilibrium is meeting the given point D curve is successfully meeting the demand of
goods. on other hand the S is stating the supply of goods in the market. Thus, when there is the
shift in the supply curve to the rise that shows the rise I the supply of commodity in the market.
In this situation, the price equilibrium has been minimized and the overall supply of the
commodity tends to rise in the target market. Furthermore, the orange line is the new supply of
the commodity which is stating the increase in the supply with the rise in the price of the
commodity.
Price
d s
p
Quantity
q
⊘ This is a preview!⊘
Do you want full access?
Subscribe today to unlock all pages.
Trusted by 1+ million students worldwide
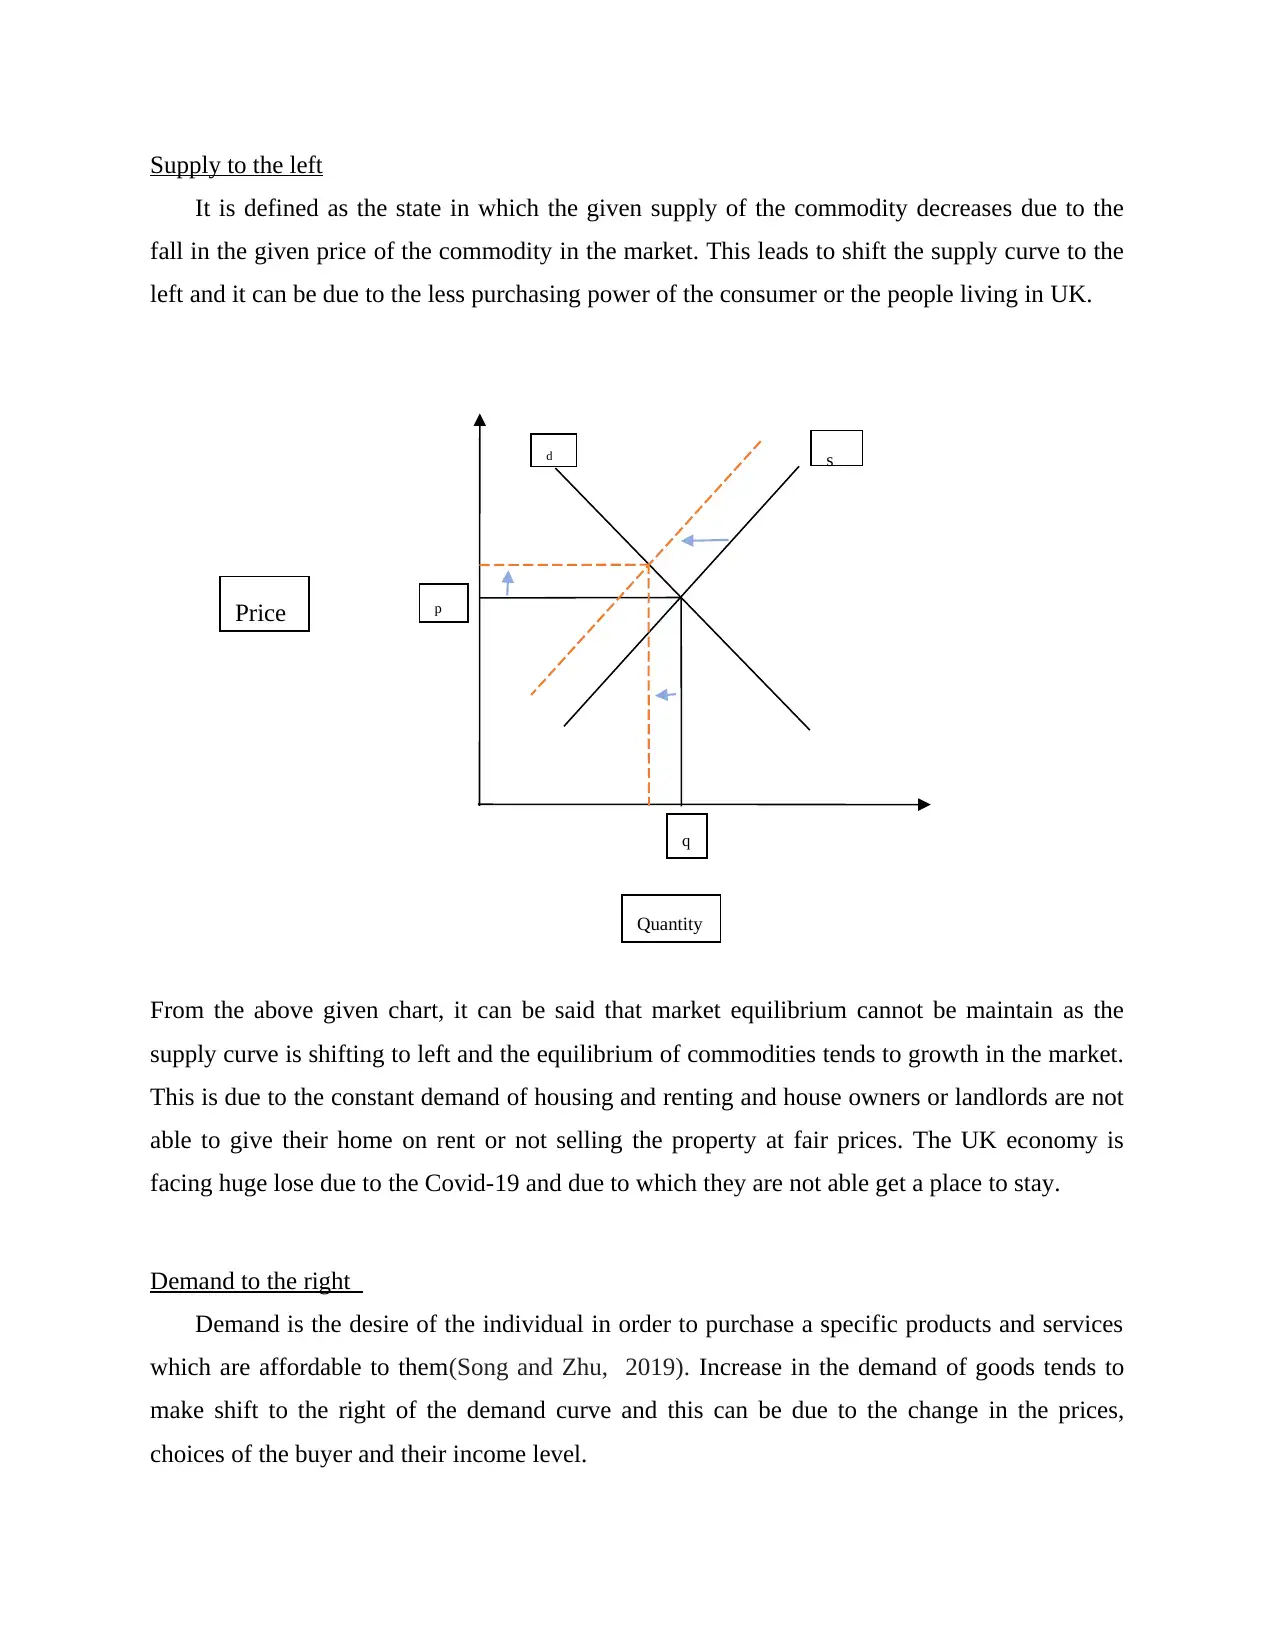
Supply to the left
It is defined as the state in which the given supply of the commodity decreases due to the
fall in the given price of the commodity in the market. This leads to shift the supply curve to the
left and it can be due to the less purchasing power of the consumer or the people living in UK.
From the above given chart, it can be said that market equilibrium cannot be maintain as the
supply curve is shifting to left and the equilibrium of commodities tends to growth in the market.
This is due to the constant demand of housing and renting and house owners or landlords are not
able to give their home on rent or not selling the property at fair prices. The UK economy is
facing huge lose due to the Covid-19 and due to which they are not able get a place to stay.
Demand to the right
Demand is the desire of the individual in order to purchase a specific products and services
which are affordable to them(Song and Zhu, 2019). Increase in the demand of goods tends to
make shift to the right of the demand curve and this can be due to the change in the prices,
choices of the buyer and their income level.
Price
d s
p
Quantity
q
Paraphrase This Document
Need a fresh take? Get an instant paraphrase of this document with our AI Paraphraser
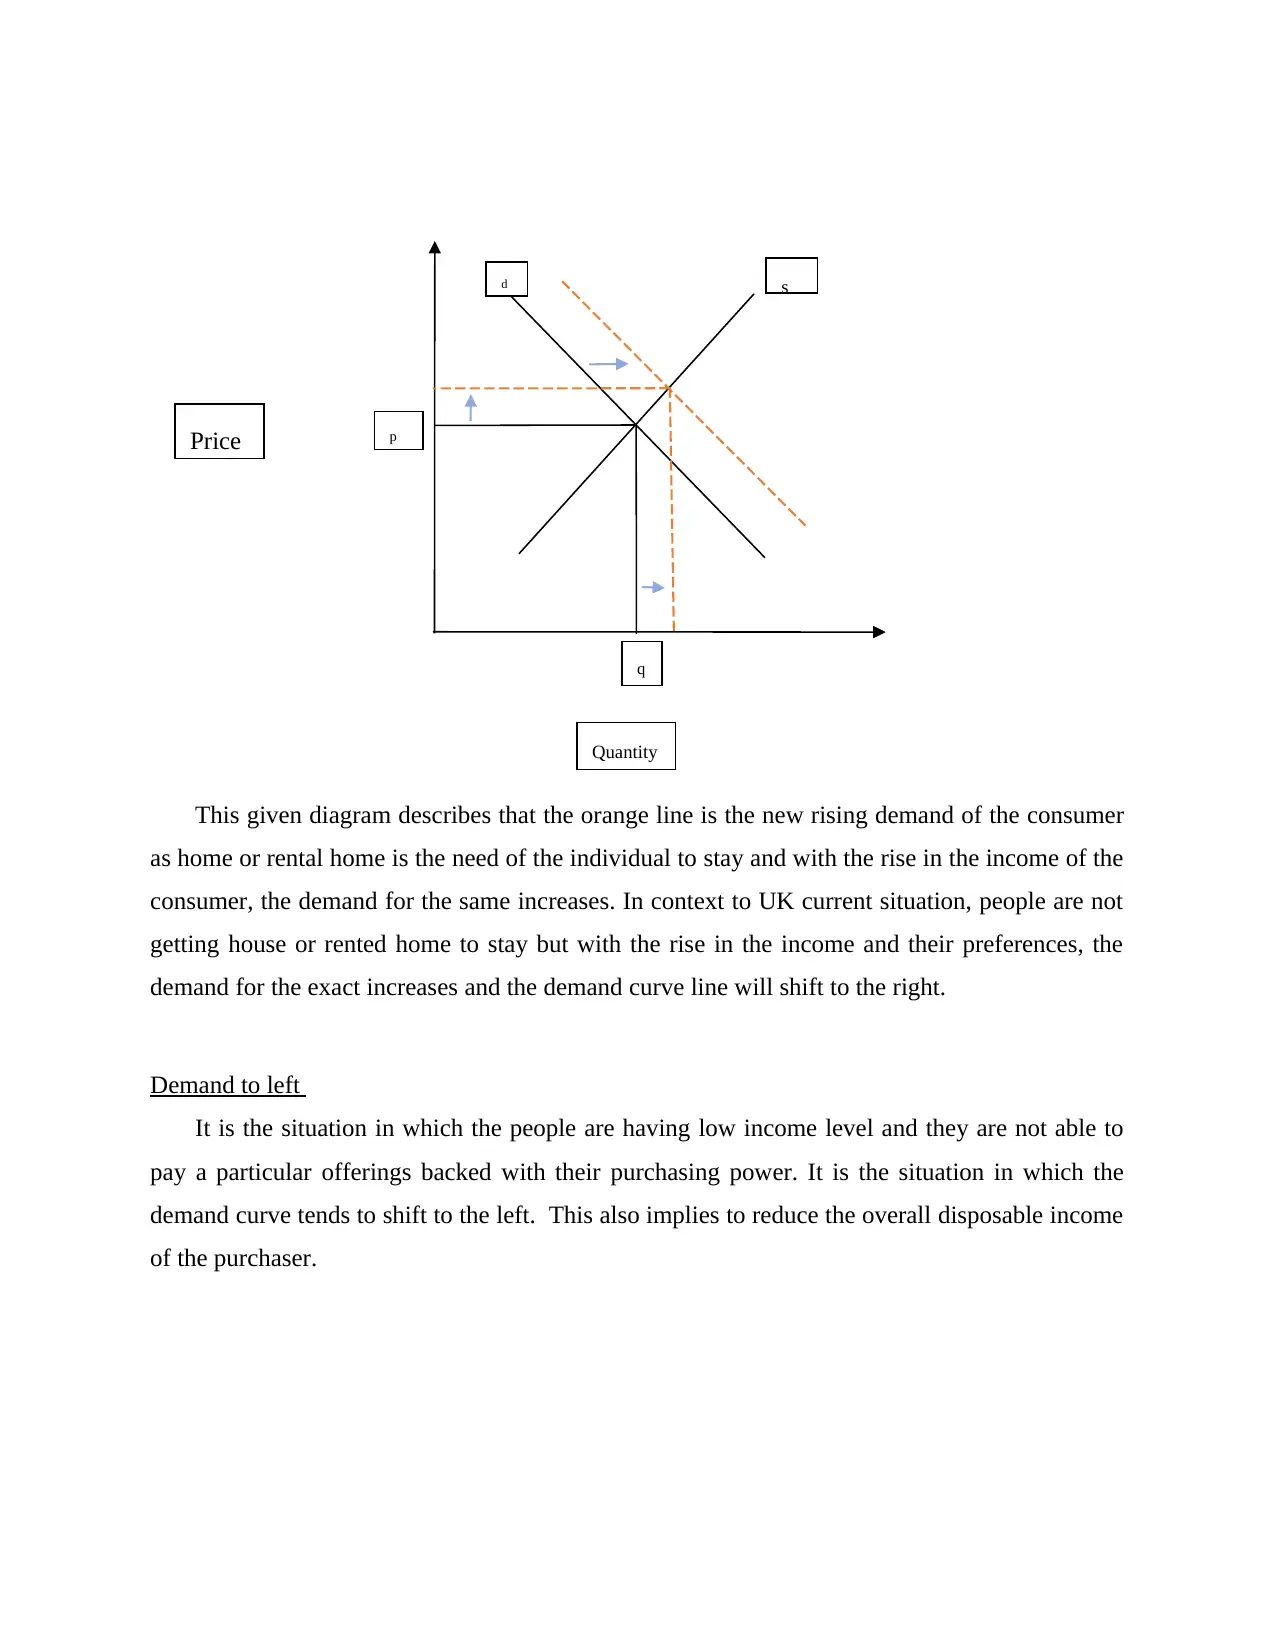
This given diagram describes that the orange line is the new rising demand of the consumer
as home or rental home is the need of the individual to stay and with the rise in the income of the
consumer, the demand for the same increases. In context to UK current situation, people are not
getting house or rented home to stay but with the rise in the income and their preferences, the
demand for the exact increases and the demand curve line will shift to the right.
Demand to left
It is the situation in which the people are having low income level and they are not able to
pay a particular offerings backed with their purchasing power. It is the situation in which the
demand curve tends to shift to the left. This also implies to reduce the overall disposable income
of the purchaser.
Price
d s
p
Quantity
q
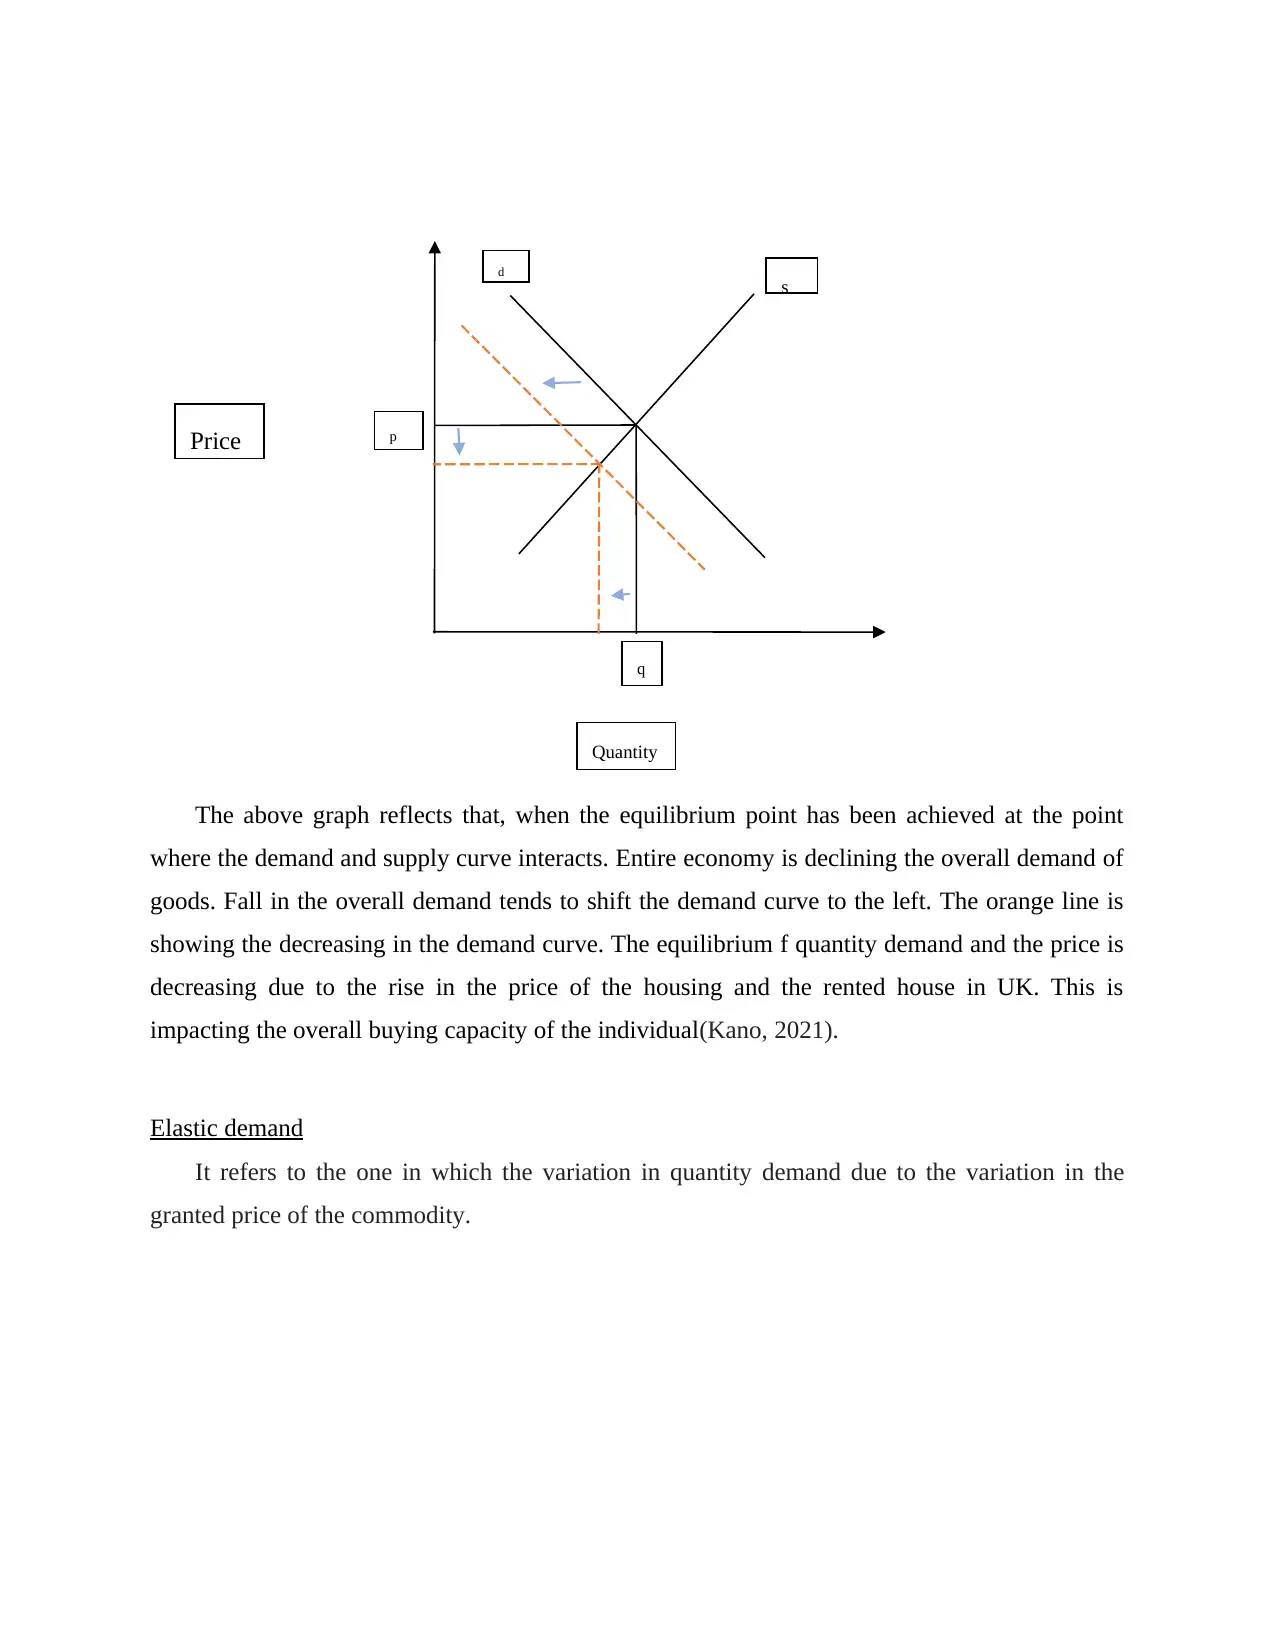
The above graph reflects that, when the equilibrium point has been achieved at the point
where the demand and supply curve interacts. Entire economy is declining the overall demand of
goods. Fall in the overall demand tends to shift the demand curve to the left. The orange line is
showing the decreasing in the demand curve. The equilibrium f quantity demand and the price is
decreasing due to the rise in the price of the housing and the rented house in UK. This is
impacting the overall buying capacity of the individual(Kano, 2021).
Elastic demand
It refers to the one in which the variation in quantity demand due to the variation in the
granted price of the commodity.
Price
d
s
p
Quantity
q
⊘ This is a preview!⊘
Do you want full access?
Subscribe today to unlock all pages.
Trusted by 1+ million students worldwide
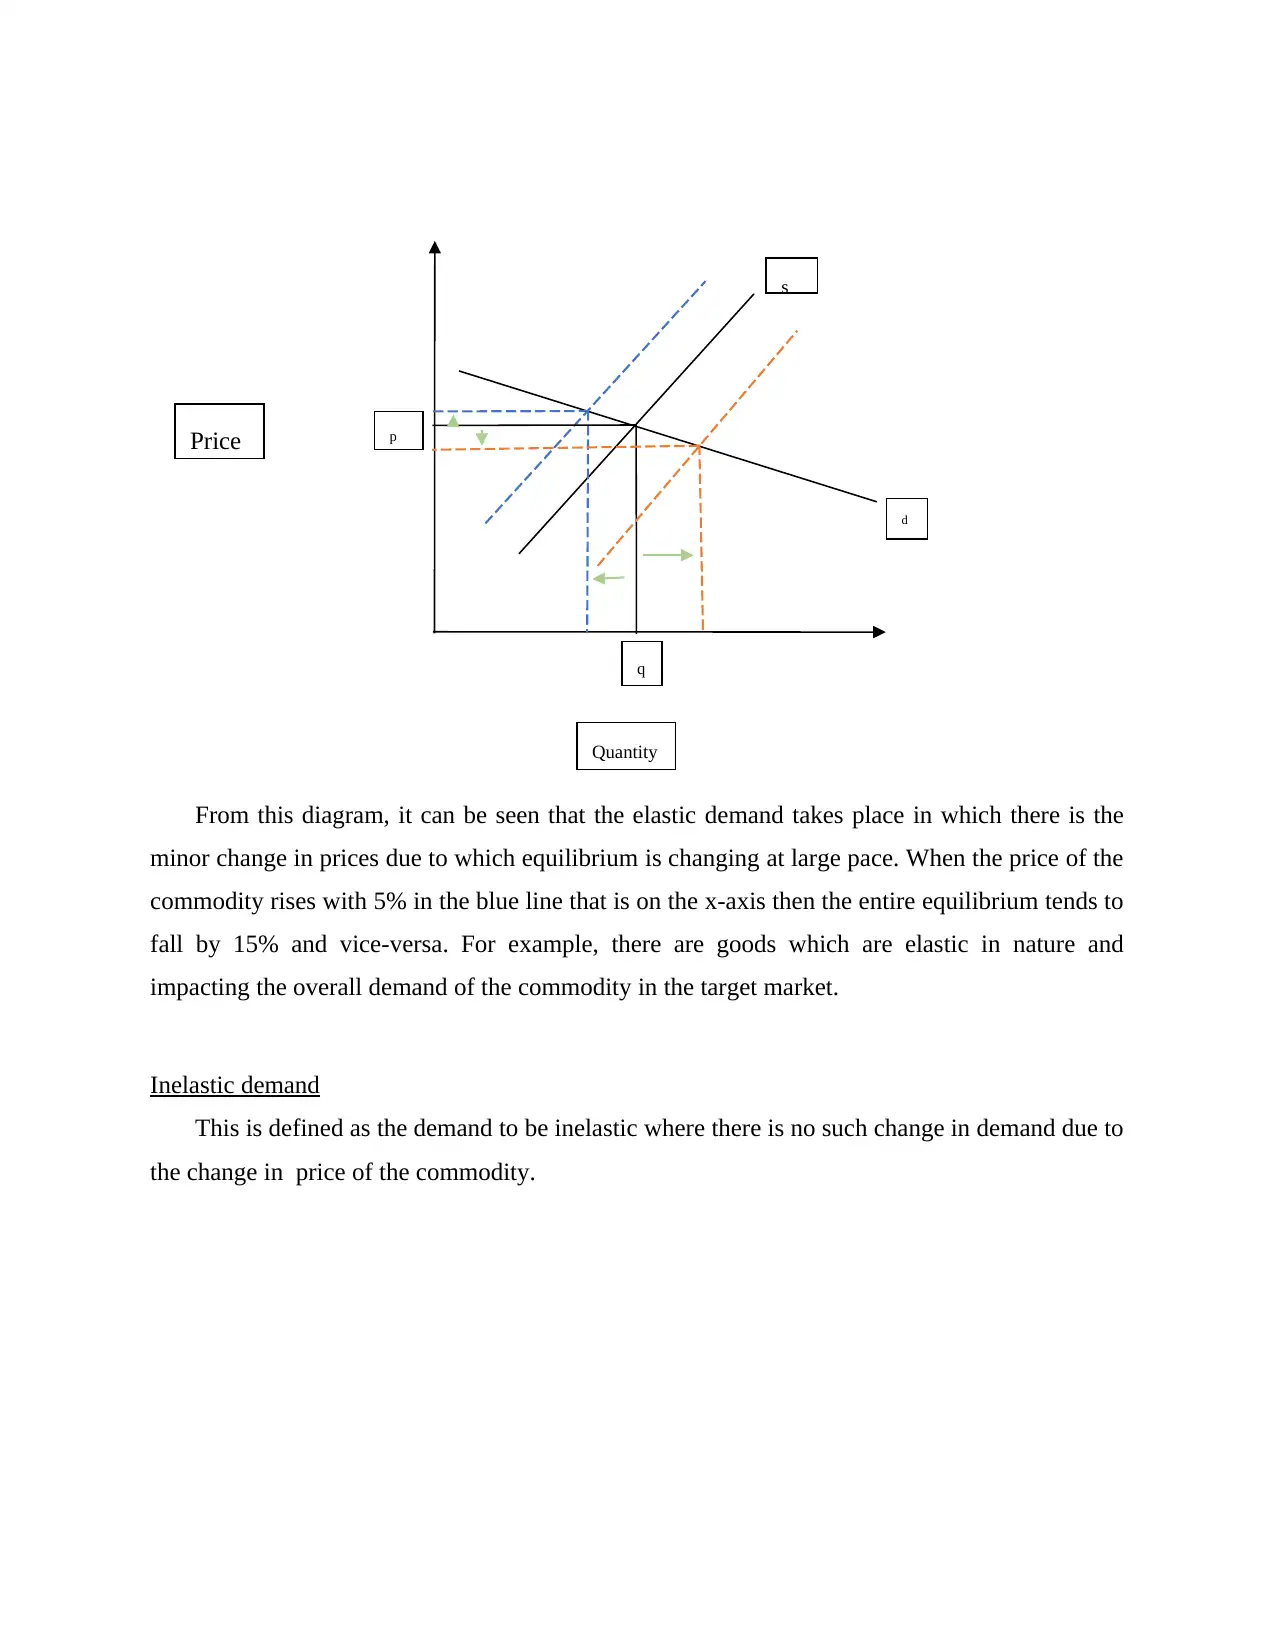
From this diagram, it can be seen that the elastic demand takes place in which there is the
minor change in prices due to which equilibrium is changing at large pace. When the price of the
commodity rises with 5% in the blue line that is on the x-axis then the entire equilibrium tends to
fall by 15% and vice-versa. For example, there are goods which are elastic in nature and
impacting the overall demand of the commodity in the target market.
Inelastic demand
This is defined as the demand to be inelastic where there is no such change in demand due to
the change in price of the commodity.
Price
d
s
p
Quantity
q
Paraphrase This Document
Need a fresh take? Get an instant paraphrase of this document with our AI Paraphraser
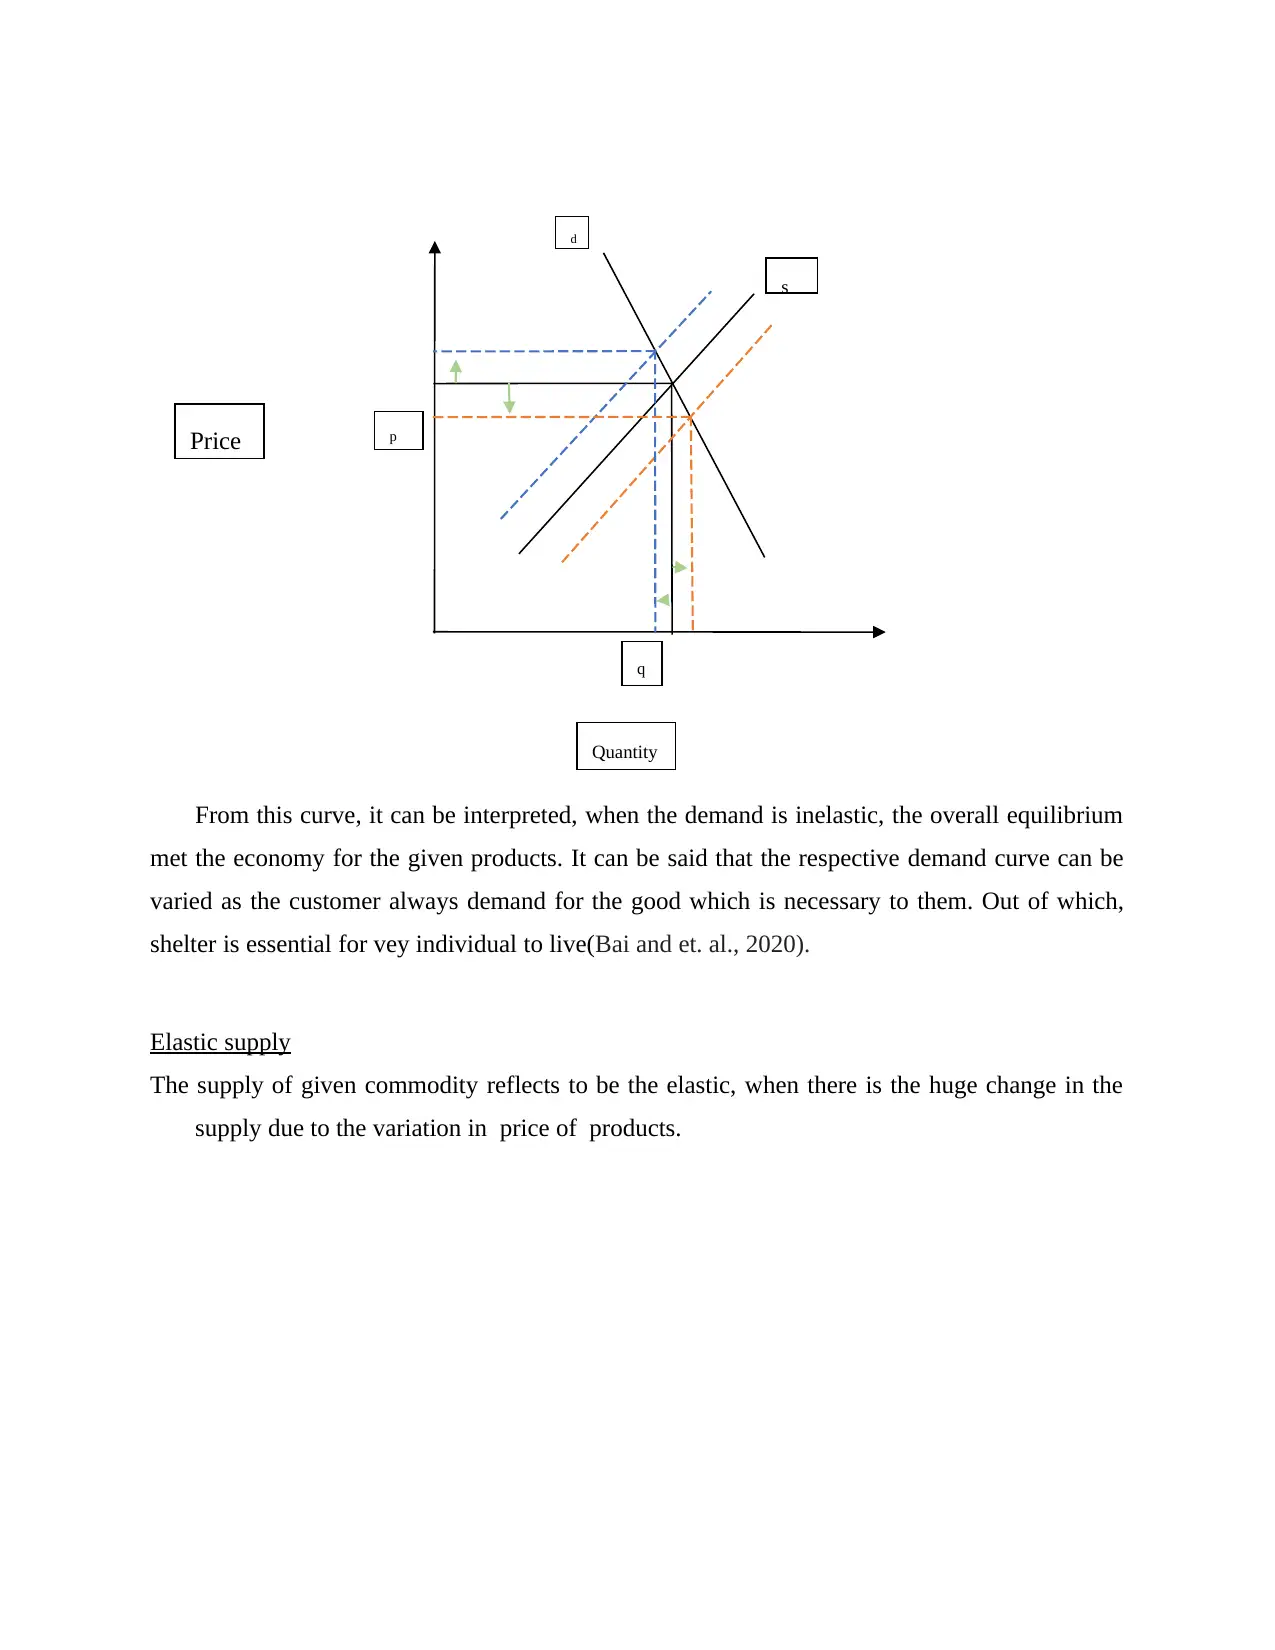
From this curve, it can be interpreted, when the demand is inelastic, the overall equilibrium
met the economy for the given products. It can be said that the respective demand curve can be
varied as the customer always demand for the good which is necessary to them. Out of which,
shelter is essential for vey individual to live(Bai and et. al., 2020).
Elastic supply
The supply of given commodity reflects to be the elastic, when there is the huge change in the
supply due to the variation in price of products.
Price
d
s
p
Quantity
q
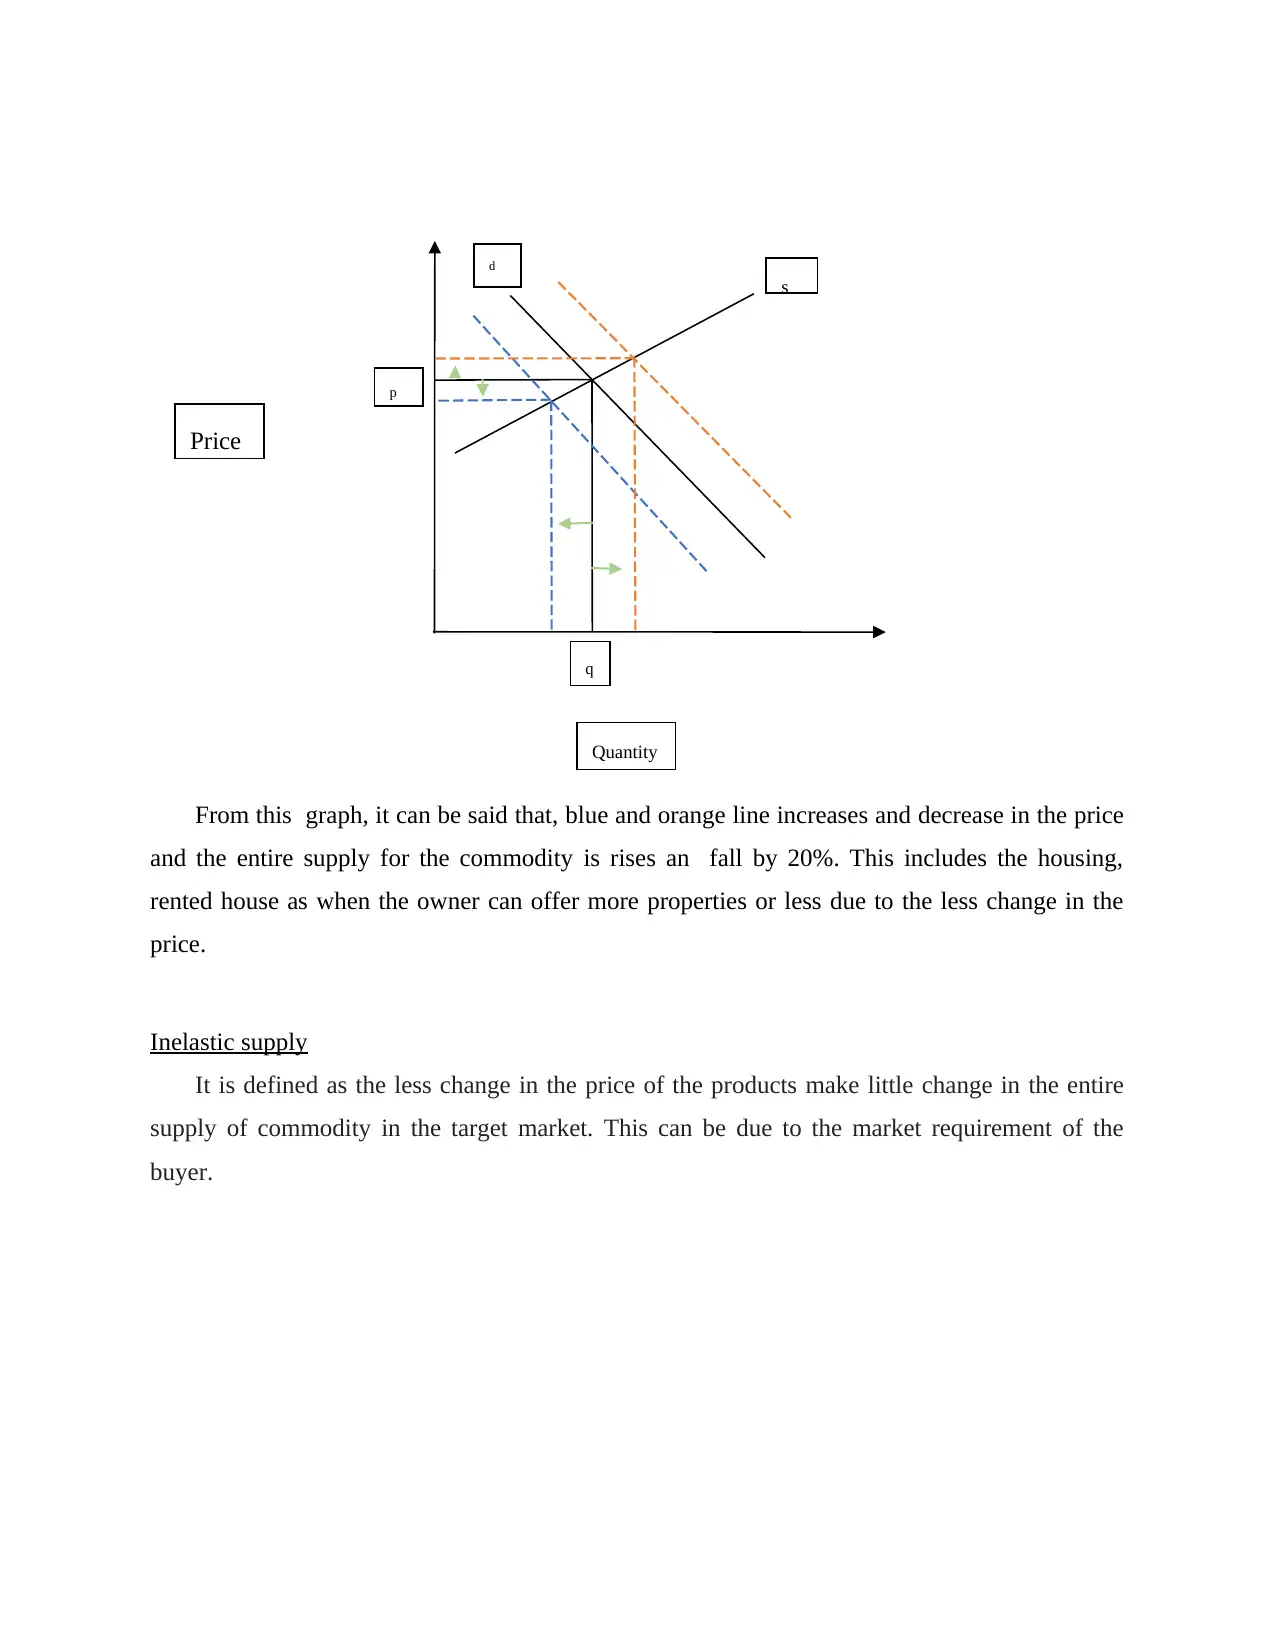
From this graph, it can be said that, blue and orange line increases and decrease in the price
and the entire supply for the commodity is rises an fall by 20%. This includes the housing,
rented house as when the owner can offer more properties or less due to the less change in the
price.
Inelastic supply
It is defined as the less change in the price of the products make little change in the entire
supply of commodity in the target market. This can be due to the market requirement of the
buyer.
Price
d
s
p
Quantity
q
⊘ This is a preview!⊘
Do you want full access?
Subscribe today to unlock all pages.
Trusted by 1+ million students worldwide
1 out of 14
Related Documents


Your All-in-One AI-Powered Toolkit for Academic Success.
+13062052269
info@desklib.com
Available 24*7 on WhatsApp / Email
![[object Object]](/_next/static/media/star-bottom.7253800d.svg)
Unlock your academic potential
Copyright © 2020–2026 A2Z Services. All Rights Reserved. Developed and managed by ZUCOL.