Comprehensive Financial Analysis of Tesco for Potential Investors
VerifiedAdded on 2023/06/13
|8
|2075
|424
Report
AI Summary
This report provides a detailed financial analysis of Tesco, a FTSE350 constituent, aimed at potential investors. It interprets Tesco's income statement, balance sheet, and cash flow statement, evaluating profitability through ratios like net profit margin and ROCE. The analysis extends to dividend distribution, asset and liability values, and cash flow liquidity. Key findings include a high dividend payout ratio in 2021, indicating a focus on short-term share price boosts, and liquidity ratios suggesting potential short-term cash flow issues. Despite a decline in some performance metrics compared to the previous year, the report concludes that Tesco remains a potentially attractive investment due to improved net earnings and future growth prospects, as reflected in investor willingness to pay more for the company's shares. The report references various financial analysis resources to support its findings.
A REPORT FOR
POTENTIAL INVESTORS
OF THE COMPANY
(TESCO)
Table of Contents
POTENTIAL INVESTORS
OF THE COMPANY
(TESCO)
Table of Contents
Paraphrase This Document
Need a fresh take? Get an instant paraphrase of this document with our AI Paraphraser
INTRODUCTION...........................................................................................................................3
MAIN BODY...................................................................................................................................3
Basic interpretation of Tesco's financial statements....................................................................3
Profitability analysis of Tesco.....................................................................................................4
Analysis of Dividend distribution................................................................................................5
Analysis of value of assets and liabilities....................................................................................6
Analysis of cash flow of the company.........................................................................................6
Attractiveness of the company as future investment alternative.................................................6
CONCLUSION................................................................................................................................7
REFERENCES................................................................................................................................1
INTRODUCTION
The present report is based on Tesco, a publicly listed company which is also a
constituent of FTSE350 index. Tesco is a supermarket giant based in UK. The report will analyse
financial statements of the company which involves balance sheet, income statement and cash
flow statement. Whatever information will be gathered from these financial statements, the
analysis of company's profitability, dividend distribution, value of assets and liabilities and cash
flows will be done. Furthermore, as the report is meant for potential investors, with the help of
evaluation of company's share, potential investment opportunities will be identified for
suggesting future investment alternative.
MAIN BODY
Basic interpretation of Tesco's financial statements
Interpretation of income statement
In the year 2021, Tesco has generated £57887 million which cost around £53538 million
to attain these sales and accordingly, a gross profit amounted to £3965 million has been earned
by the company. The gross profit figures for the current year are less than what has been
achieved in the year 2020 that is, £58091 million sales has been generated against the cost of
£53810 million and as a result, gross profit of £4098 million has been earned by the company in
previous (Vernimmen, Quiry and Le Fur, 2022).
By reducing the administrative expenses amounted to 2229 million in 2021 and 1892 in
2020, operating profit of £1736 million and £2206 million has been obtained for both the years
respectively. From this operating income, non-operating expenses such as finance cost (£952
million) and non-operating income such as finance income (£41 million) has been subtracted and
added to the operation income to get profitability of the company before tax that is, £825 million
for the year 2021 (Benrqya and Jabbouri, 2021). Furthermore, tax expenses borne by the
company amounted to £105 million has been subtracted from profit before tax in order to arrive
at profit from continuing operations which came out as £721 million. At last, by adjusting the
profit and loss from discontinued operations that is, profit of £5426 million, the net income of the
company came out as £6147 million for the year 2021.
Interpretation of Balance sheet
The balance that is taken into consideration is related to the reporting period ended on 27th
February 2021 where comparison has been done with the similar reporting periods which came
⊘ This is a preview!⊘
Do you want full access?
Subscribe today to unlock all pages.
Trusted by 1+ million students worldwide
prior to the current report period that is, 29 February 2020 and 23 February 2019 (Lokanan,
2021).
The total assets of the company has been identified as £45778 million which include
current assets and non-current assets amounted to £10807 million and £34971 million
respectively. On the other side, total liabilities of the company for the period ended 27th February
2021 has been identified as £33177 million, of which £15721 million belongs to current
liabilities and £17456 million belongs to non-current liabilities. Further, equity of the company is
constant from past three periods that is, 2019, 2020 and 2021 amounted to £490 million (Ren,
2021). However, retained earnings of the company has shown downfall continuously from last
three years that is, £4147 million to £4078 million to £3505 million in 2019, 2020 and 2021
respectively.
Interpretation of cash flow statement
The cash flow statement of the company shows that in the beginning, the company has £3031
million in hand as cash and cash equivalents.
Overall cash flows are derived through various activities which has been categorized into
three major categories that is, cash flow from operating activities, investing activities and
financing activities. Accordingly, the cash flow statement depicts that £602 million has been
brought into the business through the company's core operating activities. It is a better indicator
that net income derived from income statement because the latter includes non-cash earnings
which cannot be used for paying bills or debt that is outstanding (Lakshmi, 2021). Moreover,
investing activities has also generated a cash inflow of £6171 million which shows sales of
outdated assets of the business. Further, it has been found that the company has spent £7841
million towards it financing activities in which investors are usually interested in because it
indicates confidence of the company that is, whether the company is confident in its stock's
performance or it is dependent on its dividends for gaining investor's attention.
As a result, net decrease in cash flow of the company at the year-end amounts to £1068
million and the balance with the company at reporting date was £1978 million.
Profitability analysis of Tesco
With the help of following ratios, profitability of the company will be determined.
Ratios Formula 2020 2021
Paraphrase This Document
Need a fresh take? Get an instant paraphrase of this document with our AI Paraphraser
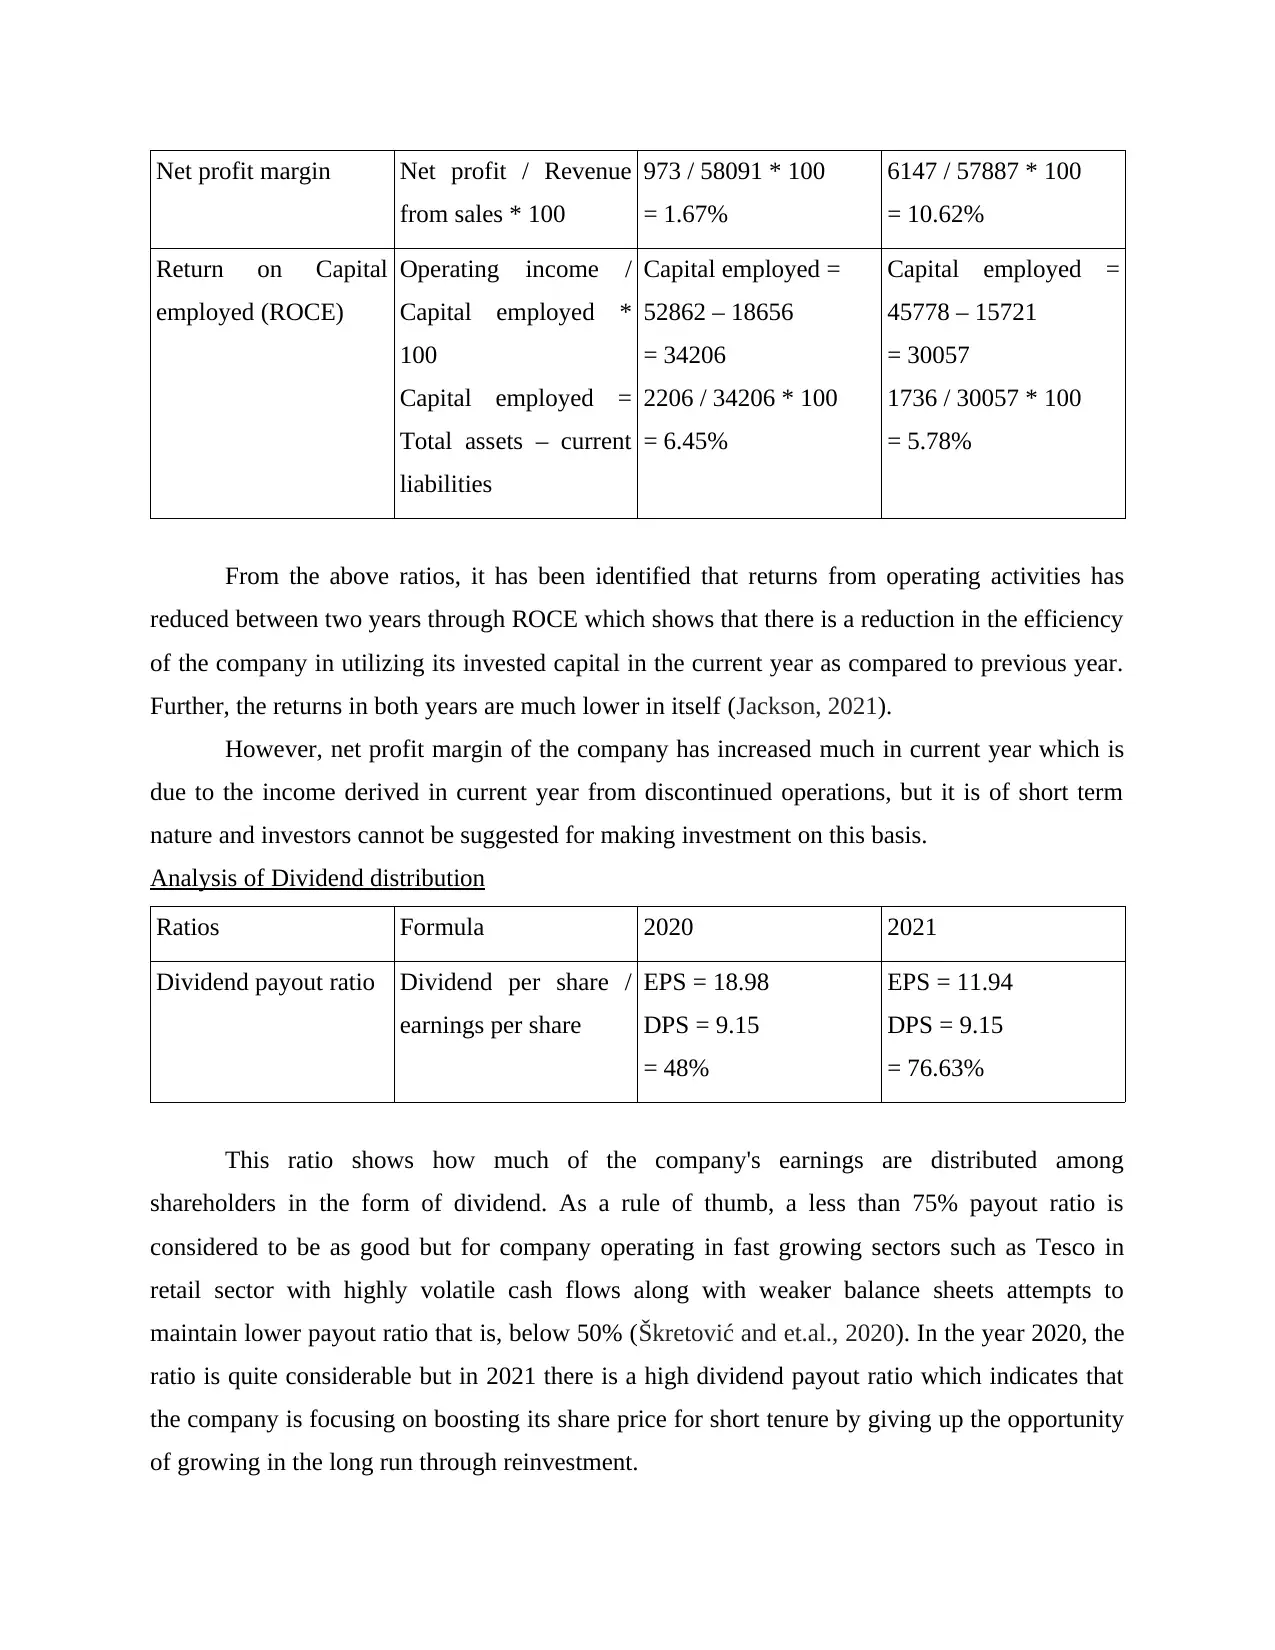
Net profit margin Net profit / Revenue
from sales * 100
973 / 58091 * 100
= 1.67%
6147 / 57887 * 100
= 10.62%
Return on Capital
employed (ROCE)
Operating income /
Capital employed *
100
Capital employed =
Total assets – current
liabilities
Capital employed =
52862 – 18656
= 34206
2206 / 34206 * 100
= 6.45%
Capital employed =
45778 – 15721
= 30057
1736 / 30057 * 100
= 5.78%
From the above ratios, it has been identified that returns from operating activities has
reduced between two years through ROCE which shows that there is a reduction in the efficiency
of the company in utilizing its invested capital in the current year as compared to previous year.
Further, the returns in both years are much lower in itself (Jackson, 2021).
However, net profit margin of the company has increased much in current year which is
due to the income derived in current year from discontinued operations, but it is of short term
nature and investors cannot be suggested for making investment on this basis.
Analysis of Dividend distribution
Ratios Formula 2020 2021
Dividend payout ratio Dividend per share /
earnings per share
EPS = 18.98
DPS = 9.15
= 48%
EPS = 11.94
DPS = 9.15
= 76.63%
This ratio shows how much of the company's earnings are distributed among
shareholders in the form of dividend. As a rule of thumb, a less than 75% payout ratio is
considered to be as good but for company operating in fast growing sectors such as Tesco in
retail sector with highly volatile cash flows along with weaker balance sheets attempts to
maintain lower payout ratio that is, below 50% (Škretović and et.al., 2020). In the year 2020, the
ratio is quite considerable but in 2021 there is a high dividend payout ratio which indicates that
the company is focusing on boosting its share price for short tenure by giving up the opportunity
of growing in the long run through reinvestment.
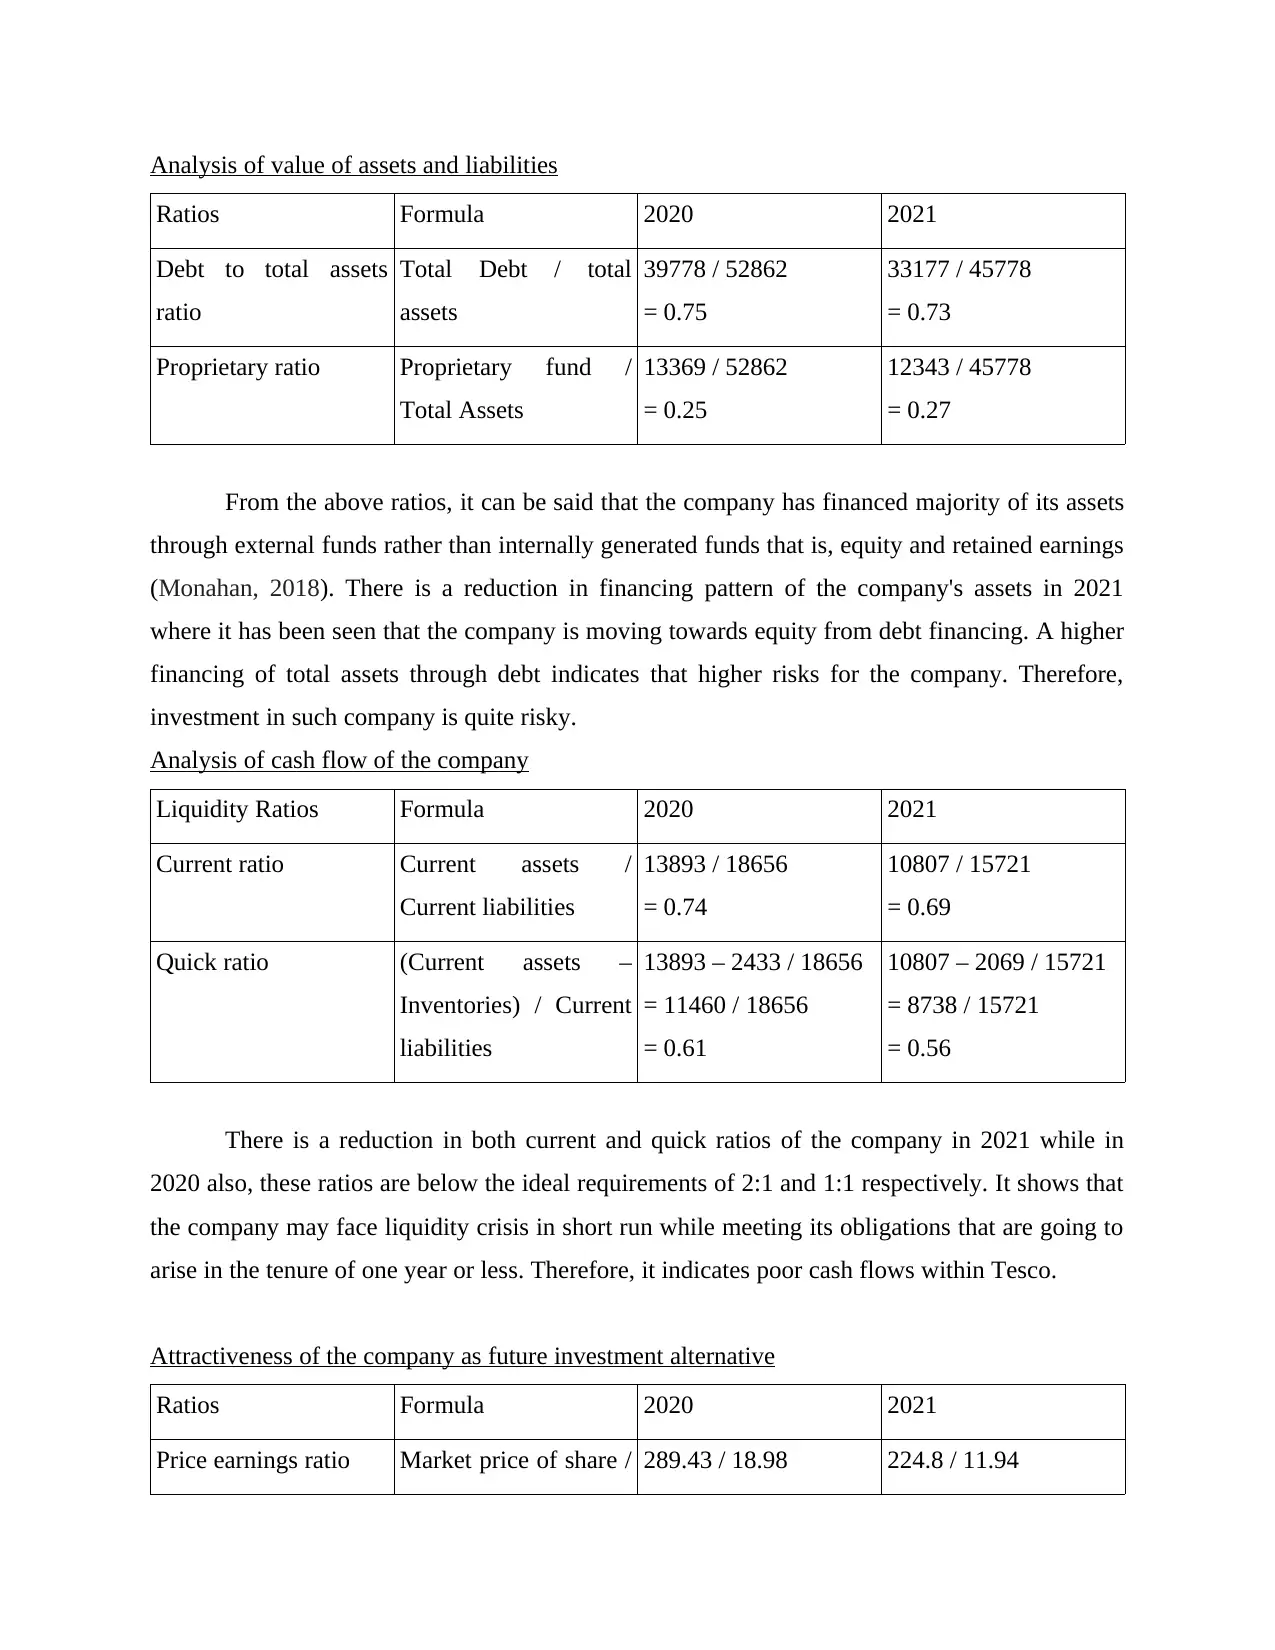
Analysis of value of assets and liabilities
Ratios Formula 2020 2021
Debt to total assets
ratio
Total Debt / total
assets
39778 / 52862
= 0.75
33177 / 45778
= 0.73
Proprietary ratio Proprietary fund /
Total Assets
13369 / 52862
= 0.25
12343 / 45778
= 0.27
From the above ratios, it can be said that the company has financed majority of its assets
through external funds rather than internally generated funds that is, equity and retained earnings
(Monahan, 2018). There is a reduction in financing pattern of the company's assets in 2021
where it has been seen that the company is moving towards equity from debt financing. A higher
financing of total assets through debt indicates that higher risks for the company. Therefore,
investment in such company is quite risky.
Analysis of cash flow of the company
Liquidity Ratios Formula 2020 2021
Current ratio Current assets /
Current liabilities
13893 / 18656
= 0.74
10807 / 15721
= 0.69
Quick ratio (Current assets –
Inventories) / Current
liabilities
13893 – 2433 / 18656
= 11460 / 18656
= 0.61
10807 – 2069 / 15721
= 8738 / 15721
= 0.56
There is a reduction in both current and quick ratios of the company in 2021 while in
2020 also, these ratios are below the ideal requirements of 2:1 and 1:1 respectively. It shows that
the company may face liquidity crisis in short run while meeting its obligations that are going to
arise in the tenure of one year or less. Therefore, it indicates poor cash flows within Tesco.
Attractiveness of the company as future investment alternative
Ratios Formula 2020 2021
Price earnings ratio Market price of share / 289.43 / 18.98 224.8 / 11.94
Ratios Formula 2020 2021
Debt to total assets
ratio
Total Debt / total
assets
39778 / 52862
= 0.75
33177 / 45778
= 0.73
Proprietary ratio Proprietary fund /
Total Assets
13369 / 52862
= 0.25
12343 / 45778
= 0.27
From the above ratios, it can be said that the company has financed majority of its assets
through external funds rather than internally generated funds that is, equity and retained earnings
(Monahan, 2018). There is a reduction in financing pattern of the company's assets in 2021
where it has been seen that the company is moving towards equity from debt financing. A higher
financing of total assets through debt indicates that higher risks for the company. Therefore,
investment in such company is quite risky.
Analysis of cash flow of the company
Liquidity Ratios Formula 2020 2021
Current ratio Current assets /
Current liabilities
13893 / 18656
= 0.74
10807 / 15721
= 0.69
Quick ratio (Current assets –
Inventories) / Current
liabilities
13893 – 2433 / 18656
= 11460 / 18656
= 0.61
10807 – 2069 / 15721
= 8738 / 15721
= 0.56
There is a reduction in both current and quick ratios of the company in 2021 while in
2020 also, these ratios are below the ideal requirements of 2:1 and 1:1 respectively. It shows that
the company may face liquidity crisis in short run while meeting its obligations that are going to
arise in the tenure of one year or less. Therefore, it indicates poor cash flows within Tesco.
Attractiveness of the company as future investment alternative
Ratios Formula 2020 2021
Price earnings ratio Market price of share / 289.43 / 18.98 224.8 / 11.94
⊘ This is a preview!⊘
Do you want full access?
Subscribe today to unlock all pages.
Trusted by 1+ million students worldwide
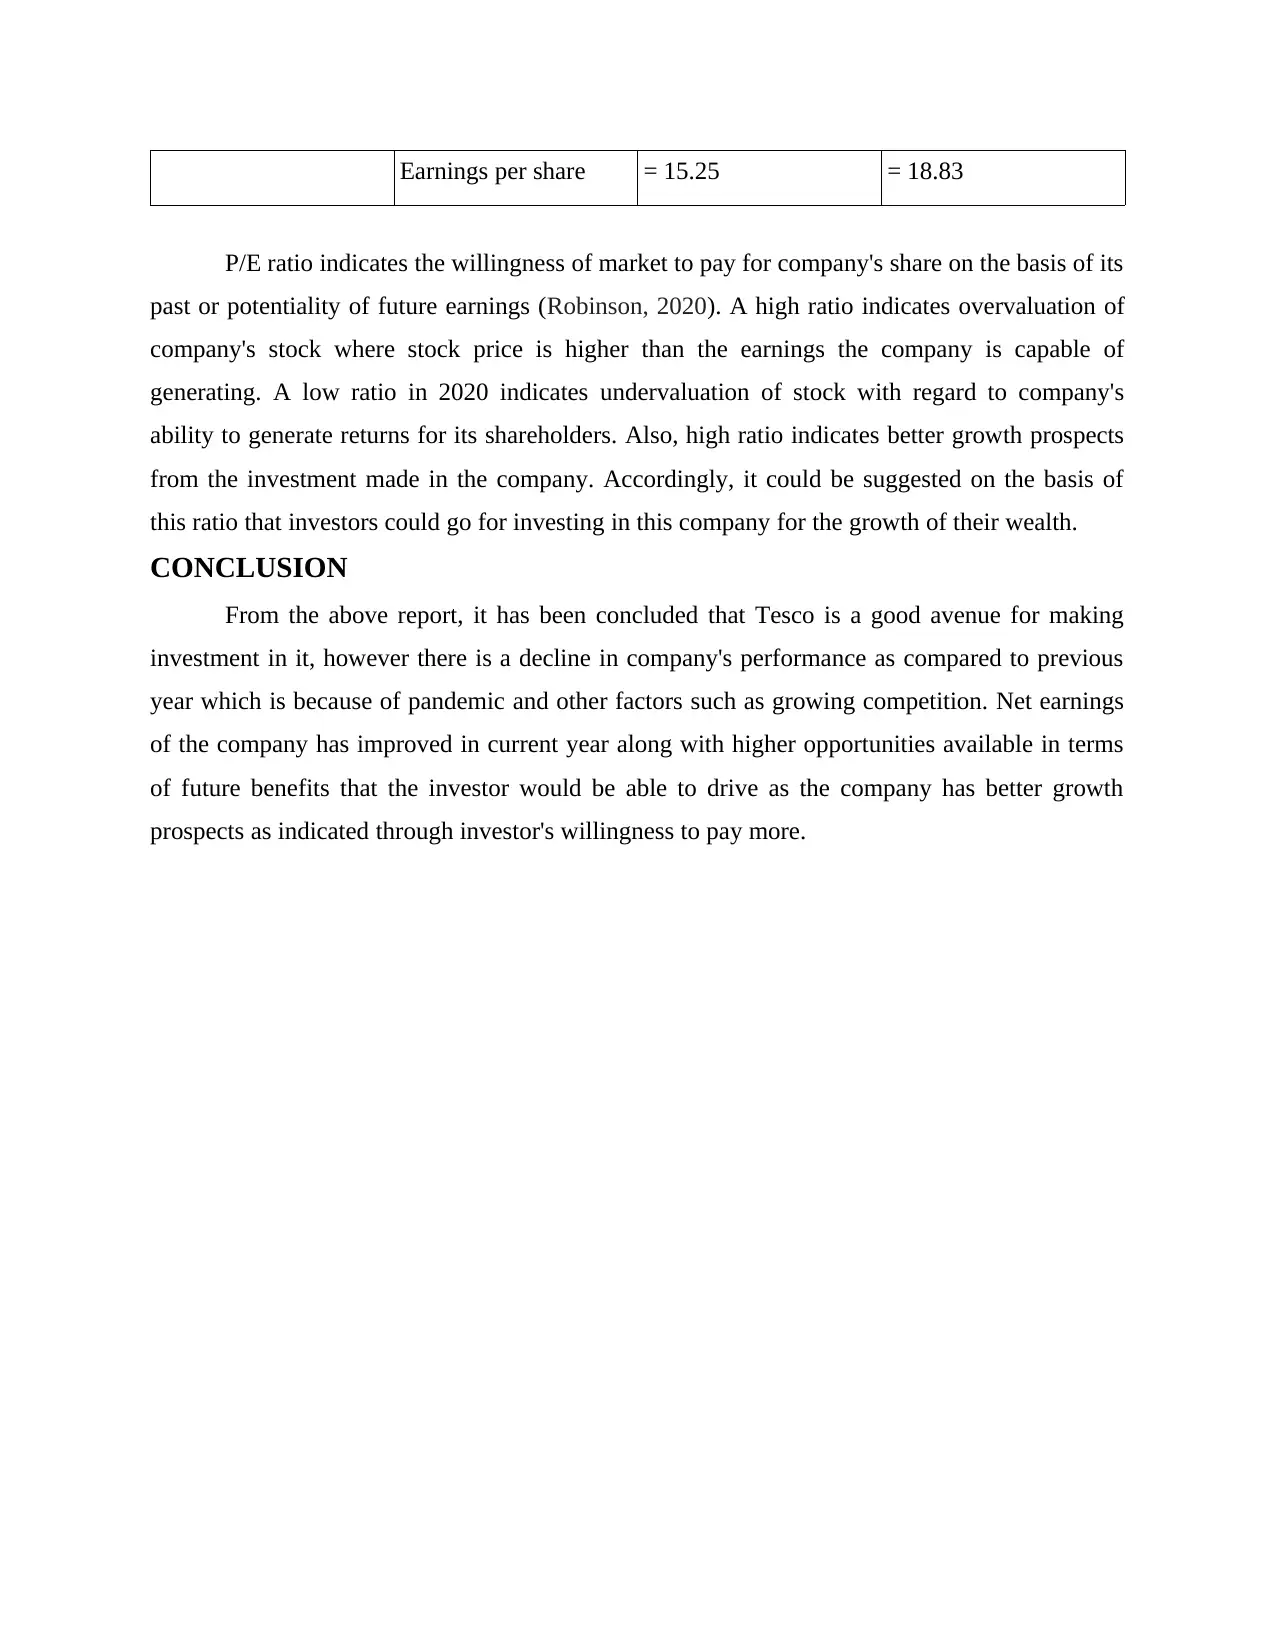
Earnings per share = 15.25 = 18.83
P/E ratio indicates the willingness of market to pay for company's share on the basis of its
past or potentiality of future earnings (Robinson, 2020). A high ratio indicates overvaluation of
company's stock where stock price is higher than the earnings the company is capable of
generating. A low ratio in 2020 indicates undervaluation of stock with regard to company's
ability to generate returns for its shareholders. Also, high ratio indicates better growth prospects
from the investment made in the company. Accordingly, it could be suggested on the basis of
this ratio that investors could go for investing in this company for the growth of their wealth.
CONCLUSION
From the above report, it has been concluded that Tesco is a good avenue for making
investment in it, however there is a decline in company's performance as compared to previous
year which is because of pandemic and other factors such as growing competition. Net earnings
of the company has improved in current year along with higher opportunities available in terms
of future benefits that the investor would be able to drive as the company has better growth
prospects as indicated through investor's willingness to pay more.
Paraphrase This Document
Need a fresh take? Get an instant paraphrase of this document with our AI Paraphraser
REFERENCES
Robinson, T. R., 2020. International financial statement analysis. John Wiley & Sons.
Monahan, S. J., 2018. Financial statement analysis and earnings forecasting. Foundations and
Trends® in Accounting, 12(2), pp.105-215.
Jackson, A. B., 2021. Financial statement analysis: a review and current issues. China Finance
Review International.
Lakshmi, S. V., 2021. Financial Statement Analysis of Tata Consultancy Services Limited. IUP
Journal of Accounting Research & Audit Practices, 20(4), pp.515-521.
Lokanan, M., 2021. Applying Four Quantitative Prediction Techniques to Detect Fraud in
Financial Statements. Journal of Forensic and Investigative Accounting, 13(2).
Ren, J., 2021, December. The Research of Tesco’s Current Investment Portfolio and Some
Recommendations. In 2021 3rd International Conference on Economic Management
and Cultural Industry (ICEMCI 2021) (pp. 1461-1465). Atlantis Press.
Benrqya, Y. and Jabbouri, I., 2021. Performance evaluation of European grocery retailers: a
financial statement analysis. International Journal of Logistics Economics and
Globalisation, 9(1), pp.24-39.
Vernimmen, P., Quiry, P. and Le Fur, Y., 2022. Corporate finance: theory and practice. John
Wiley & Sons.
Škretović, N., and et.al., 2020, May. FINANCIAL ANALYSIS IMPLICATIONS FROM
CORPORATE MANAGEMENT BASIS. In EASTERN EUROPEAN CONFERENCE
OF MANAGEMENT AND ECONOMICS (p. 99).
1
1 out of 8
Related Documents


Your All-in-One AI-Powered Toolkit for Academic Success.
+13062052269
info@desklib.com
Available 24*7 on WhatsApp / Email
![[object Object]](/_next/static/media/star-bottom.7253800d.svg)
Unlock your academic potential
Copyright © 2020–2026 A2Z Services. All Rights Reserved. Developed and managed by ZUCOL.