Comprehensive Analysis of Uber Taxi Usage: A Business Research Report

Verified

Added on  2023/01/04

|21
|2807
|37
Report
AI Summary
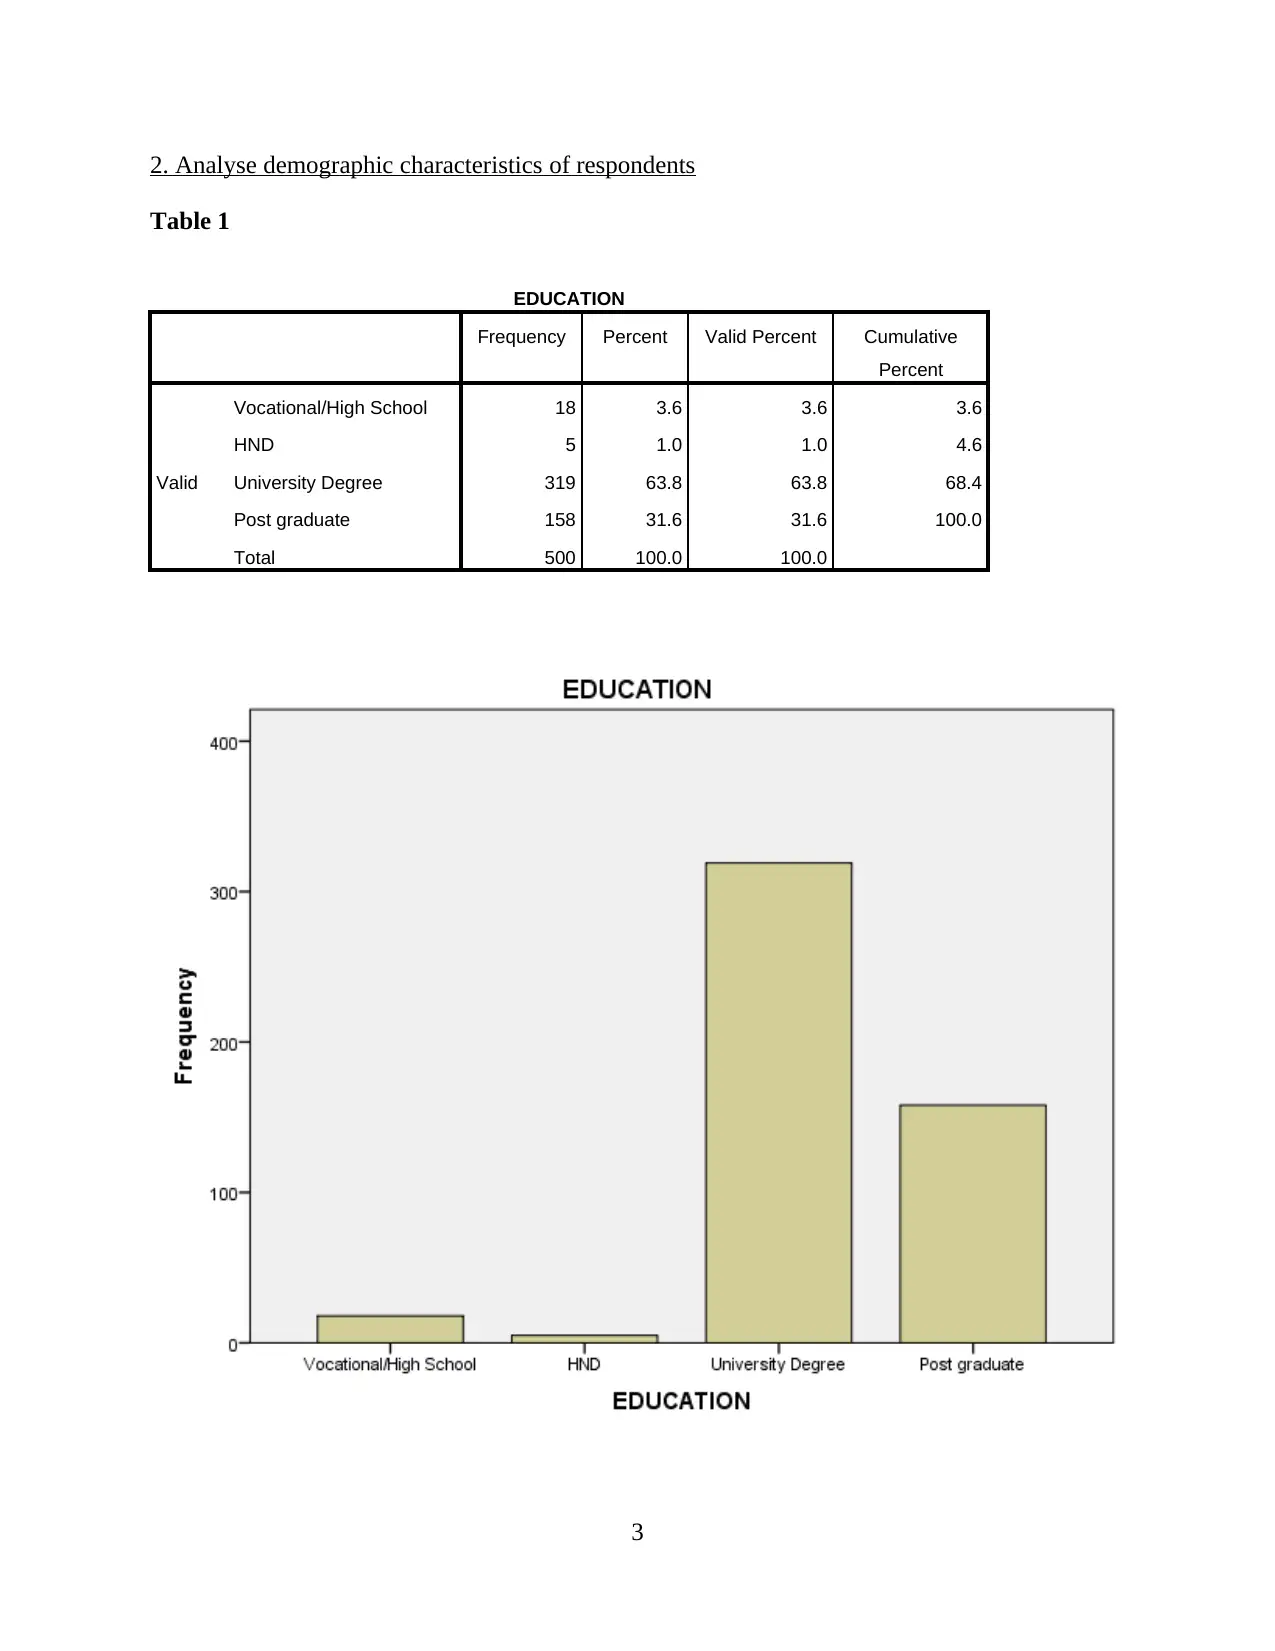
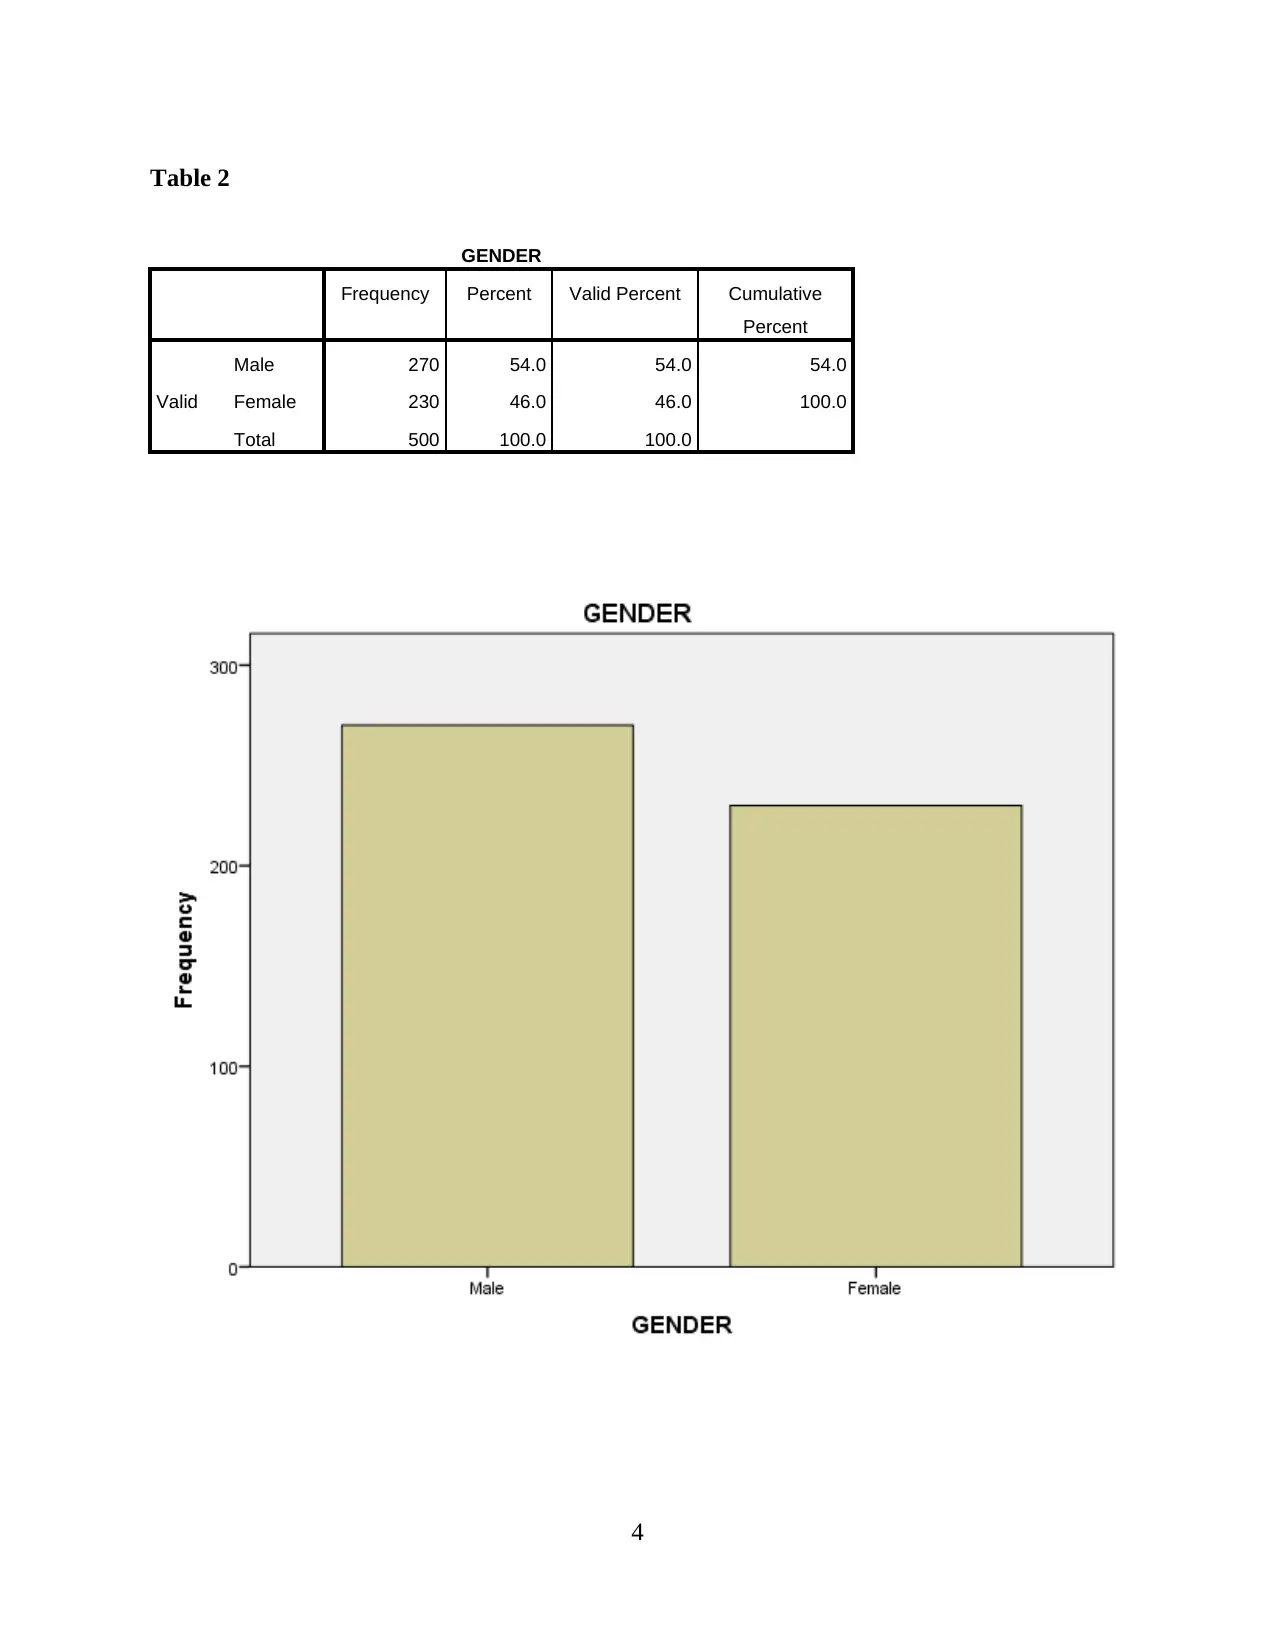
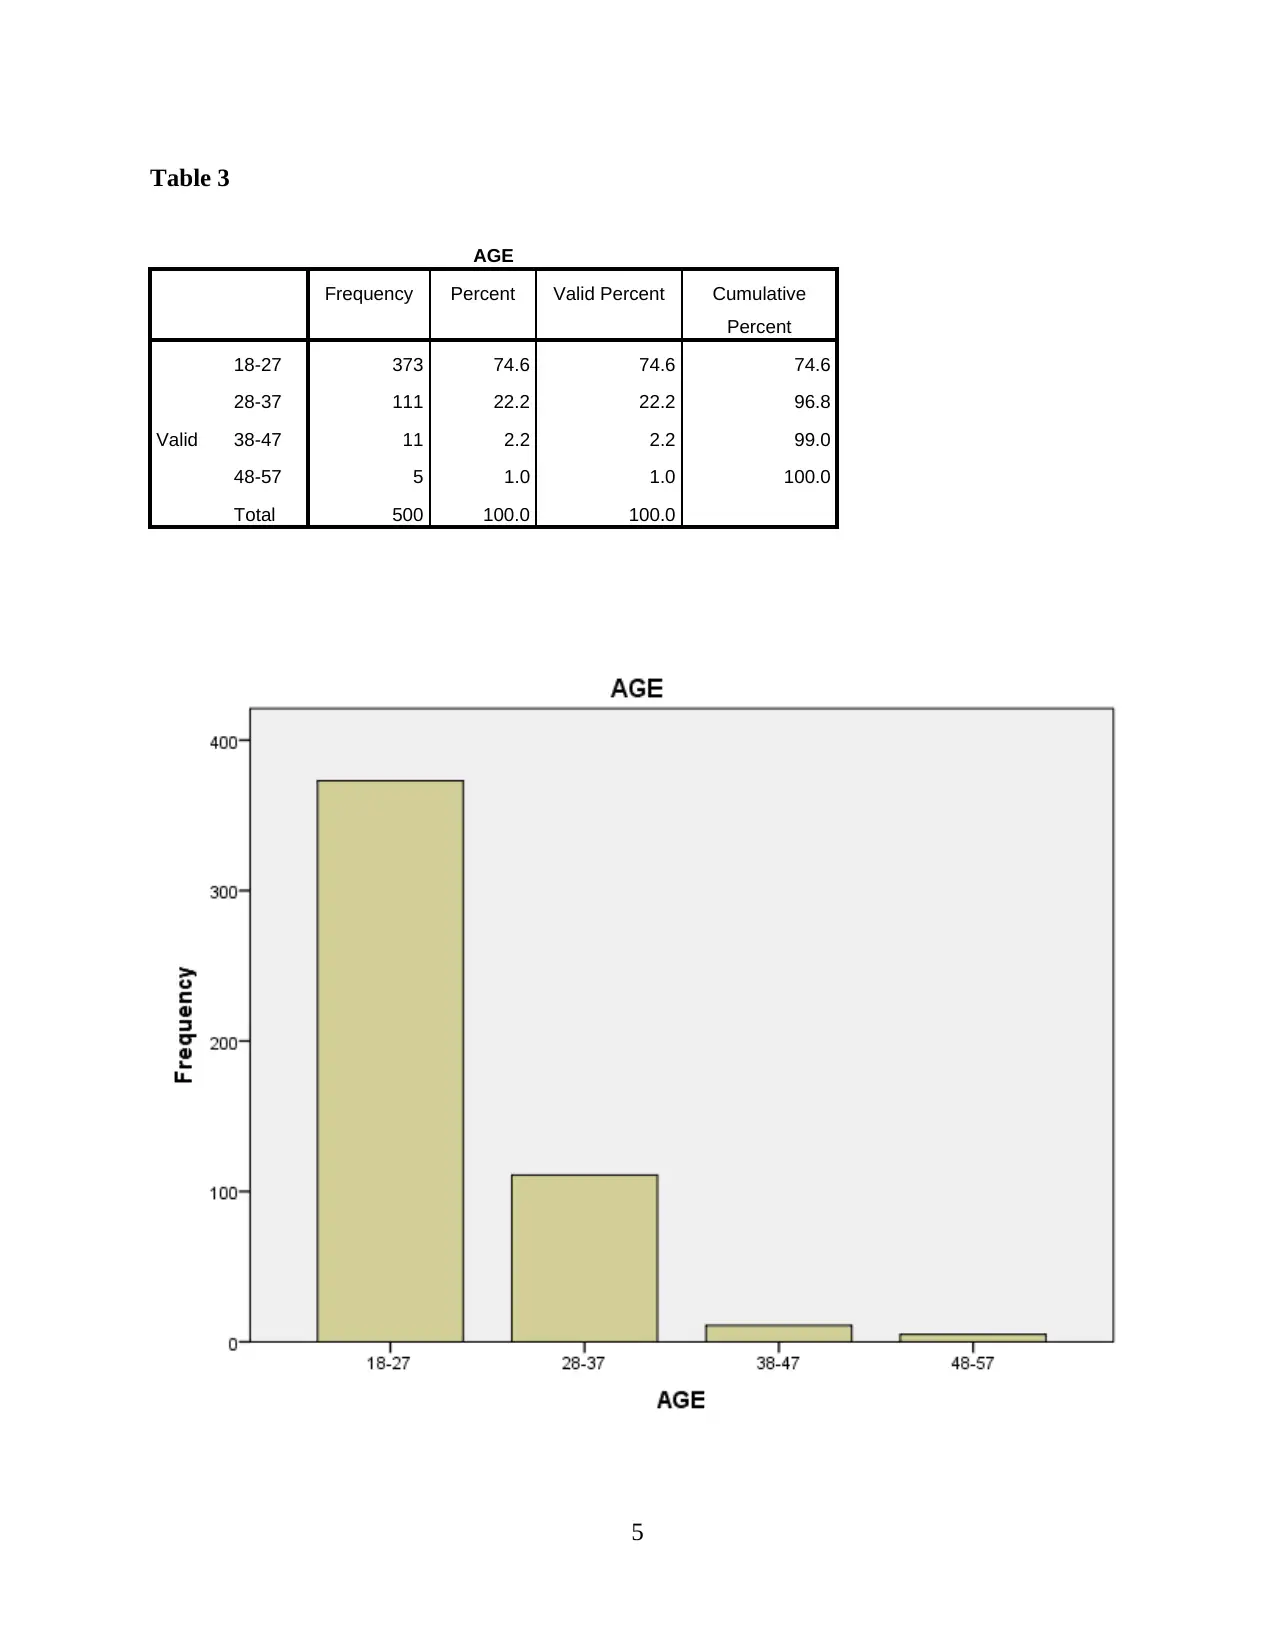
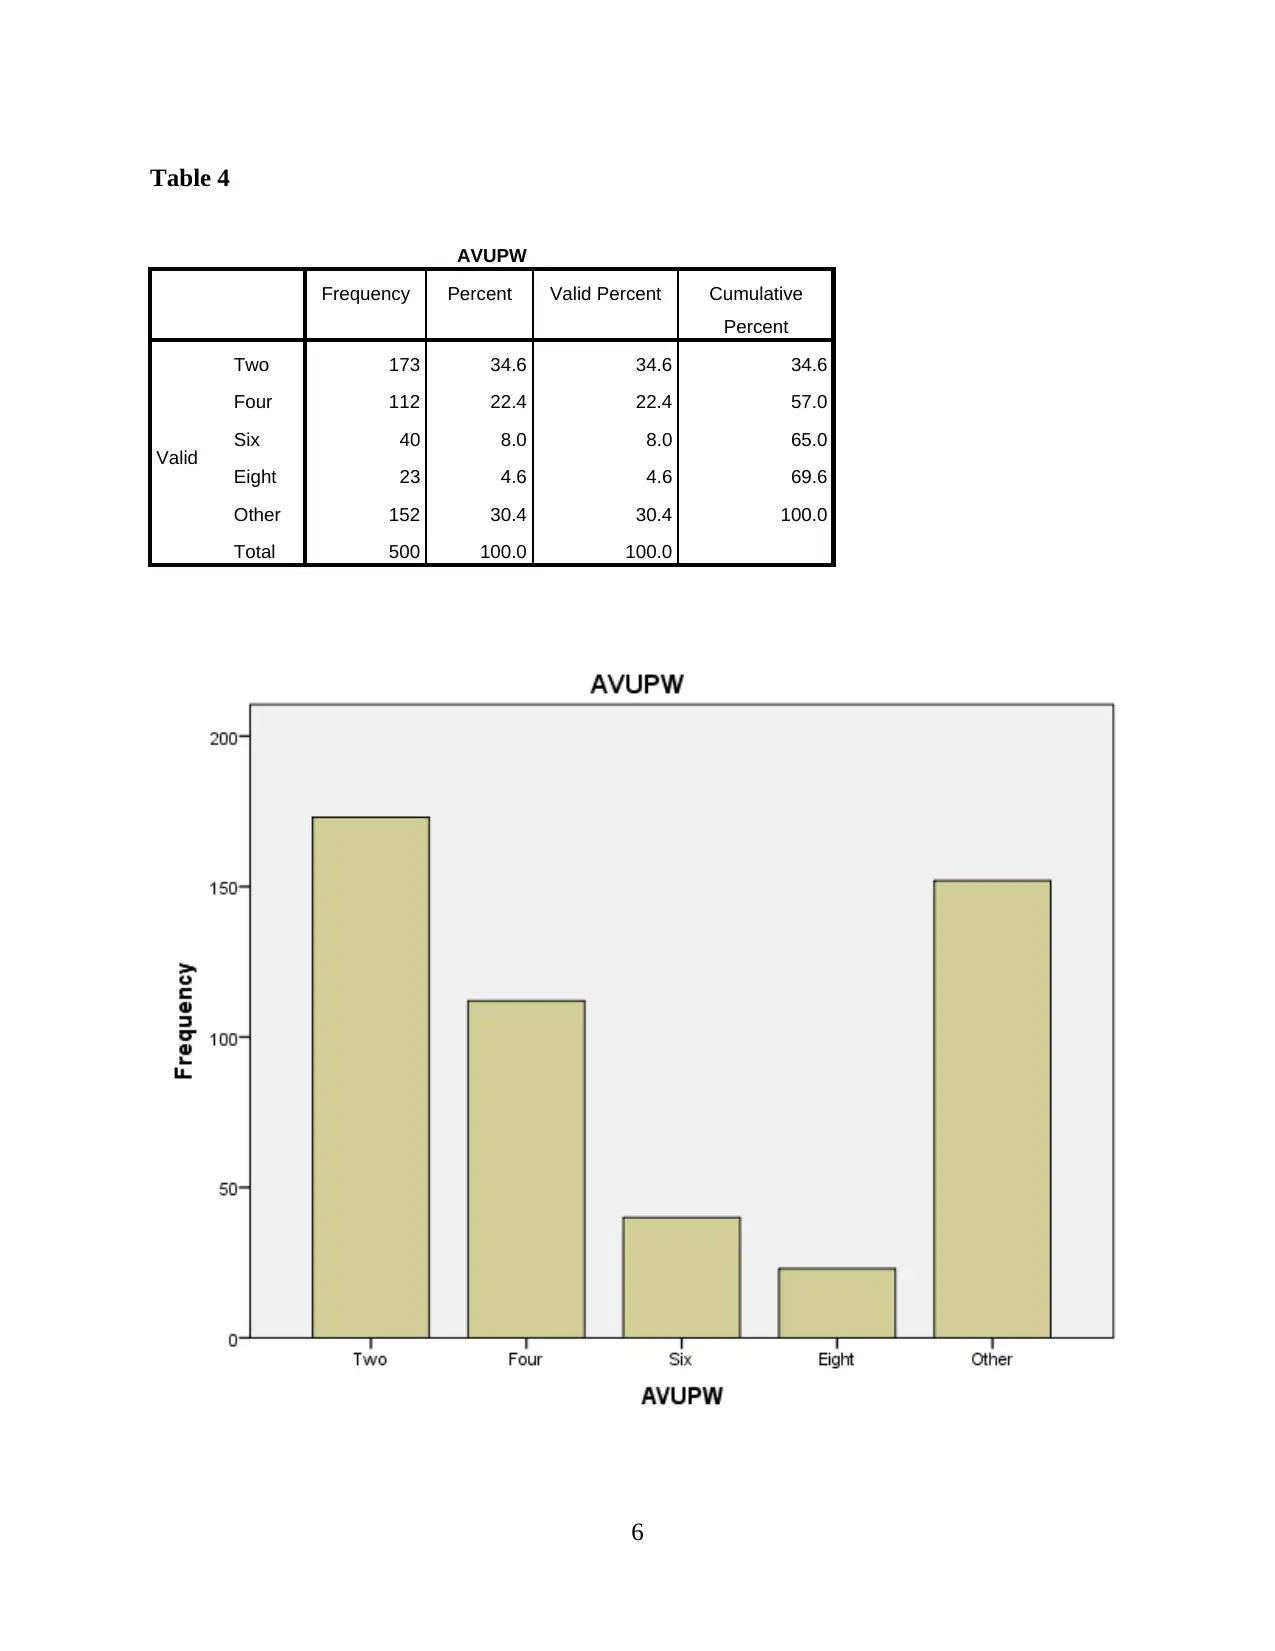
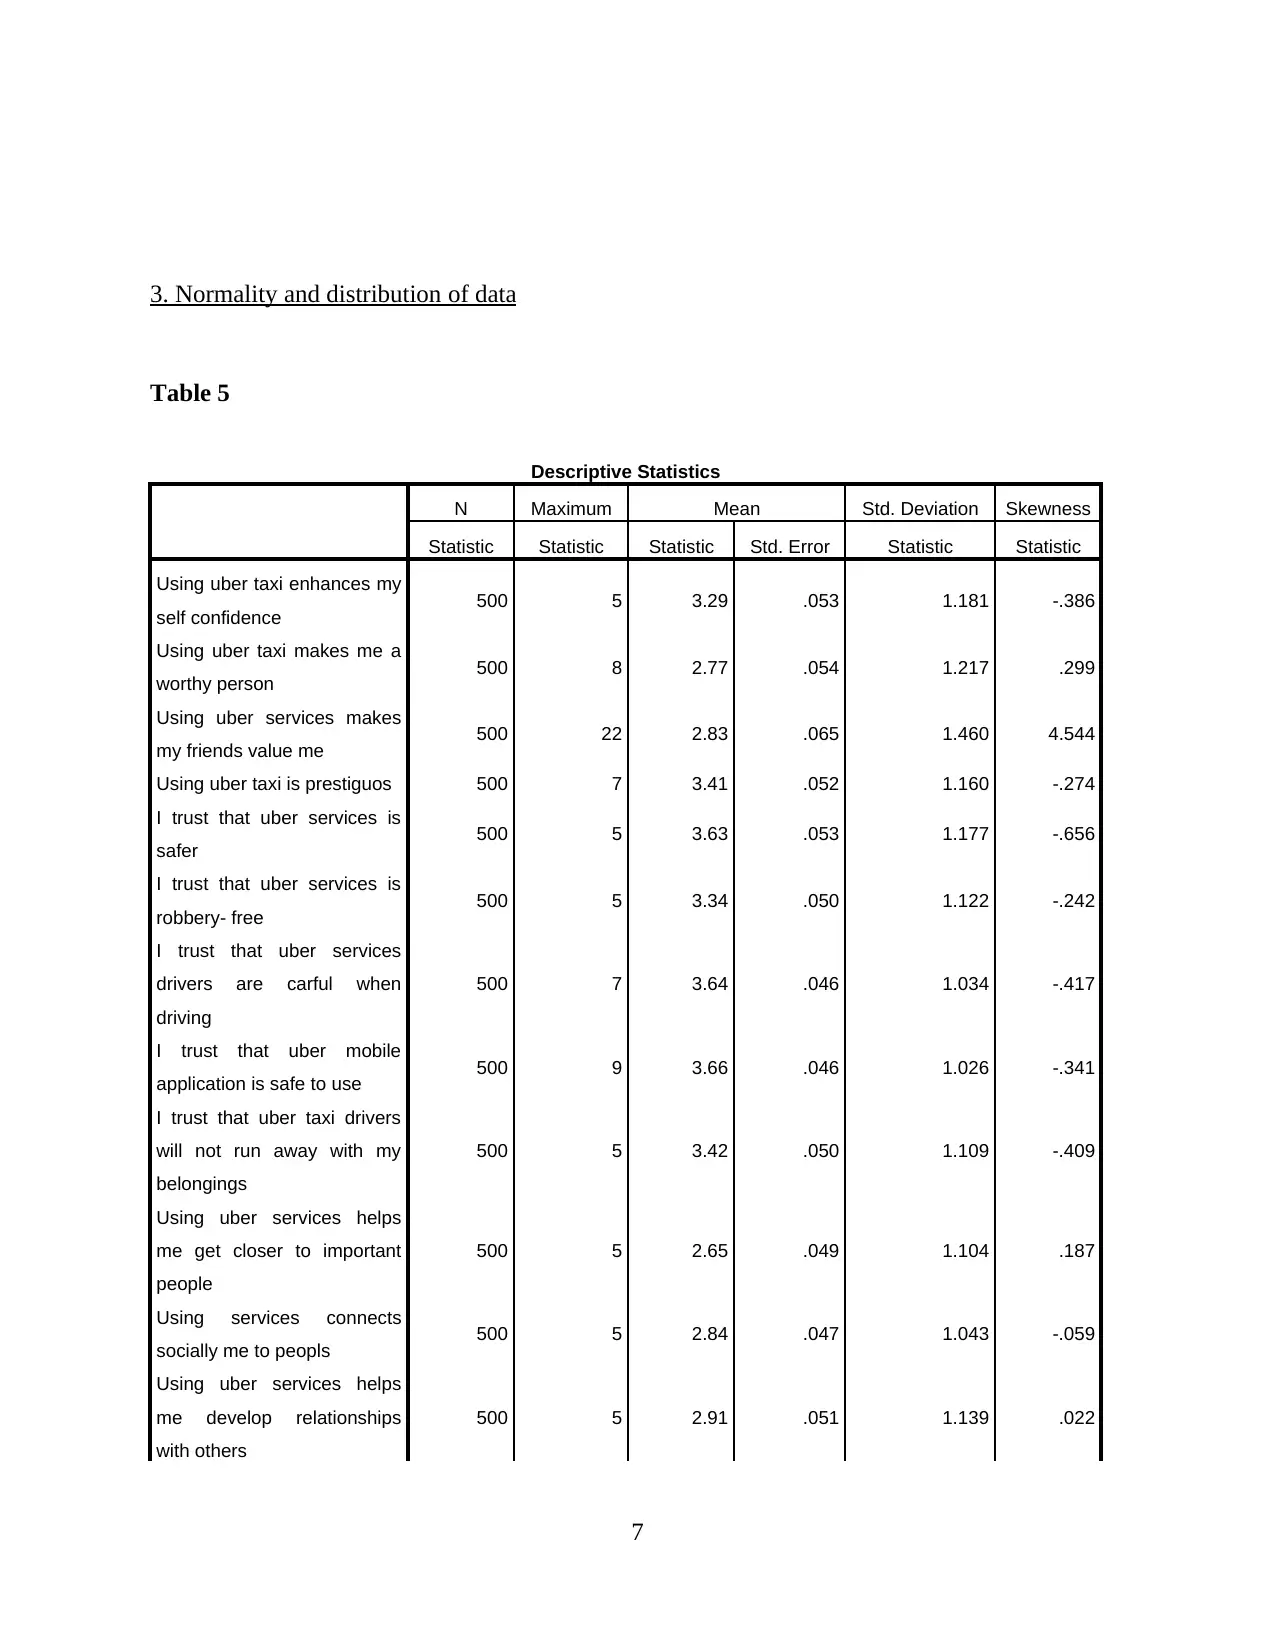
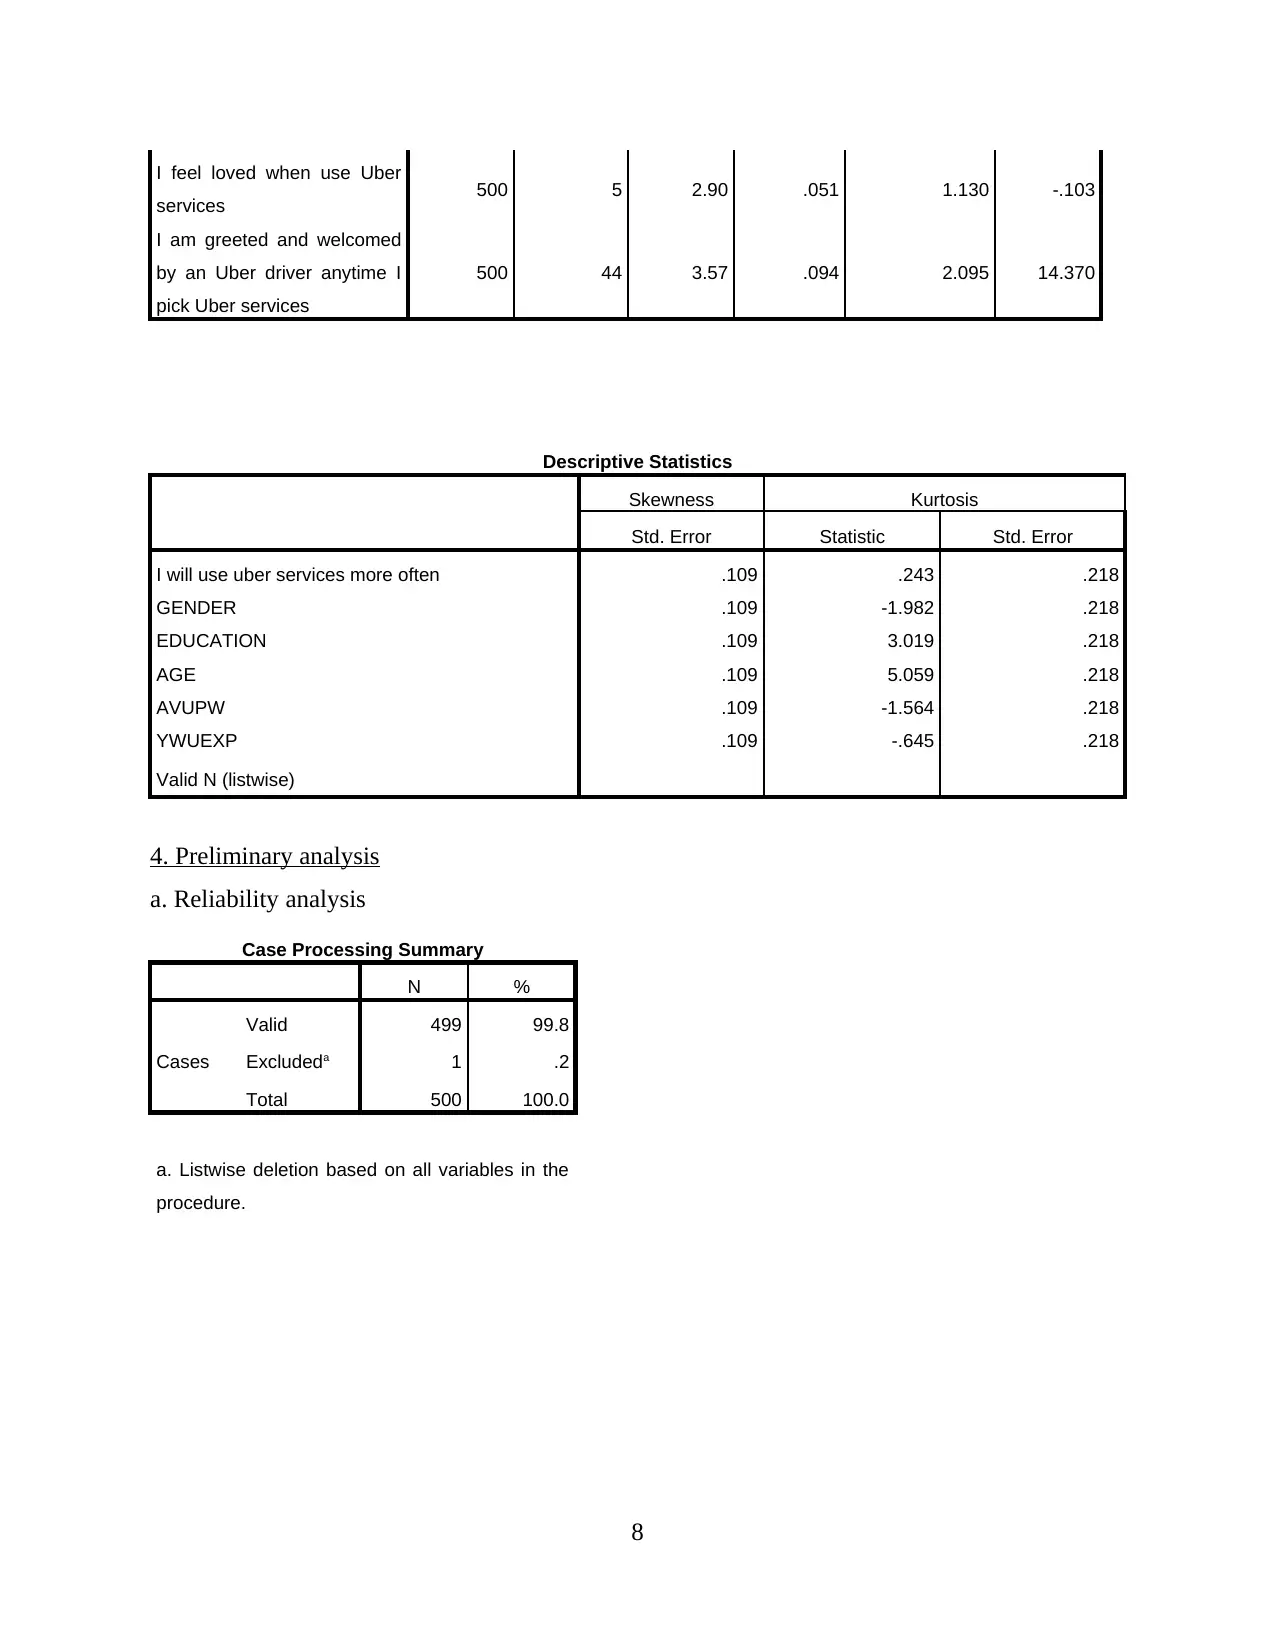
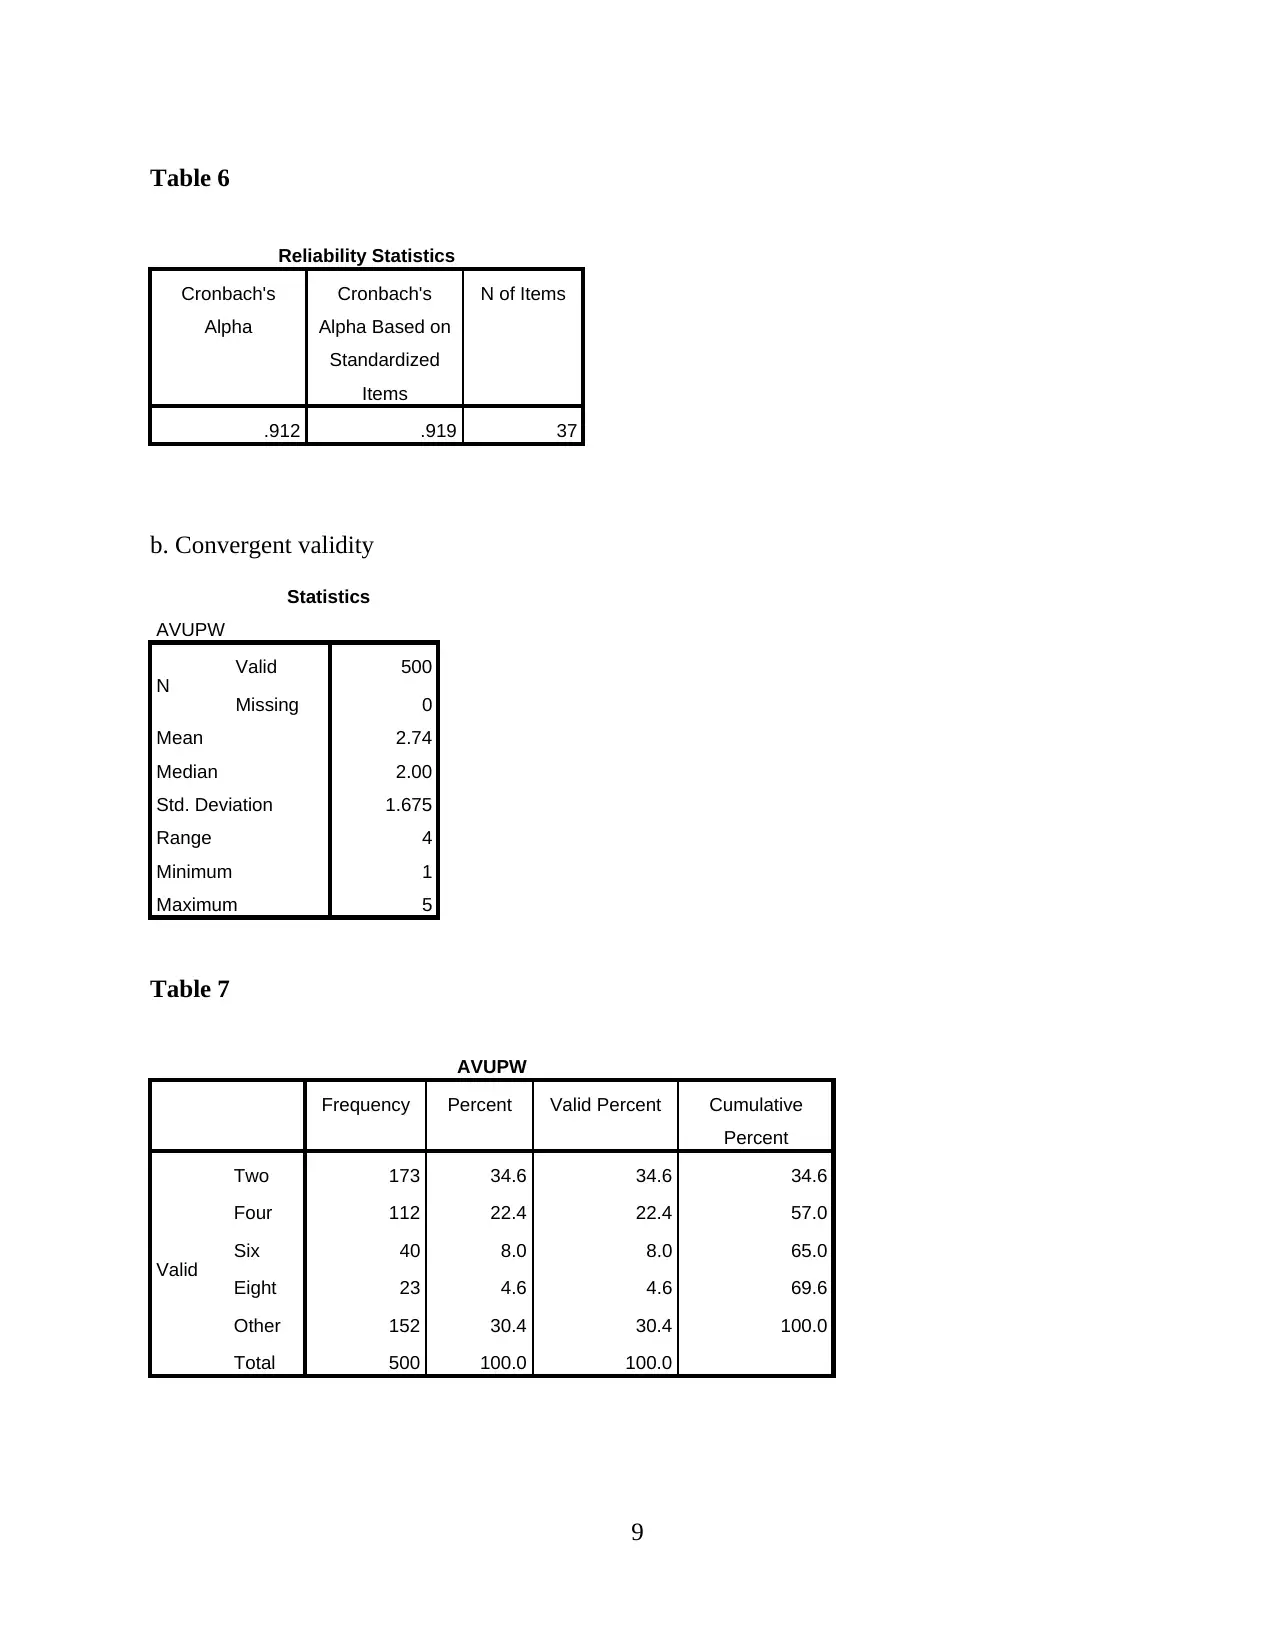
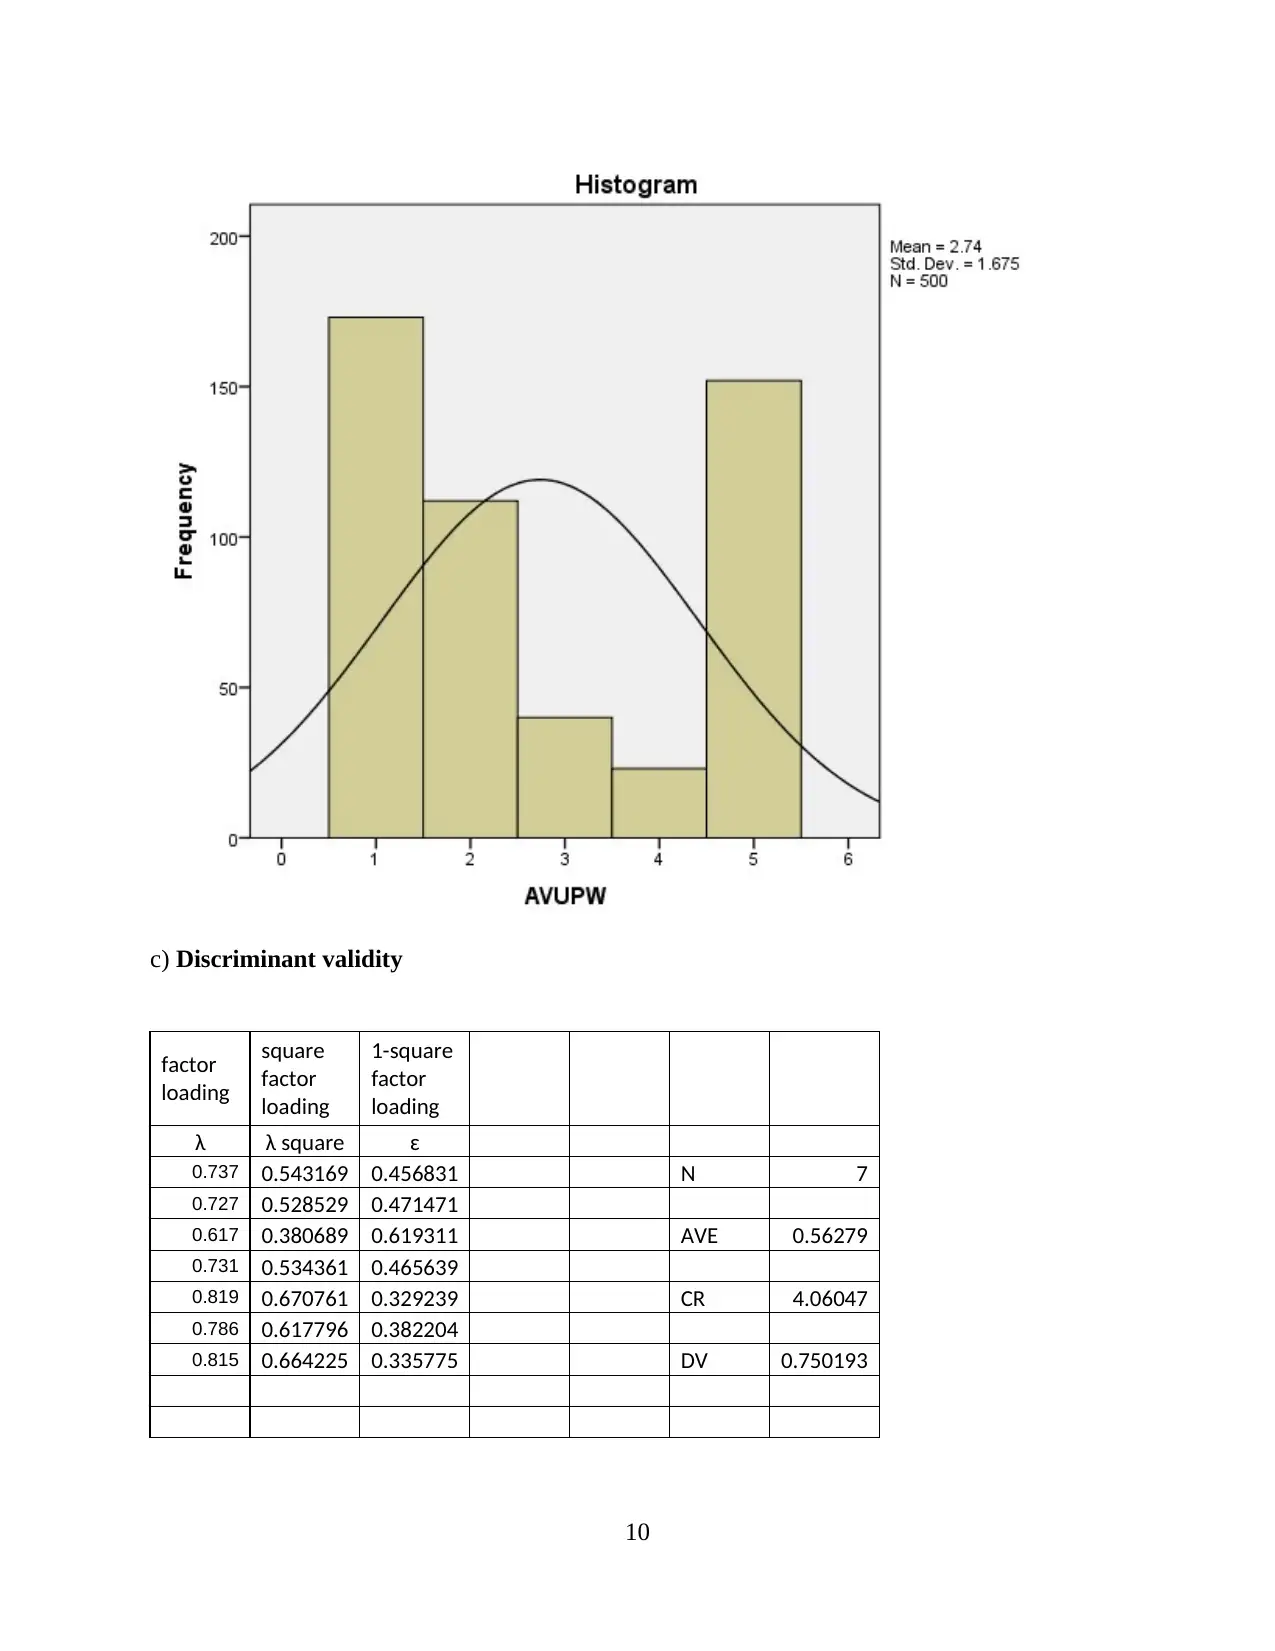
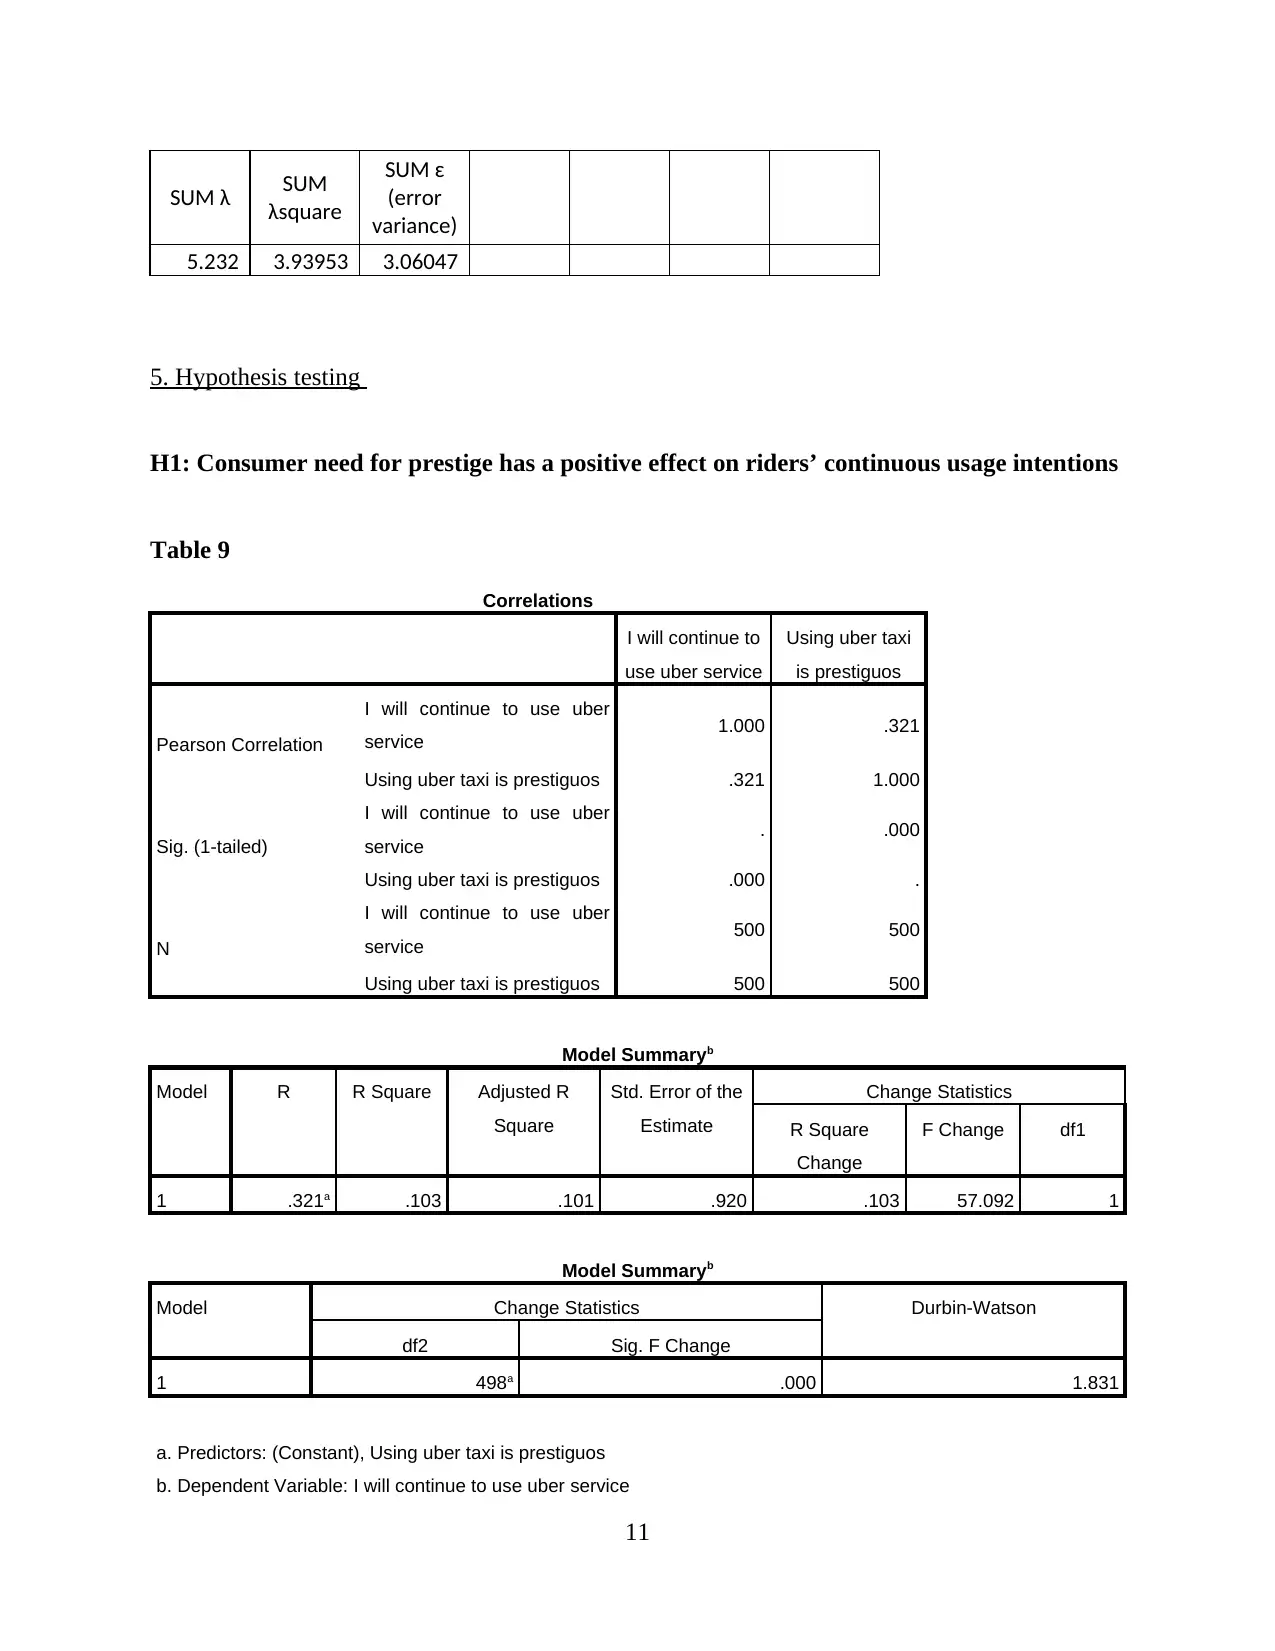
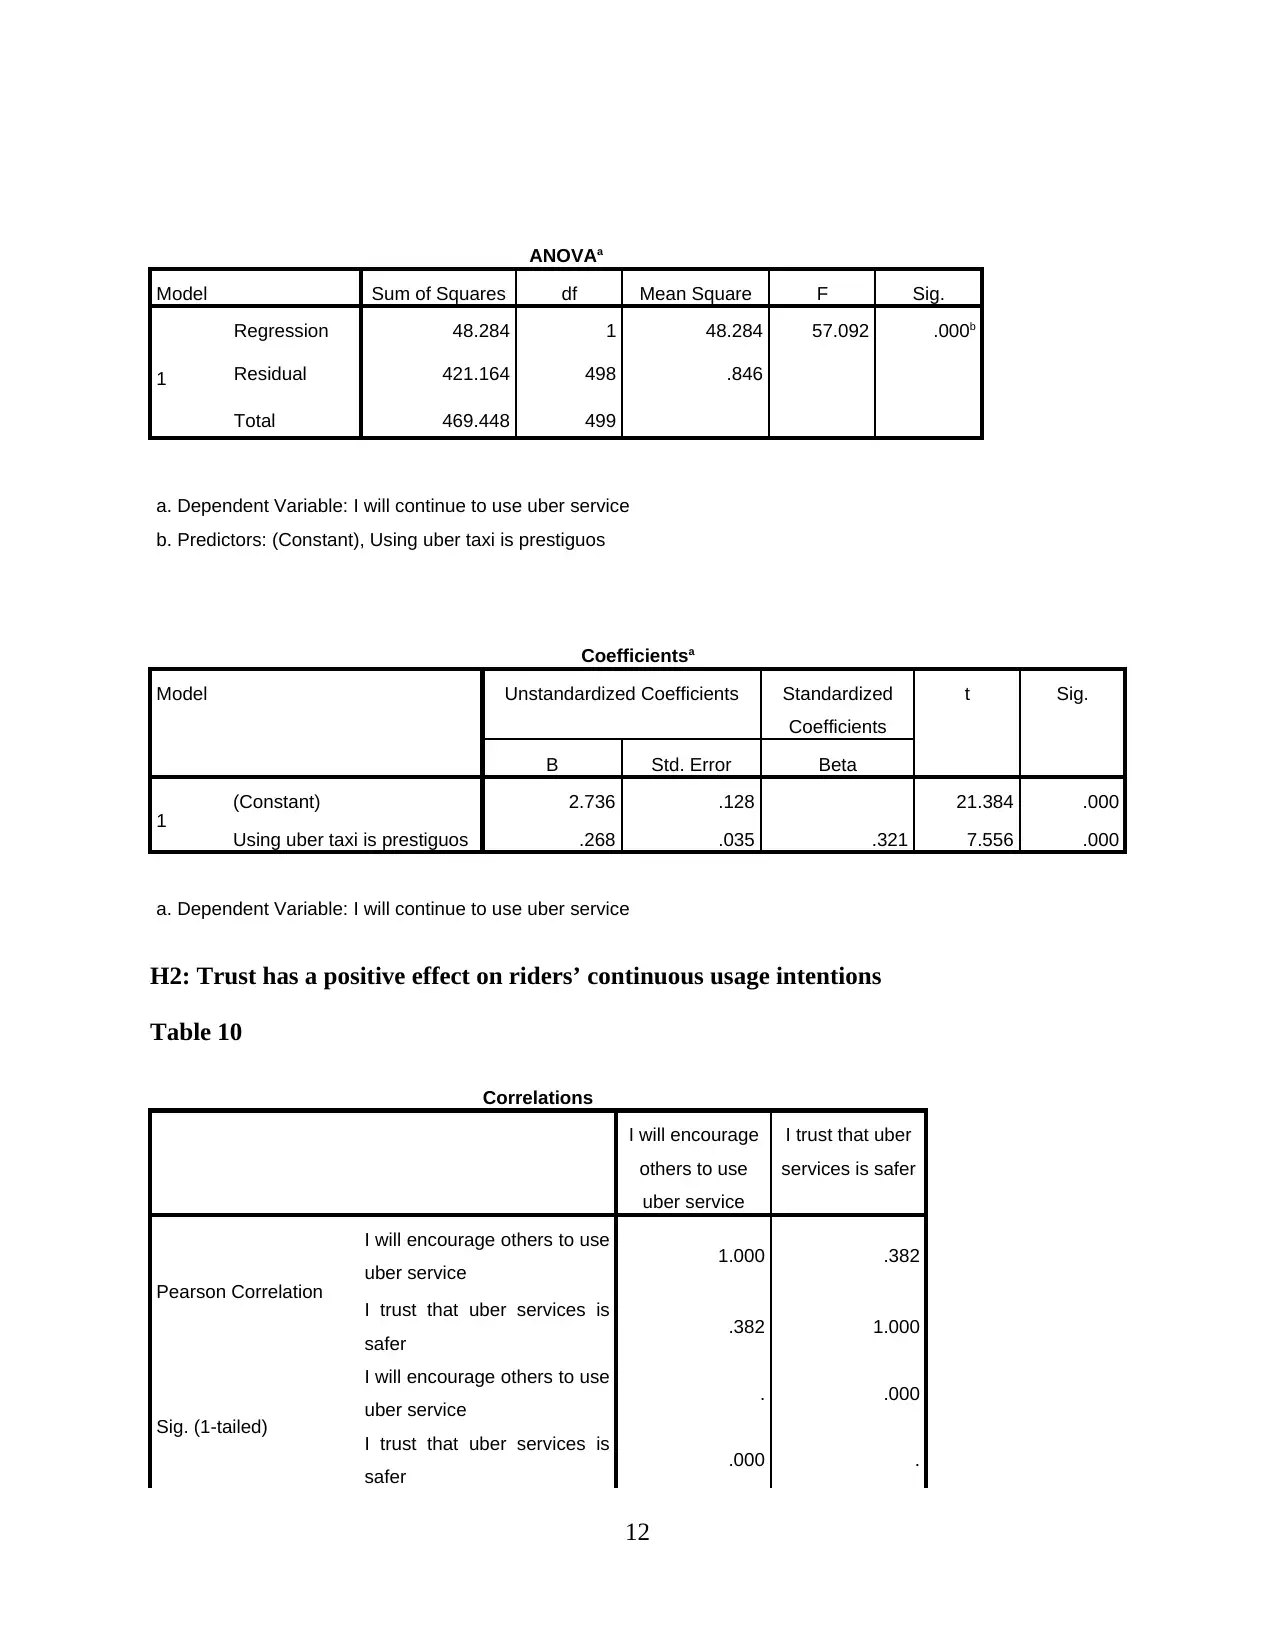
This report presents a comprehensive analysis of Uber taxi usage, based on a survey of 500 respondents. The analysis begins with an examination of demographic characteristics such as education, gender, age, and average weekly usage. Descriptive statistics, including mean, standard deviation, and skewness, are provided to understand data distribution. Reliability and validity analyses are performed to ensure the robustness of the data. The report then delves into hypothesis testing, exploring the relationships between consumer need for prestige, trust, customer return investment, convenience, and search benefits on riders' continuous usage intentions. Correlations, model summaries, ANOVAs, and coefficients are presented to support the findings. The report concludes with an interpretation of the key findings, drawing conclusions about the factors that influence Uber usage. The data reveals that the majority of the respondents are young, with a university degree and a slightly higher proportion of males. Key factors influencing Uber usage include convenience, prestige, and trust. The study suggests that Uber's continued success depends on its ability to maintain these key factors.
Document Page
Business Research
Methodology and Data
Collection
1
tabler-icon-diamond-filled.svg

Paraphrase This Document

Need a fresh take? Get an instant paraphrase of this document with our AI Paraphraser
Document Page
Table of Contents
2. Analyse demographic characteristics of respondents..............................................................3
3. Normality and distribution of data...........................................................................................7
4. Preliminary analysis.................................................................................................................8
5. Hypothesis testing..................................................................................................................10
6. Interpretation findings...........................................................................................................18
REFERENCES..............................................................................................................................21
2
Document Page
2. Analyse demographic characteristics of respondents
Table 1
EDUCATION
Frequency Percent Valid Percent Cumulative
Percent
Valid
Vocational/High School 18 3.6 3.6 3.6
HND 5 1.0 1.0 4.6
University Degree 319 63.8 63.8 68.4
Post graduate 158 31.6 31.6 100.0
Total 500 100.0 100.0
3
Document Page
Table 2
GENDER
Frequency Percent Valid Percent Cumulative
Percent
Valid
Male 270 54.0 54.0 54.0
Female 230 46.0 46.0 100.0
Total 500 100.0 100.0
4
tabler-icon-diamond-filled.svg

Paraphrase This Document

Need a fresh take? Get an instant paraphrase of this document with our AI Paraphraser
Document Page
Table 3
AGE
Frequency Percent Valid Percent Cumulative
Percent
Valid
18-27 373 74.6 74.6 74.6
28-37 111 22.2 22.2 96.8
38-47 11 2.2 2.2 99.0
48-57 5 1.0 1.0 100.0
Total 500 100.0 100.0
5
Document Page
Table 4
AVUPW
Frequency Percent Valid Percent Cumulative
Percent
Valid
Two 173 34.6 34.6 34.6
Four 112 22.4 22.4 57.0
Six 40 8.0 8.0 65.0
Eight 23 4.6 4.6 69.6
Other 152 30.4 30.4 100.0
Total 500 100.0 100.0
6
Document Page
3. Normality and distribution of data
Table 5
Descriptive Statistics
N Maximum Mean Std. Deviation Skewness
Statistic Statistic Statistic Std. Error Statistic Statistic
Using uber taxi enhances my
self confidence 500 5 3.29 .053 1.181 -.386
Using uber taxi makes me a
worthy person 500 8 2.77 .054 1.217 .299
Using uber services makes
my friends value me 500 22 2.83 .065 1.460 4.544
Using uber taxi is prestiguos 500 7 3.41 .052 1.160 -.274
I trust that uber services is
safer 500 5 3.63 .053 1.177 -.656
I trust that uber services is
robbery- free 500 5 3.34 .050 1.122 -.242
I trust that uber services
drivers are carful when
driving
500 7 3.64 .046 1.034 -.417
I trust that uber mobile
application is safe to use 500 9 3.66 .046 1.026 -.341
I trust that uber taxi drivers
will not run away with my
belongings
500 5 3.42 .050 1.109 -.409
Using uber services helps
me get closer to important
people
500 5 2.65 .049 1.104 .187
Using services connects
socially me to peopls 500 5 2.84 .047 1.043 -.059
Using uber services helps
me develop relationships
with others
500 5 2.91 .051 1.139 .022
7
tabler-icon-diamond-filled.svg

Paraphrase This Document

Need a fresh take? Get an instant paraphrase of this document with our AI Paraphraser
Document Page
I feel loved when use Uber
services 500 5 2.90 .051 1.130 -.103
I am greeted and welcomed
by an Uber driver anytime I
pick Uber services
500 44 3.57 .094 2.095 14.370
Descriptive Statistics
Skewness Kurtosis
Std. Error Statistic Std. Error
I will use uber services more often .109 .243 .218
GENDER .109 -1.982 .218
EDUCATION .109 3.019 .218
AGE .109 5.059 .218
AVUPW .109 -1.564 .218
YWUEXP .109 -.645 .218
Valid N (listwise)
4. Preliminary analysis
a. Reliability analysis
Case Processing Summary
N %
Cases
Valid 499 99.8
Excludeda 1 .2
Total 500 100.0
a. Listwise deletion based on all variables in the
procedure.
8
Document Page
Table 6
Reliability Statistics
Cronbach's
Alpha
Cronbach's
Alpha Based on
Standardized
Items
N of Items
.912 .919 37
b. Convergent validity
Statistics
AVUPW
N Valid 500
Missing 0
Mean 2.74
Median 2.00
Std. Deviation 1.675
Range 4
Minimum 1
Maximum 5
Table 7
AVUPW
Frequency Percent Valid Percent Cumulative
Percent
Valid
Two 173 34.6 34.6 34.6
Four 112 22.4 22.4 57.0
Six 40 8.0 8.0 65.0
Eight 23 4.6 4.6 69.6
Other 152 30.4 30.4 100.0
Total 500 100.0 100.0
9
Document Page
c) Discriminant validity
factor
loading
square
factor
loading
1-square
factor
loading
λ λ square ɛ
0.737 0.543169 0.456831 N 7
0.727 0.528529 0.471471
0.617 0.380689 0.619311 AVE 0.56279
0.731 0.534361 0.465639
0.819 0.670761 0.329239 CR 4.06047
0.786 0.617796 0.382204
0.815 0.664225 0.335775 DV 0.750193
10
tabler-icon-diamond-filled.svg

Paraphrase This Document

Need a fresh take? Get an instant paraphrase of this document with our AI Paraphraser
Document Page
SUM λ SUM
λsquare
SUM ɛ
(error
variance)
5.232 3.93953 3.06047
5. Hypothesis testing
H1: Consumer need for prestige has a positive effect on riders’ continuous usage intentions
Table 9
Correlations
I will continue to
use uber service
Using uber taxi
is prestiguos
Pearson Correlation
I will continue to use uber
service 1.000 .321
Using uber taxi is prestiguos .321 1.000
Sig. (1-tailed)
I will continue to use uber
service . .000
Using uber taxi is prestiguos .000 .
N
I will continue to use uber
service 500 500
Using uber taxi is prestiguos 500 500
Model Summaryb
Model R R Square Adjusted R
Square
Std. Error of the
Estimate
Change Statistics
R Square
Change
F Change df1
1 .321a .103 .101 .920 .103 57.092 1
Model Summaryb
Model Change Statistics Durbin-Watson
df2 Sig. F Change
1 498a .000 1.831
a. Predictors: (Constant), Using uber taxi is prestiguos
b. Dependent Variable: I will continue to use uber service
11
Document Page
ANOVAa
Model Sum of Squares df Mean Square F Sig.
1
Regression 48.284 1 48.284 57.092 .000b
Residual 421.164 498 .846
Total 469.448 499
a. Dependent Variable: I will continue to use uber service
b. Predictors: (Constant), Using uber taxi is prestiguos
Coefficientsa
Model Unstandardized Coefficients Standardized
Coefficients
t Sig.
B Std. Error Beta
1 (Constant) 2.736 .128 21.384 .000
Using uber taxi is prestiguos .268 .035 .321 7.556 .000
a. Dependent Variable: I will continue to use uber service
H2: Trust has a positive effect on riders’ continuous usage intentions
Table 10
Correlations
I will encourage
others to use
uber service
I trust that uber
services is safer
Pearson Correlation
I will encourage others to use
uber service 1.000 .382
I trust that uber services is
safer .382 1.000
Sig. (1-tailed)
I will encourage others to use
uber service . .000
I trust that uber services is
safer .000 .
12
chevron_up_icon
1 out of 21
circle_padding
hide_on_mobile
zoom_out_icon
[object Object]