Unemployment in Australia: Causes, Policies, and Regional Analysis
VerifiedAdded on 2023/04/22
|13
|2179
|333
Report
AI Summary
This report provides a comprehensive analysis of unemployment within the Australian economy. It begins by explaining the concept of unemployment and its measurement, including the various methods used by the Australian Bureau of Statistics. The report then delves into the primary causes of unemployment in Australia, such as structural, frictional, and cyclical unemployment, providing specific examples to illustrate each type. Furthermore, it classifies and examines underemployment, analyzing its prevalence across different demographics and industries within the Australian labor market. The report also investigates the regional variations in unemployment rates across Australia, comparing states and territories and identifying the factors contributing to these disparities. Finally, the report concludes by outlining and evaluating policies that the Australian government can implement to effectively decrease unemployment rates, providing practical examples and recommendations based on the analysis.
Running head: ECONOMICS
Economics
Name of the Student
Name of the University
Course ID
Economics
Name of the Student
Name of the University
Course ID
Paraphrase This Document
Need a fresh take? Get an instant paraphrase of this document with our AI Paraphraser
1ECONOMICS
Table of Contents
Introduction................................................................................................................................2
Measurement of unemployment.................................................................................................2
Causes of unemployment in Australia.......................................................................................3
Underemployment in Australian economy................................................................................4
Reasons for variation in unemployment across different regions of Australia..........................7
Policies to decrease unemployment...........................................................................................9
Conclusion................................................................................................................................10
References................................................................................................................................11
2ECONOMICS
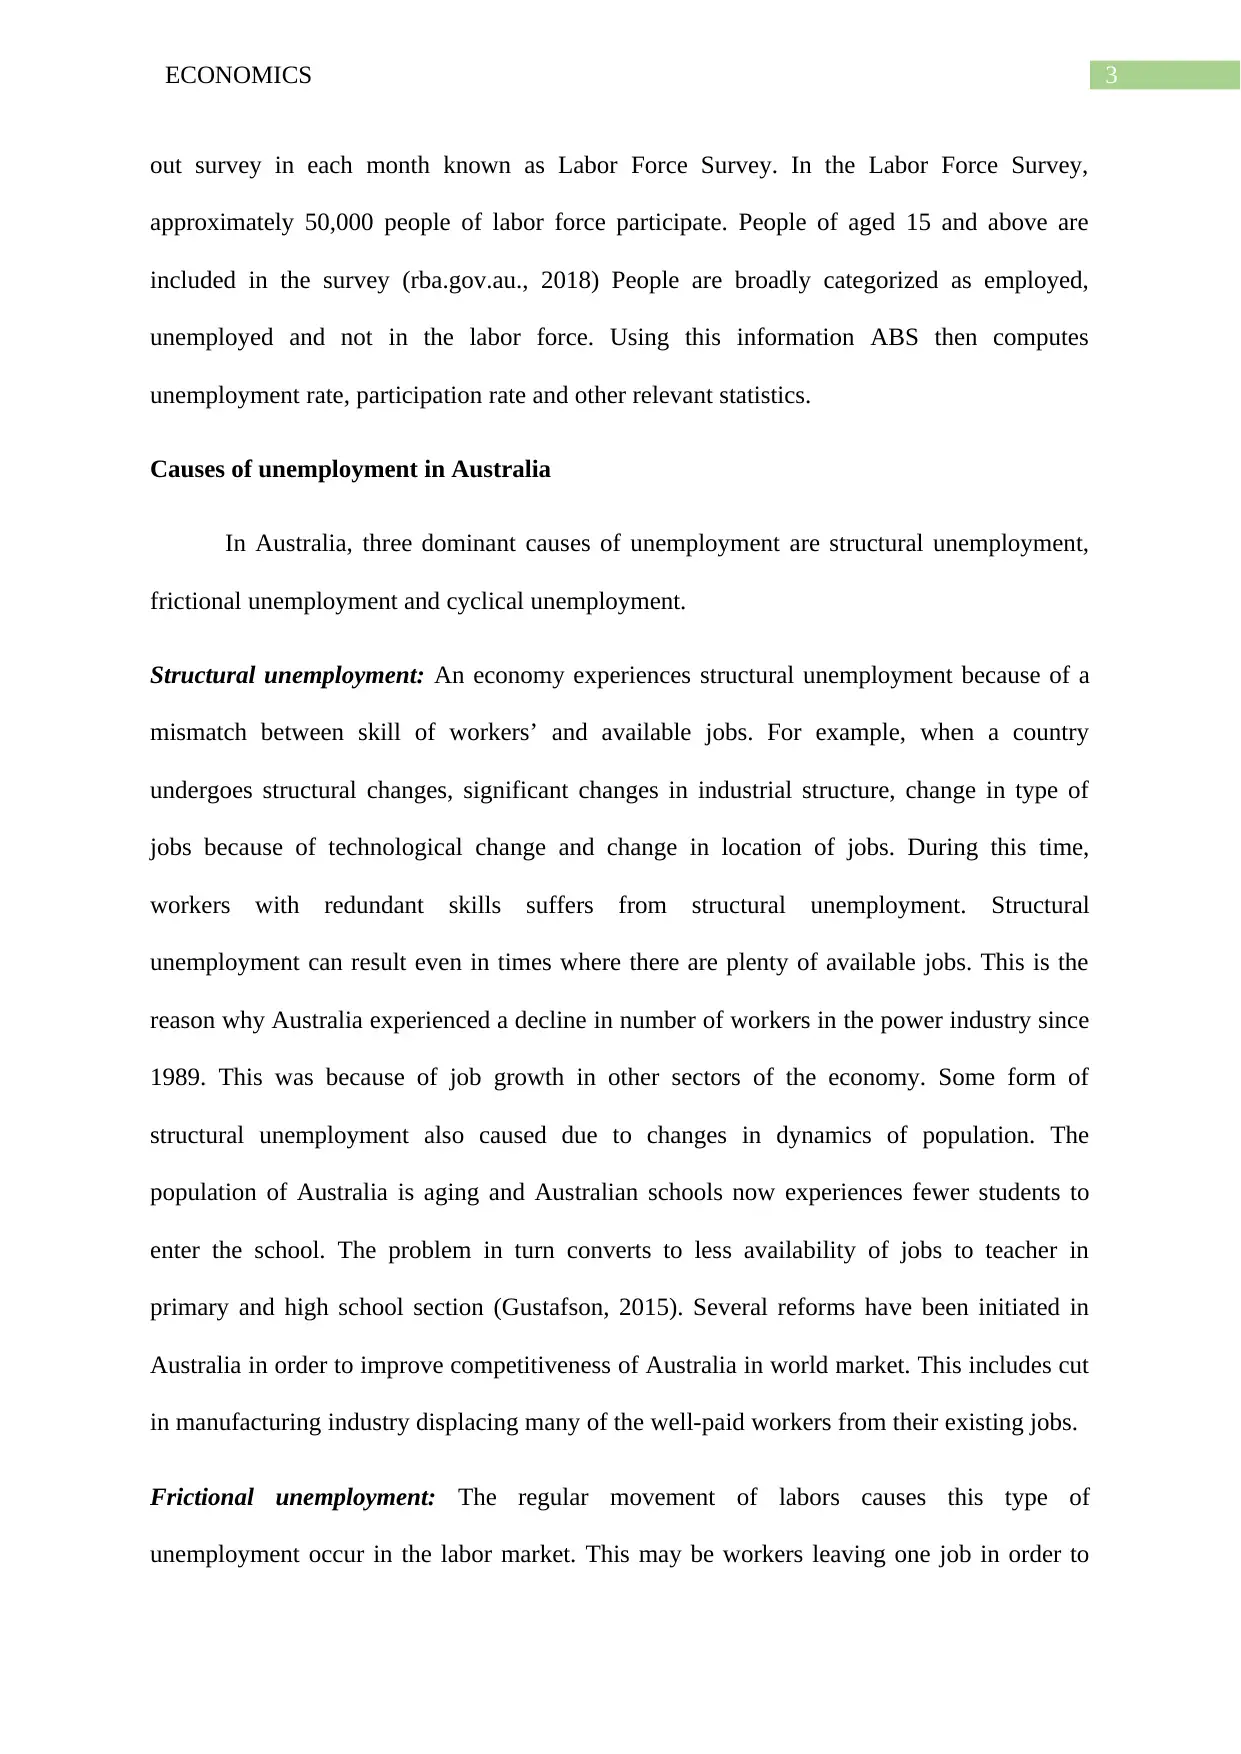
Introduction
Unemployment now has become a growing concern for the economy of Sri Lanka. As
per the report of central Bank, number of unemployed person is 700,000. Fifty percent of
total unemployed person is female. More than 80 percent of the unemployed persons are in
rural areas. Unemployment is more prevalent among people belonging to the age group of 20
to 30 years. Number of factors explain unemployment in Sri Lanka. One reason for
unemployment in Sri Lanka is the system of outmoded education and lack of appropriate
skills. For youths, it is not possible to be completely trained while leaving college or
universities. They need some time to gather skill. The economic growth of Sri Lanka is
relatively slower than development of labor force aggravating unemployment problem of
unemployment in Sri Lanka (Samaranayake, 2016). The law of labor in the labor market
limits the job generation program. In the last few years, a number of private companies in Sri
Lanka has closed down because of a number of factors including North East war.
Unemployment has also been increased due to deterioration of agricultural sector.
Measurement of unemployment
Unemployment also refers to a condition of joblessness occurs when some members
of labor force remain without job and actively looking for jobs. Unemployment is measured
with the objective of determining unemployment rate. It is the percentage of labor force that
is computed by dividing number of unemployed persons by total labor force of the economy.
Measuring unemployment is needs identification of people who are in the labor force. Labor
force includes both employed and unemployed persons. Finding out who is employed or
unemployed require practical judgment such as how much paid work a person needs to
considered them as to have a job as well as counting how many people actually have jobs or
not. In Australia, Australian Bureau of Statistics collects the labor market data. ABS carries
⊘ This is a preview!⊘
Do you want full access?
Subscribe today to unlock all pages.
Trusted by 1+ million students worldwide
3ECONOMICS
out survey in each month known as Labor Force Survey. In the Labor Force Survey,
approximately 50,000 people of labor force participate. People of aged 15 and above are
included in the survey (rba.gov.au., 2018) People are broadly categorized as employed,
unemployed and not in the labor force. Using this information ABS then computes
unemployment rate, participation rate and other relevant statistics.
Causes of unemployment in Australia
In Australia, three dominant causes of unemployment are structural unemployment,
frictional unemployment and cyclical unemployment.
Structural unemployment: An economy experiences structural unemployment because of a
mismatch between skill of workers’ and available jobs. For example, when a country
undergoes structural changes, significant changes in industrial structure, change in type of
jobs because of technological change and change in location of jobs. During this time,
workers with redundant skills suffers from structural unemployment. Structural
unemployment can result even in times where there are plenty of available jobs. This is the
reason why Australia experienced a decline in number of workers in the power industry since
1989. This was because of job growth in other sectors of the economy. Some form of
structural unemployment also caused due to changes in dynamics of population. The
population of Australia is aging and Australian schools now experiences fewer students to
enter the school. The problem in turn converts to less availability of jobs to teacher in
primary and high school section (Gustafson, 2015). Several reforms have been initiated in
Australia in order to improve competitiveness of Australia in world market. This includes cut
in manufacturing industry displacing many of the well-paid workers from their existing jobs.
Frictional unemployment: The regular movement of labors causes this type of
unemployment occur in the labor market. This may be workers leaving one job in order to
Paraphrase This Document
Need a fresh take? Get an instant paraphrase of this document with our AI Paraphraser
4ECONOMICS
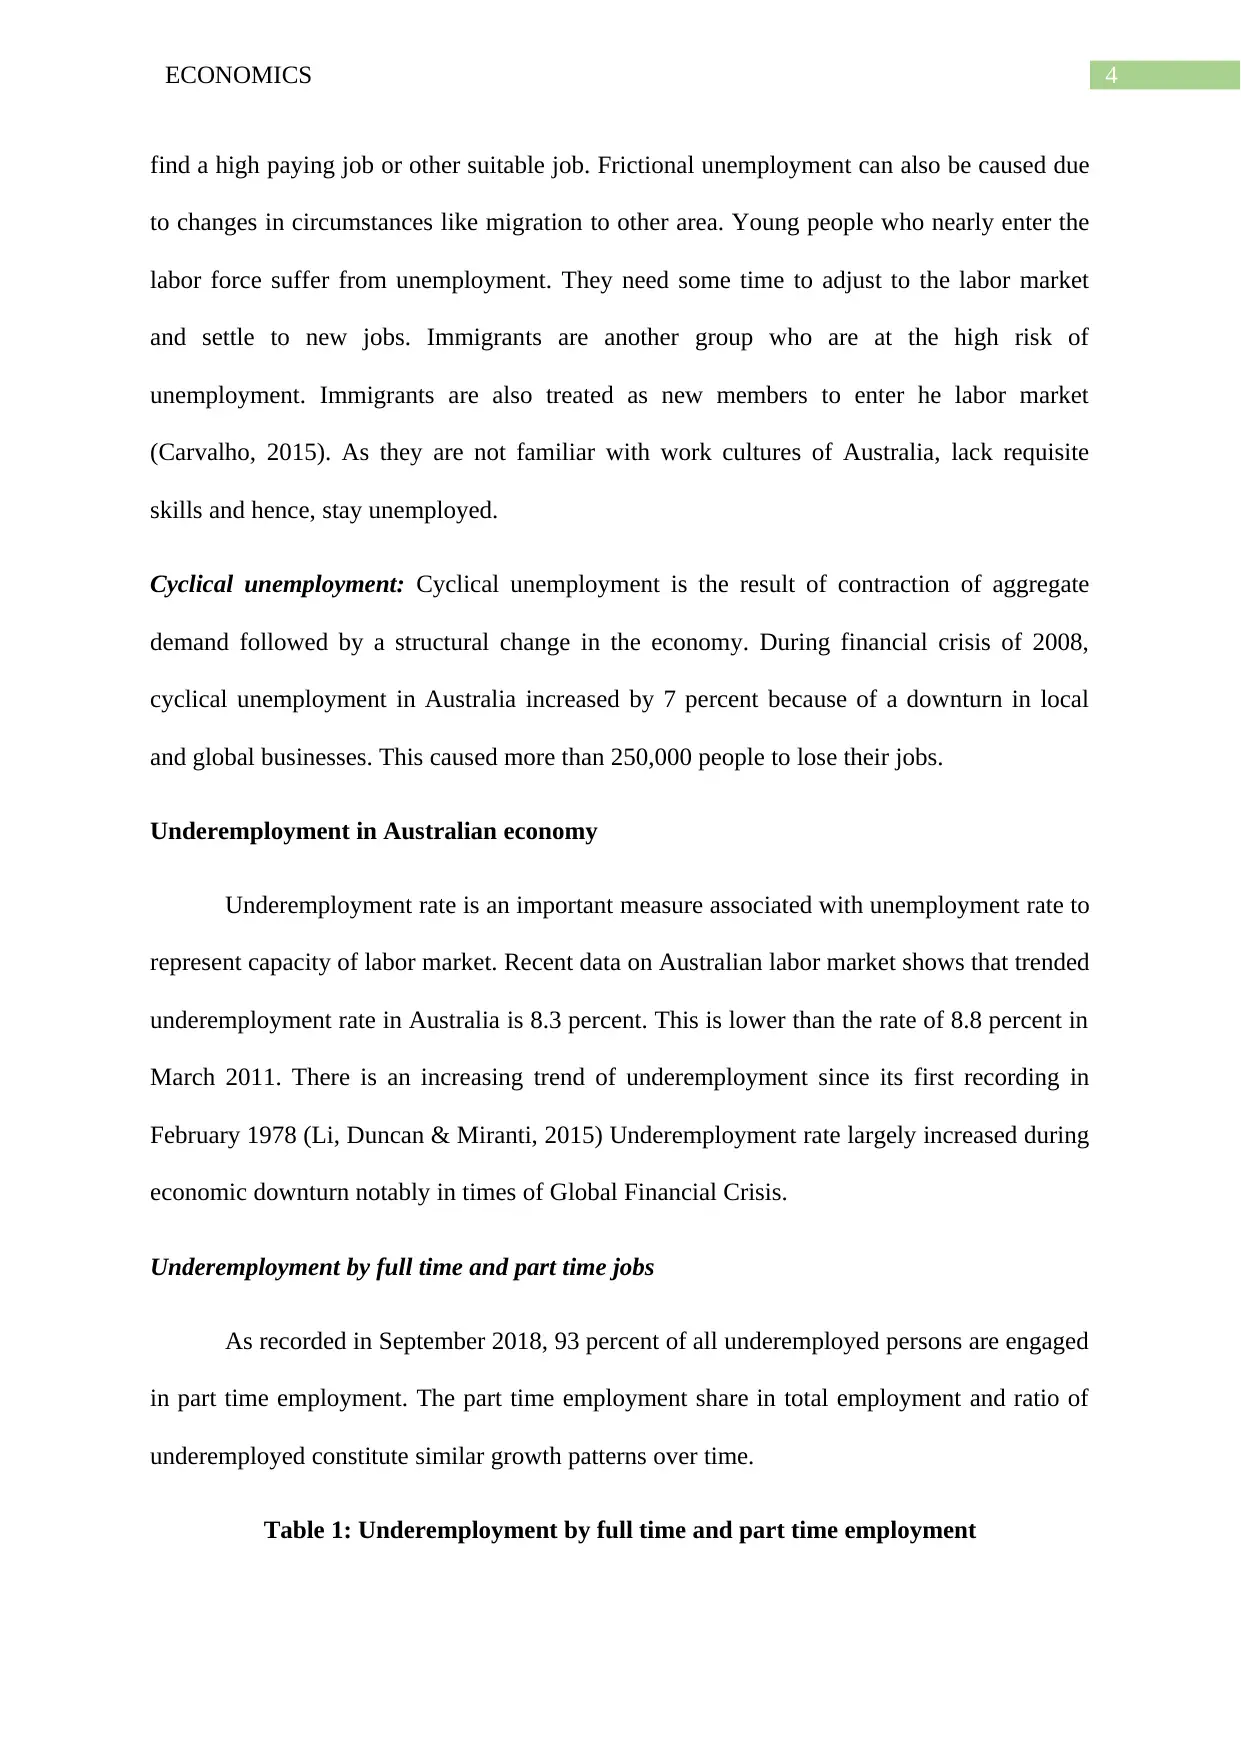
find a high paying job or other suitable job. Frictional unemployment can also be caused due
to changes in circumstances like migration to other area. Young people who nearly enter the
labor force suffer from unemployment. They need some time to adjust to the labor market
and settle to new jobs. Immigrants are another group who are at the high risk of
unemployment. Immigrants are also treated as new members to enter he labor market
(Carvalho, 2015). As they are not familiar with work cultures of Australia, lack requisite
skills and hence, stay unemployed.
Cyclical unemployment: Cyclical unemployment is the result of contraction of aggregate
demand followed by a structural change in the economy. During financial crisis of 2008,
cyclical unemployment in Australia increased by 7 percent because of a downturn in local
and global businesses. This caused more than 250,000 people to lose their jobs.
Underemployment in Australian economy
Underemployment rate is an important measure associated with unemployment rate to
represent capacity of labor market. Recent data on Australian labor market shows that trended
underemployment rate in Australia is 8.3 percent. This is lower than the rate of 8.8 percent in
March 2011. There is an increasing trend of underemployment since its first recording in
February 1978 (Li, Duncan & Miranti, 2015) Underemployment rate largely increased during
economic downturn notably in times of Global Financial Crisis.
Underemployment by full time and part time jobs
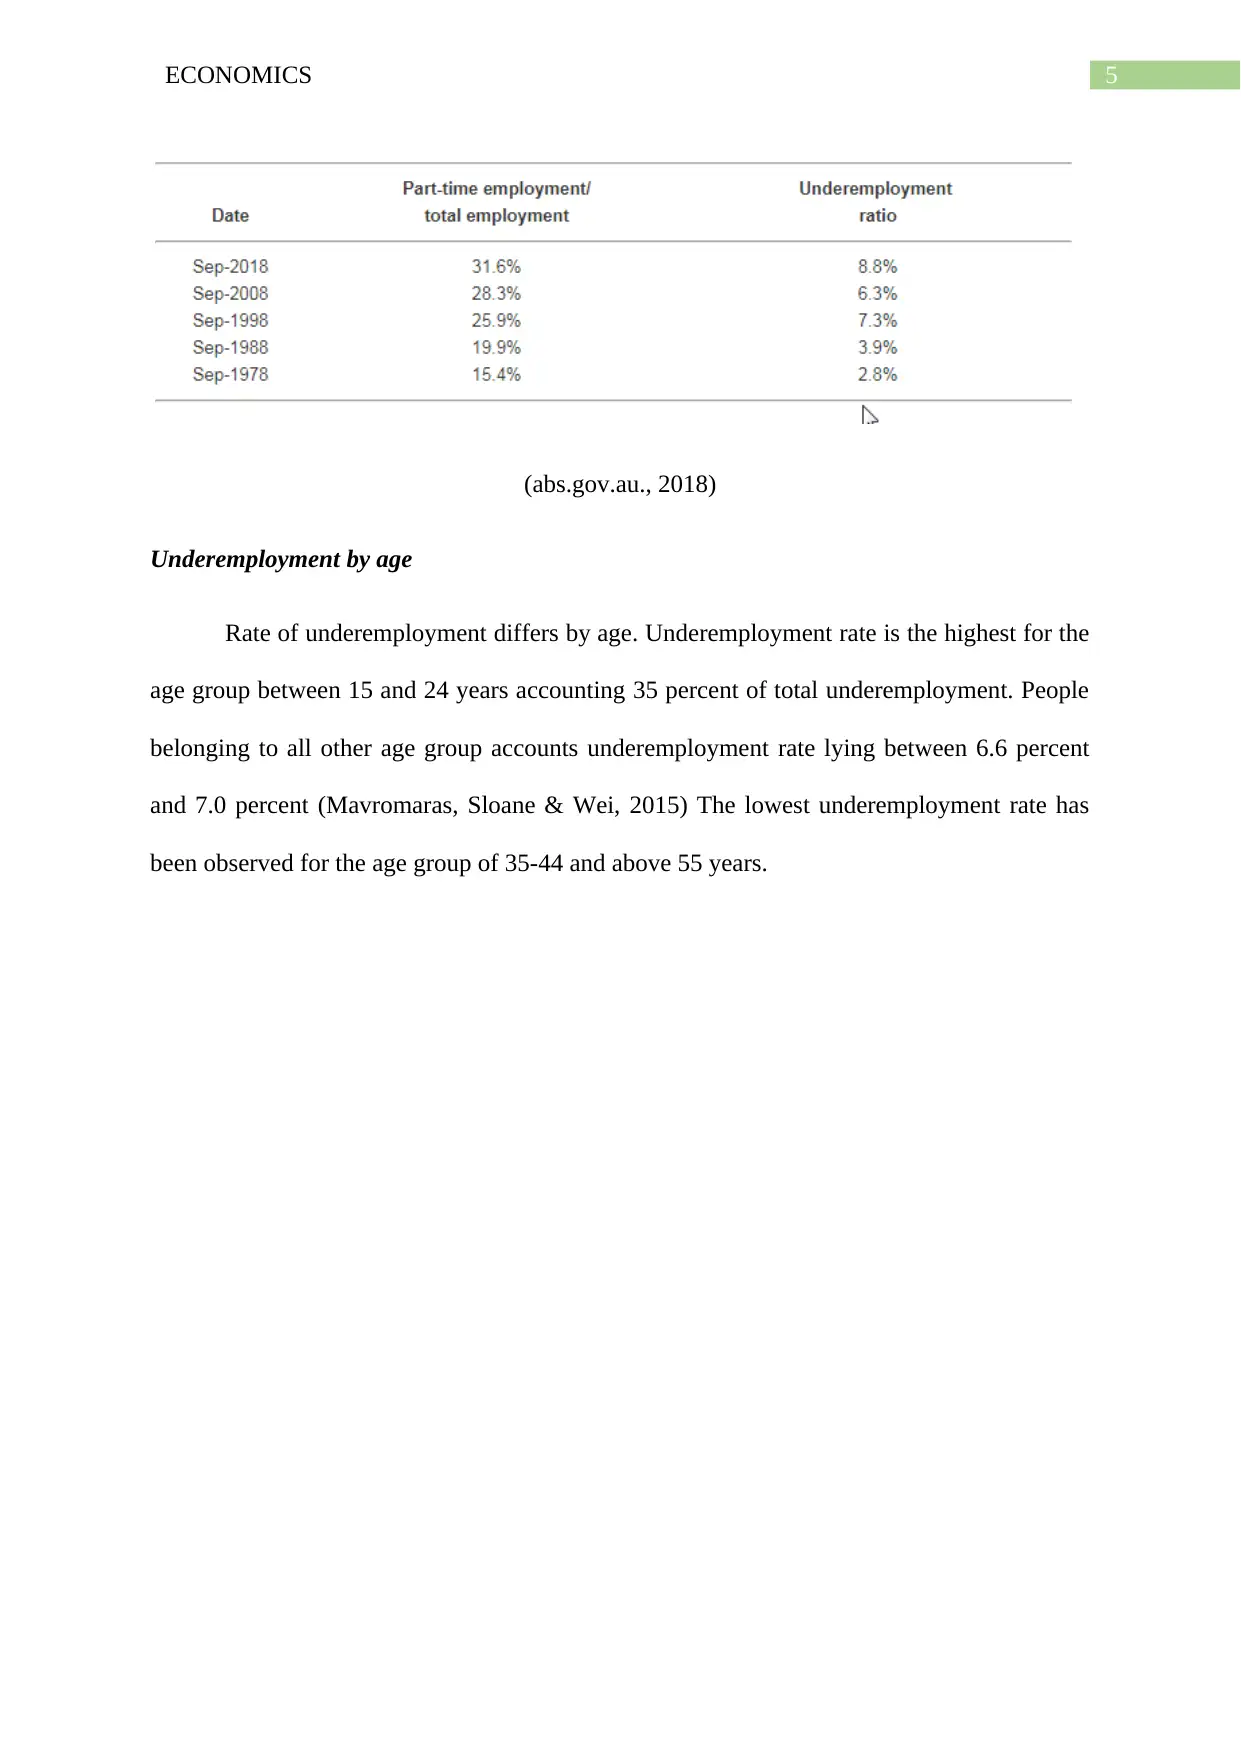
As recorded in September 2018, 93 percent of all underemployed persons are engaged
in part time employment. The part time employment share in total employment and ratio of
underemployed constitute similar growth patterns over time.
Table 1: Underemployment by full time and part time employment
find a high paying job or other suitable job. Frictional unemployment can also be caused due
to changes in circumstances like migration to other area. Young people who nearly enter the
labor force suffer from unemployment. They need some time to adjust to the labor market
and settle to new jobs. Immigrants are another group who are at the high risk of
unemployment. Immigrants are also treated as new members to enter he labor market
(Carvalho, 2015). As they are not familiar with work cultures of Australia, lack requisite
skills and hence, stay unemployed.
Cyclical unemployment: Cyclical unemployment is the result of contraction of aggregate
demand followed by a structural change in the economy. During financial crisis of 2008,
cyclical unemployment in Australia increased by 7 percent because of a downturn in local
and global businesses. This caused more than 250,000 people to lose their jobs.
Underemployment in Australian economy
Underemployment rate is an important measure associated with unemployment rate to
represent capacity of labor market. Recent data on Australian labor market shows that trended
underemployment rate in Australia is 8.3 percent. This is lower than the rate of 8.8 percent in
March 2011. There is an increasing trend of underemployment since its first recording in
February 1978 (Li, Duncan & Miranti, 2015) Underemployment rate largely increased during
economic downturn notably in times of Global Financial Crisis.
Underemployment by full time and part time jobs
As recorded in September 2018, 93 percent of all underemployed persons are engaged
in part time employment. The part time employment share in total employment and ratio of
underemployed constitute similar growth patterns over time.
Table 1: Underemployment by full time and part time employment
5ECONOMICS
(abs.gov.au., 2018)
Underemployment by age
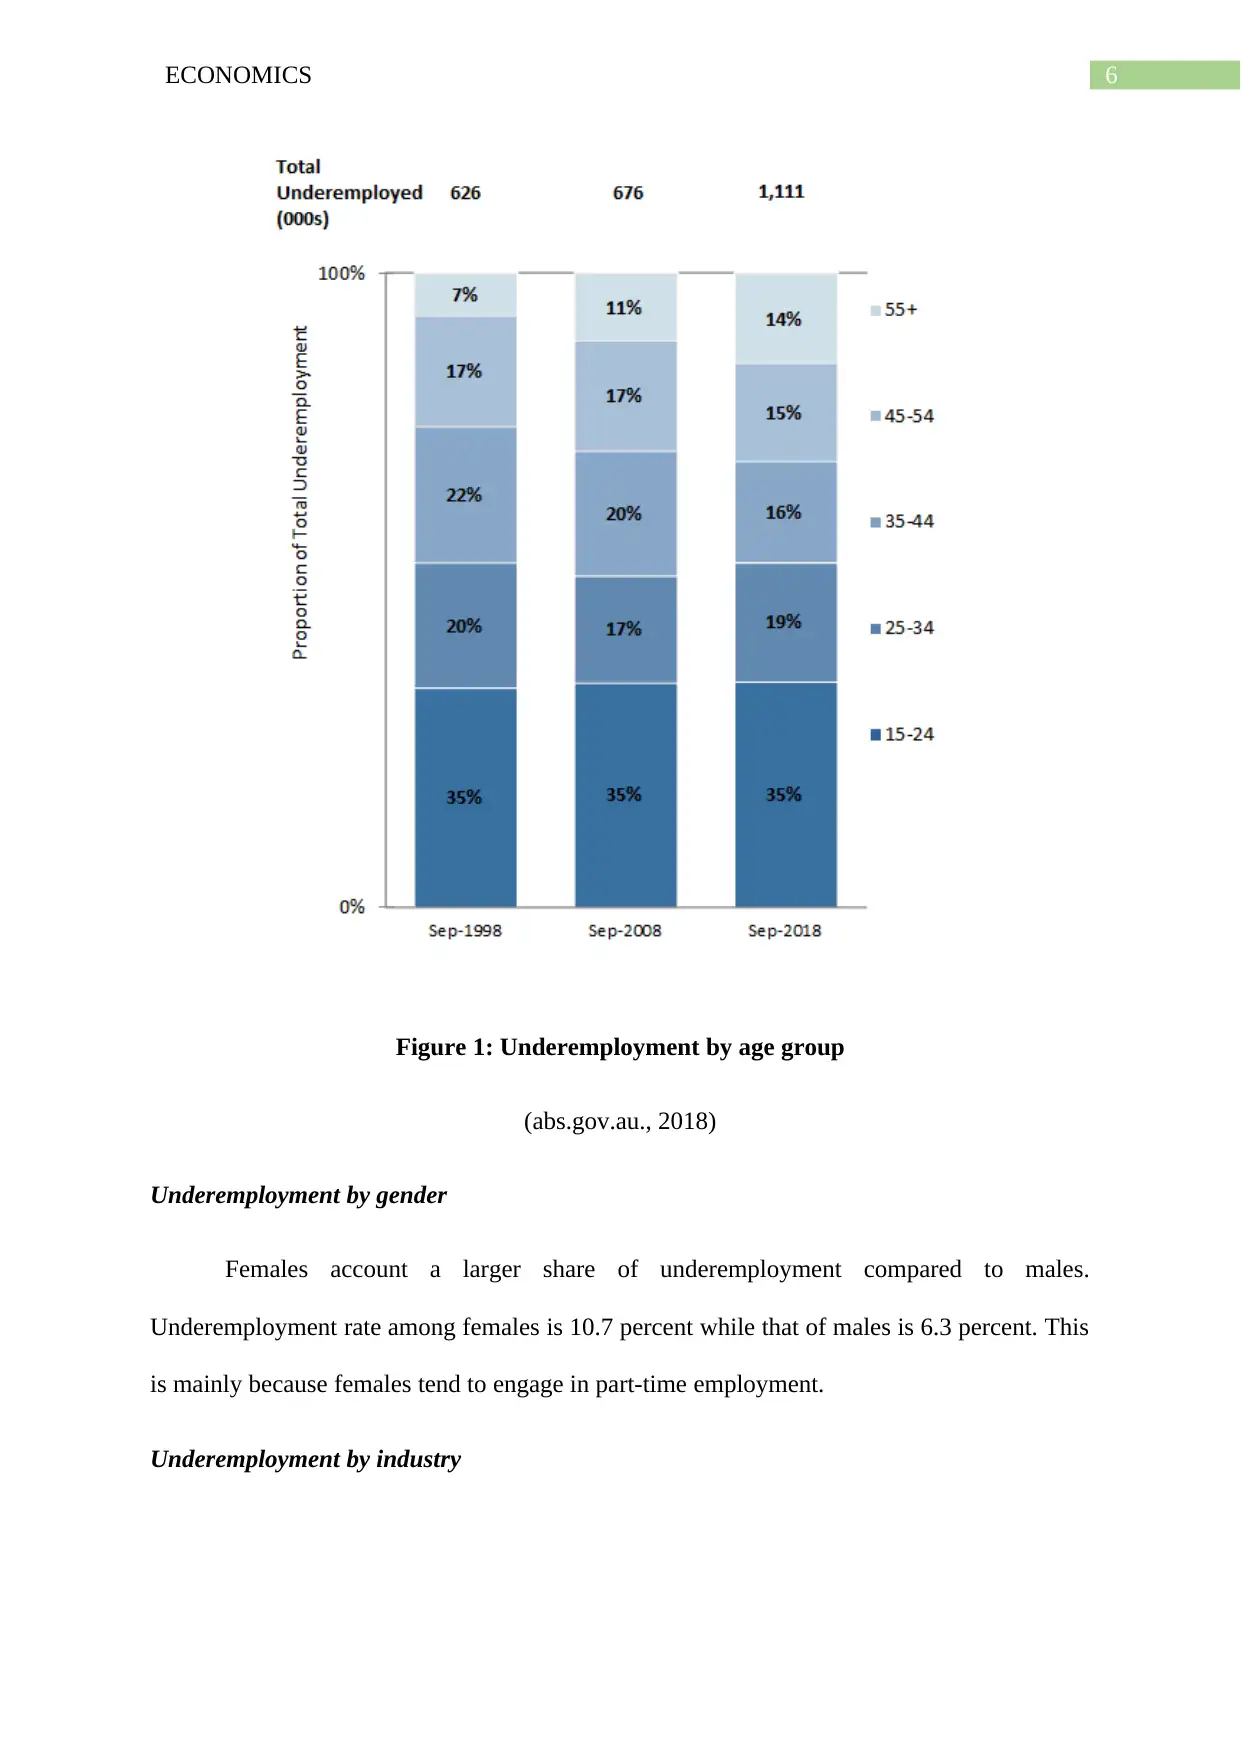
Rate of underemployment differs by age. Underemployment rate is the highest for the
age group between 15 and 24 years accounting 35 percent of total underemployment. People
belonging to all other age group accounts underemployment rate lying between 6.6 percent
and 7.0 percent (Mavromaras, Sloane & Wei, 2015) The lowest underemployment rate has
been observed for the age group of 35-44 and above 55 years.
(abs.gov.au., 2018)
Underemployment by age
Rate of underemployment differs by age. Underemployment rate is the highest for the
age group between 15 and 24 years accounting 35 percent of total underemployment. People
belonging to all other age group accounts underemployment rate lying between 6.6 percent
and 7.0 percent (Mavromaras, Sloane & Wei, 2015) The lowest underemployment rate has
been observed for the age group of 35-44 and above 55 years.
⊘ This is a preview!⊘
Do you want full access?
Subscribe today to unlock all pages.
Trusted by 1+ million students worldwide
6ECONOMICS
Figure 1: Underemployment by age group
(abs.gov.au., 2018)
Underemployment by gender
Females account a larger share of underemployment compared to males.
Underemployment rate among females is 10.7 percent while that of males is 6.3 percent. This
is mainly because females tend to engage in part-time employment.
Underemployment by industry
Paraphrase This Document
Need a fresh take? Get an instant paraphrase of this document with our AI Paraphraser
7ECONOMICS
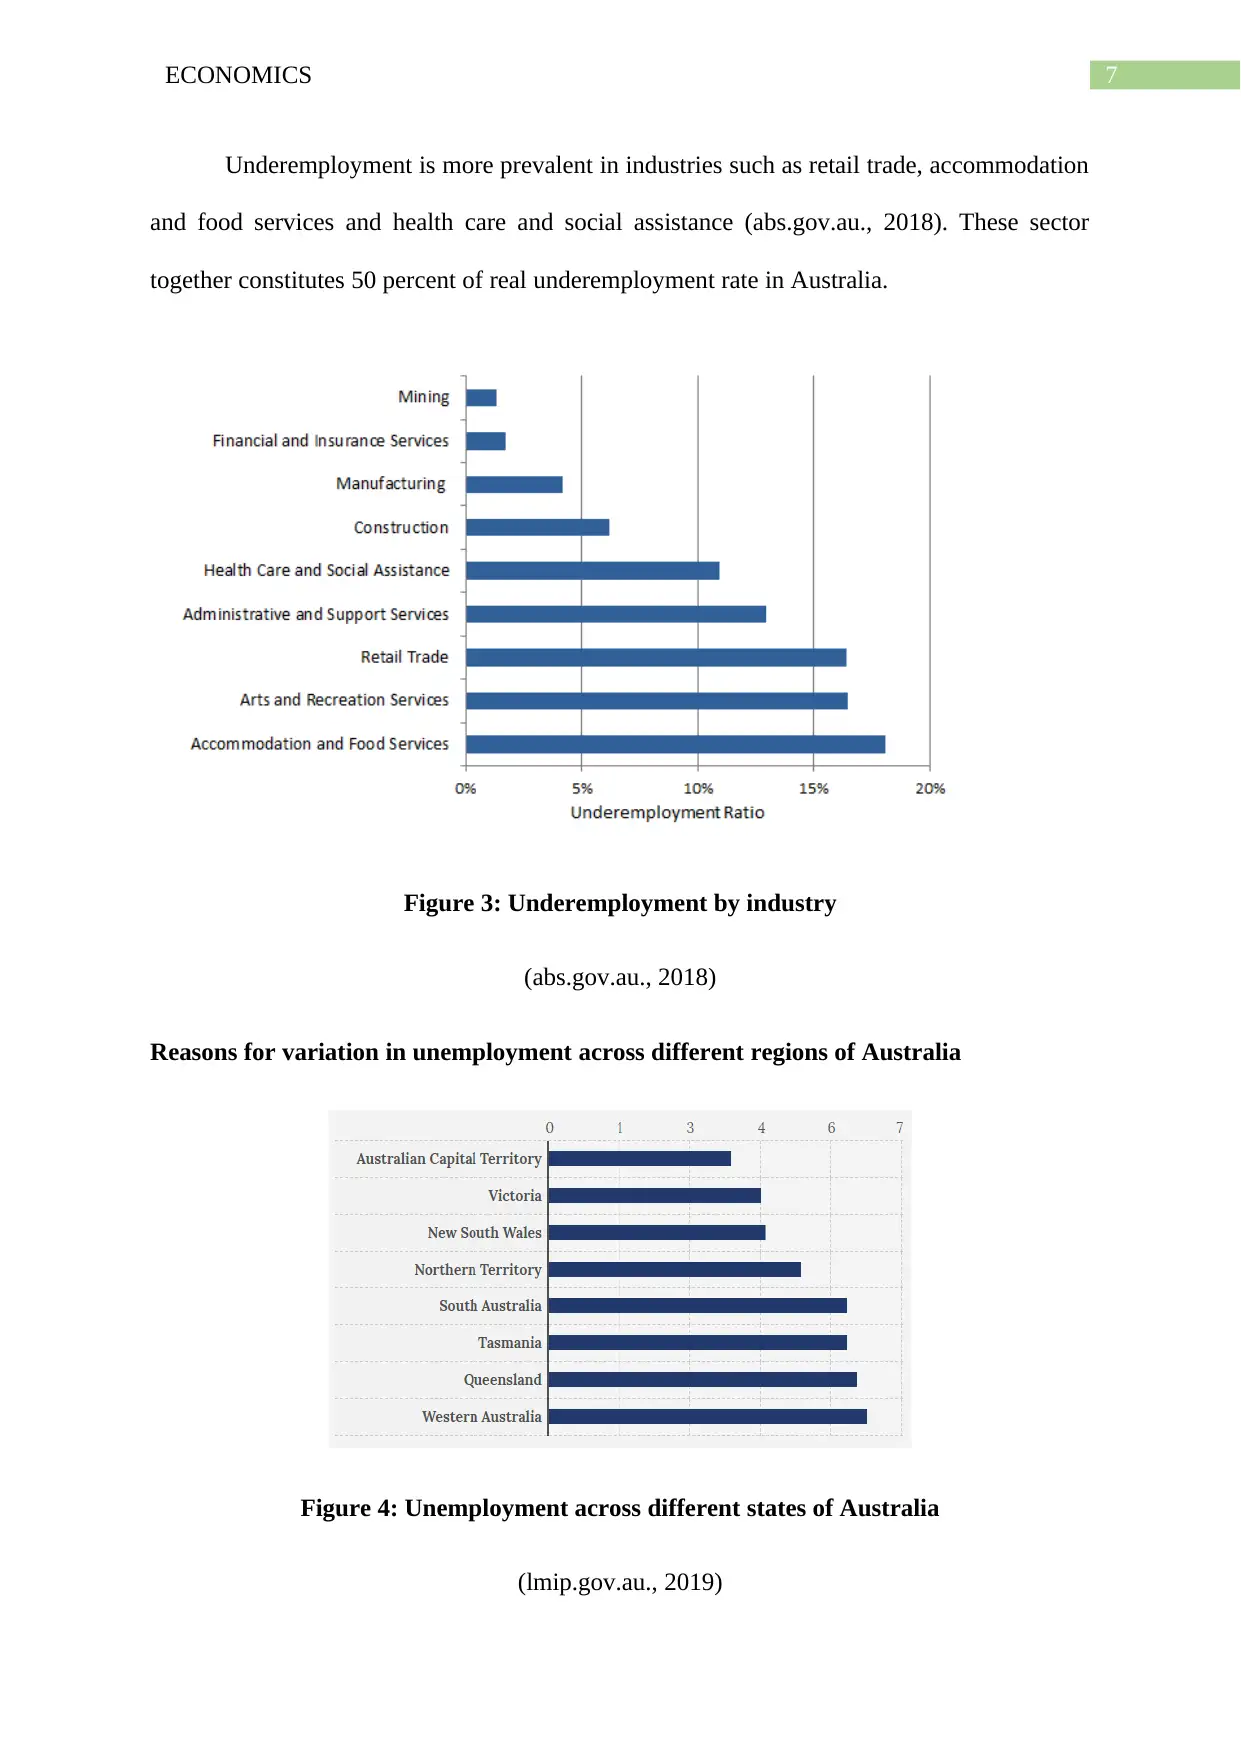
Underemployment is more prevalent in industries such as retail trade, accommodation
and food services and health care and social assistance (abs.gov.au., 2018). These sector
together constitutes 50 percent of real underemployment rate in Australia.
Figure 3: Underemployment by industry
(abs.gov.au., 2018)
Reasons for variation in unemployment across different regions of Australia
Figure 4: Unemployment across different states of Australia
(lmip.gov.au., 2019)
8ECONOMICS
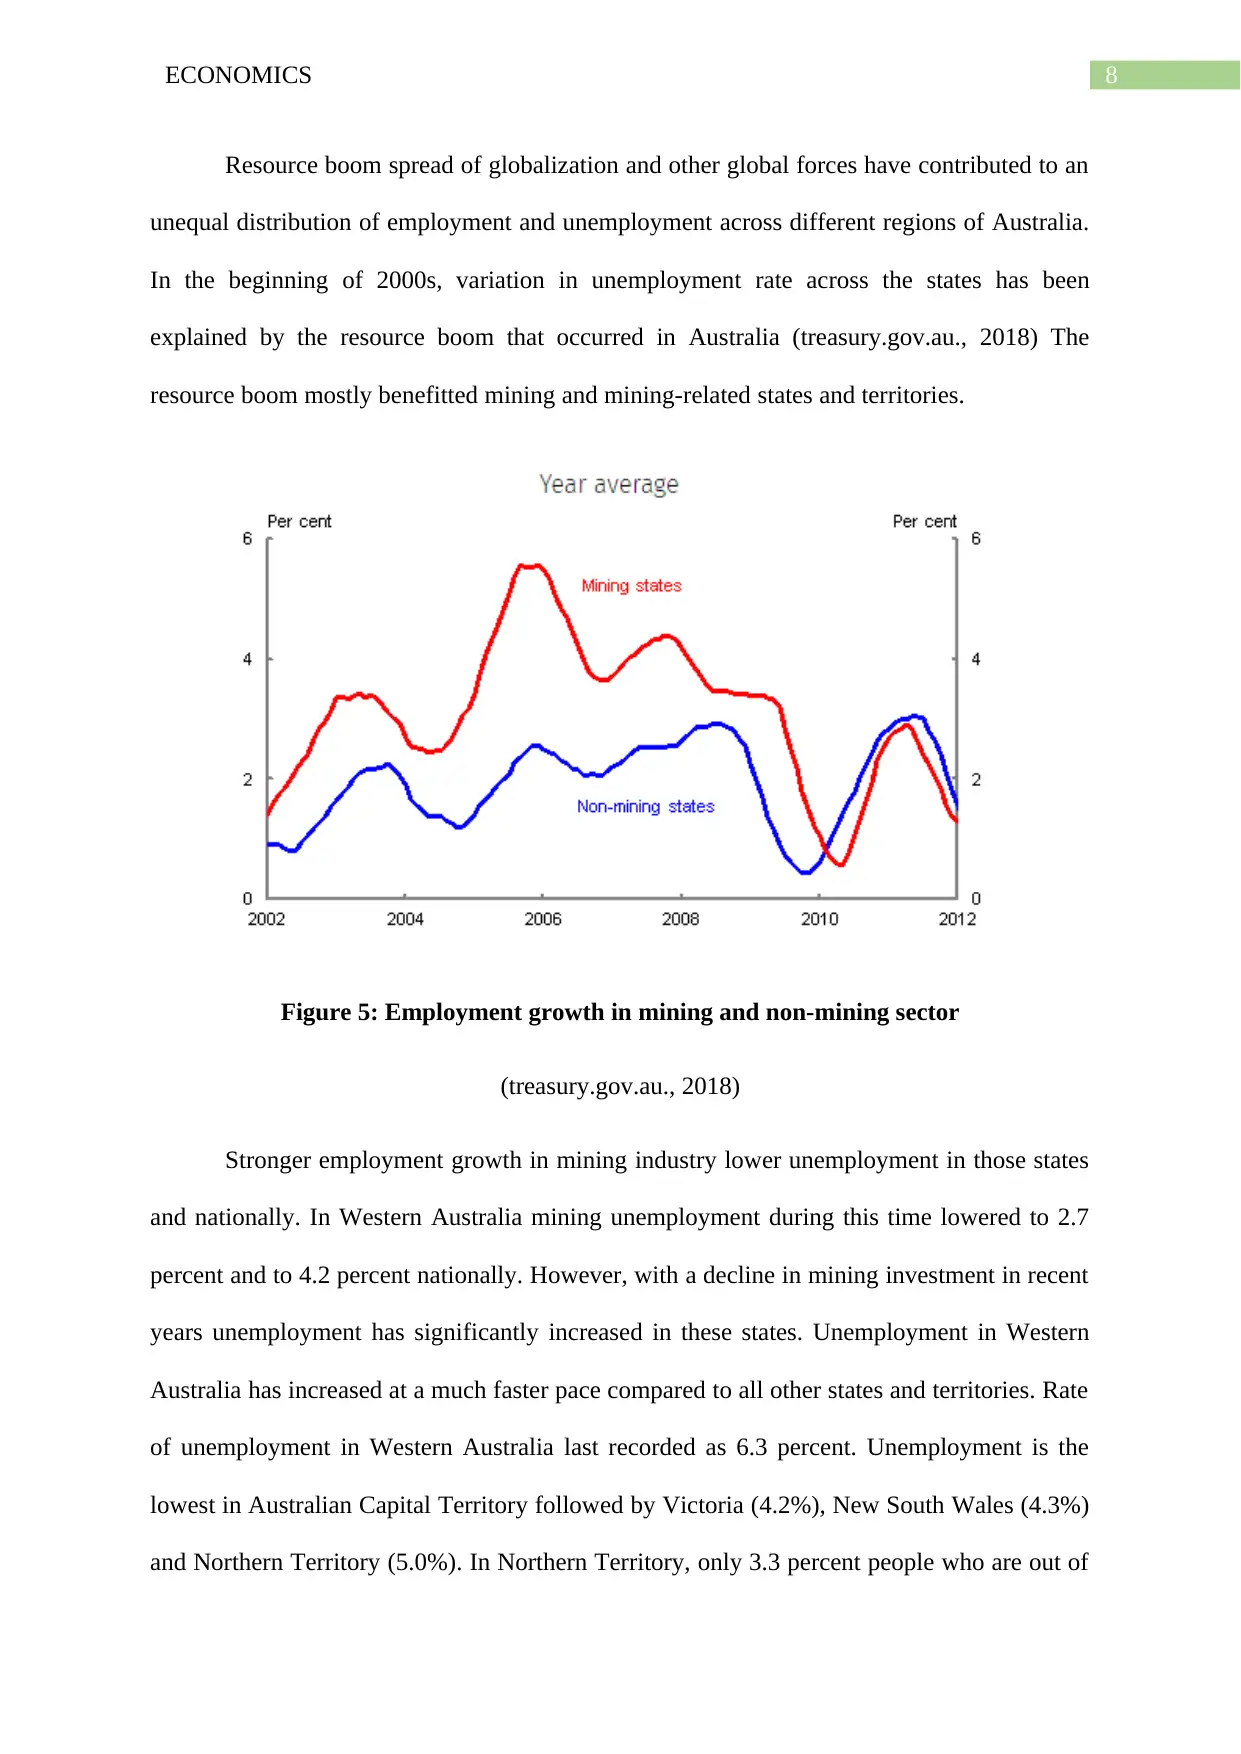
Resource boom spread of globalization and other global forces have contributed to an
unequal distribution of employment and unemployment across different regions of Australia.
In the beginning of 2000s, variation in unemployment rate across the states has been
explained by the resource boom that occurred in Australia (treasury.gov.au., 2018) The
resource boom mostly benefitted mining and mining-related states and territories.
Figure 5: Employment growth in mining and non-mining sector
(treasury.gov.au., 2018)
Stronger employment growth in mining industry lower unemployment in those states
and nationally. In Western Australia mining unemployment during this time lowered to 2.7
percent and to 4.2 percent nationally. However, with a decline in mining investment in recent
years unemployment has significantly increased in these states. Unemployment in Western
Australia has increased at a much faster pace compared to all other states and territories. Rate
of unemployment in Western Australia last recorded as 6.3 percent. Unemployment is the
lowest in Australian Capital Territory followed by Victoria (4.2%), New South Wales (4.3%)
and Northern Territory (5.0%). In Northern Territory, only 3.3 percent people who are out of
⊘ This is a preview!⊘
Do you want full access?
Subscribe today to unlock all pages.
Trusted by 1+ million students worldwide
9ECONOMICS
work. This lower unemployment rate in Northern Territory is due to faster economic growth
and prosperity of the state (ntnews.com.au, 2018). The lowest unemployment in ACT is not
surprising given that most of the residents move to the state for work and leave the state when
work finishes. Tasmania and South Australia have showed the biggest improvement in
lowering unemployment rate with jobless rate being 5.8 percent and 5.3 percent respectively
(abc.net.au., 2018)
Policies to decrease unemployment
Australian government has already taken several actions to achieve full employment
in the economy. Following policies can further be implemented to lower unemployment in
Australia.
Job Guarantee schemes for indigenous group
The government should keep its commitment to the full employment. Government
can trial a Job Guarantee scheme for indigenous communities. Under such a scheme,
government can offer a job at the set minimum wage to anyone desired to be employed up to
35 hours.
Coordinated management program
Government need to maintain coordination among the policies of inflation,
unemployment, productivity and workforce skills (percapita.org.au., 2018). Achieving full
employment will require a more coordinated approach to mitigate inflation compared to the
existing one.
Shift in University education
Paraphrase This Document
Need a fresh take? Get an instant paraphrase of this document with our AI Paraphraser
10ECONOMICS
Government can shift the structure of university education in favor of versatility,
critical thinking and problem solving. This would make Australian youth suitable to the need
of new economy.
Other policies that can help in lowering unemployment include increasing provision
for vocational training, investment for lifelong learning, reform to need-based vocational
education and others.
Conclusion
Countries like Sri Lanka having a relatively slower growth rate needs long term
policies to lower unemployment. Unemployment rate may be still higher than other countries.
The market of Sri Lank can be made more efficient by implementing a number of policies.
The reform policies should aim to remove artificial benefits associated with some form of
good jobs. Focus should also be given on improving the quality of the “bad” jobs. Reducing
gap between these two types of jobs can reduce payoff for queuing lessening the period of job
search. Efforts should be made to initiate reform of employment in public sector and payment
policies.
11ECONOMICS
References
abc.net.au. (2018). Unemployment edges higher as more people look for work. Retrieved
from https://www.abc.net.au/news/2018-12-20/jobs-labour-market-abs-november/
10638408
abs.gov.au. (2018). 6202.0 - Labour Force, Australia, September 2018. Retrieved from
http://www.abs.gov.au/ausstats/abs@.nsf/Lookup/6202.0main+features10September
%202018
Carvalho, P. (2015). Youth unemployment in Australia. Policy: A Journal of Public Policy
and Ideas, 31(4), 36.
Gustafson, P. (2015). The Real Unemployment Rate? Estimating NAIRU with Alternative
Measures of Unemployment. The Massachusetts Undergraduate Journal of
Economics, 129.
Li, J., Duncan, A., & Miranti, R. (2015). Underemployment among Mature‐Age Workers in
Australia. Economic Record, 91(295), 438-462.
lmip.gov.au. (2019). Welcome to the Labour Market Information Portal. Retrieved from
http://lmip.gov.au/default.aspx?LMIP/LFR_SAFOUR/LFR_UnemploymentRate
Mavromaras, K., Sloane, P., & Wei, Z. (2015). The scarring effects of unemployment, low
pay and skills under-utilization in Australia compared. Applied Economics, 47(23),
2413-2429.
ntnews.com.au. (2018). NT leads nation in employment. Retrieved from
https://www.ntnews.com.au/news/northern-territory/northern-territory-has-lowest-
unemployment-rate-in-australia/news-story/80626d1d6c8efe4ae7dea1d4538b940e
⊘ This is a preview!⊘
Do you want full access?
Subscribe today to unlock all pages.
Trusted by 1+ million students worldwide
1 out of 13
Related Documents


Your All-in-One AI-Powered Toolkit for Academic Success.
+13062052269
info@desklib.com
Available 24*7 on WhatsApp / Email
![[object Object]](/_next/static/media/star-bottom.7253800d.svg)
Unlock your academic potential
Copyright © 2020–2026 A2Z Services. All Rights Reserved. Developed and managed by ZUCOL.