Analysis of Beverage Intake Among USC University Students in BAC21
VerifiedAdded on 2023/05/29
|12
|4509
|362
Report
AI Summary
This report analyzes the beverage consumption patterns of USC University students enrolled in the BAC21 course, based on a survey of 100 students. The study investigates the popularity of various beverages, including soft drinks, energy drinks, and healthy alternatives, and examines the differences in consumption habits between domestic and international students. The research explores the relationship between beverage price and consumption quantity, revealing a strong negative correlation, with consumption decreasing as prices increase. The report identifies the most and least popular beverages among students, highlighting a preference for water, milk, and similar beverages over energy drinks. Furthermore, the study assesses brand loyalty, showing that students are less likely to switch to cheaper alternatives when the discount is lower. The analysis also compares the preferences of domestic and international students, noting differences in their choices, and concludes that soft drinks are unlikely to be the first choice for students. The study's findings suggest that USC students, particularly those in the BAC21 course, tend to consume healthier beverages. The study was limited due to the small sample size of international students.
Running Head: Intake Details of Beverages of USC University Students in BAC21 course
Intake Details of Beverages of USC University
Students in BAC21 course
Intake Details of Beverages of USC University
Students in BAC21 course
Paraphrase This Document
Need a fresh take? Get an instant paraphrase of this document with our AI Paraphraser
Intake Details of Beverages of USC University Students in BAC21 course
Abstract
The present article examined the popularity of beverages including health drink use
among USC University students in BAC21 course, and differentiation of choice between
domestic and international students for such use. The study used a simple random sample of 100
anonymous responses from cross-sectional surveys of nationally representative students and
conducted descriptive analyses examining associations between beverage and price controlling
for individual and loyalty characteristics towards their choice of drinks.
2
Intake Details of Beverages of USC University Students in BAC21 course
Introduction
Energy drinks contain high volumes of caffeine and primarily target teens and adults.
Higher consumption of soft and energy drinks has been associated with higher dependence on
alcohol consumption. Some studies indicate such relationships may be found only among certain
groups of college students (Acton, Vanderlee, Hobin, & Hammond, 2017). Suggested
explanations for observed relationships between beverage consumption and personality traits of
the students are (a) encouragement via marketing of such drinks for recreational and stimulant
properties; (b) considering beverage use pattern as part of behavioral traits based on common
psychological factors within peer groups; (c) make use of caffeine and other energy drinks in
examinations of substance use relationships. The scholar selected 100 BAC21 students from the
USC University in a random sampling technique to testify the above concerns; specifically the
price-preference and offer-loyalty issues on beverage consumption model (Terry-McElrath,
O’Malley, & Johnston, 2014).
Data Analysis
Proportions of Local and International Students
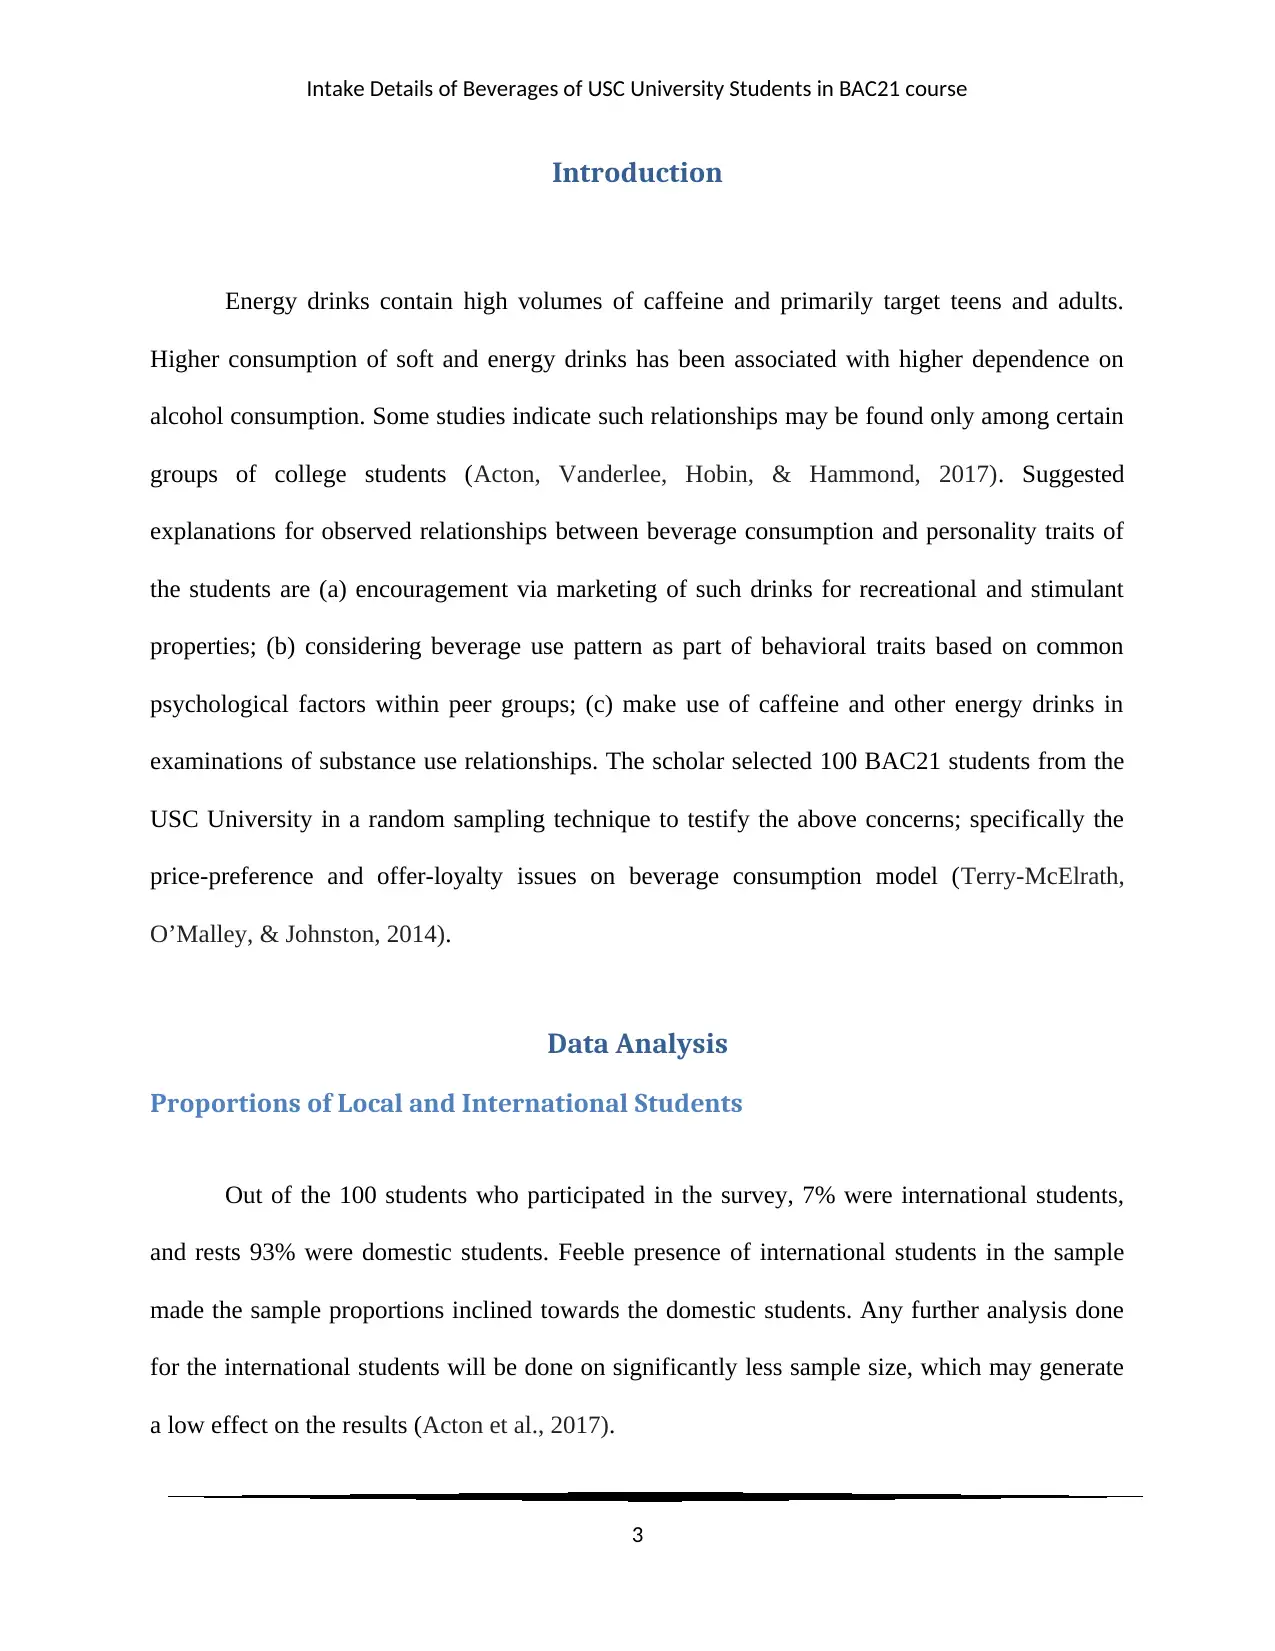
Out of the 100 students who participated in the survey, 7% were international students,
and rests 93% were domestic students. Feeble presence of international students in the sample
made the sample proportions inclined towards the domestic students. Any further analysis done
for the international students will be done on significantly less sample size, which may generate
a low effect on the results (Acton et al., 2017).
3
Introduction
Energy drinks contain high volumes of caffeine and primarily target teens and adults.
Higher consumption of soft and energy drinks has been associated with higher dependence on
alcohol consumption. Some studies indicate such relationships may be found only among certain
groups of college students (Acton, Vanderlee, Hobin, & Hammond, 2017). Suggested
explanations for observed relationships between beverage consumption and personality traits of
the students are (a) encouragement via marketing of such drinks for recreational and stimulant
properties; (b) considering beverage use pattern as part of behavioral traits based on common
psychological factors within peer groups; (c) make use of caffeine and other energy drinks in
examinations of substance use relationships. The scholar selected 100 BAC21 students from the
USC University in a random sampling technique to testify the above concerns; specifically the
price-preference and offer-loyalty issues on beverage consumption model (Terry-McElrath,
O’Malley, & Johnston, 2014).
Data Analysis
Proportions of Local and International Students
Out of the 100 students who participated in the survey, 7% were international students,
and rests 93% were domestic students. Feeble presence of international students in the sample
made the sample proportions inclined towards the domestic students. Any further analysis done
for the international students will be done on significantly less sample size, which may generate
a low effect on the results (Acton et al., 2017).
3
⊘ This is a preview!⊘
Do you want full access?
Subscribe today to unlock all pages.
Trusted by 1+ million students worldwide
Intake Details of Beverages of USC University Students in BAC21 course
Figure 1: Proportion Distribution of Origin of Students
Relationship between Price and Average Quantity Consumed
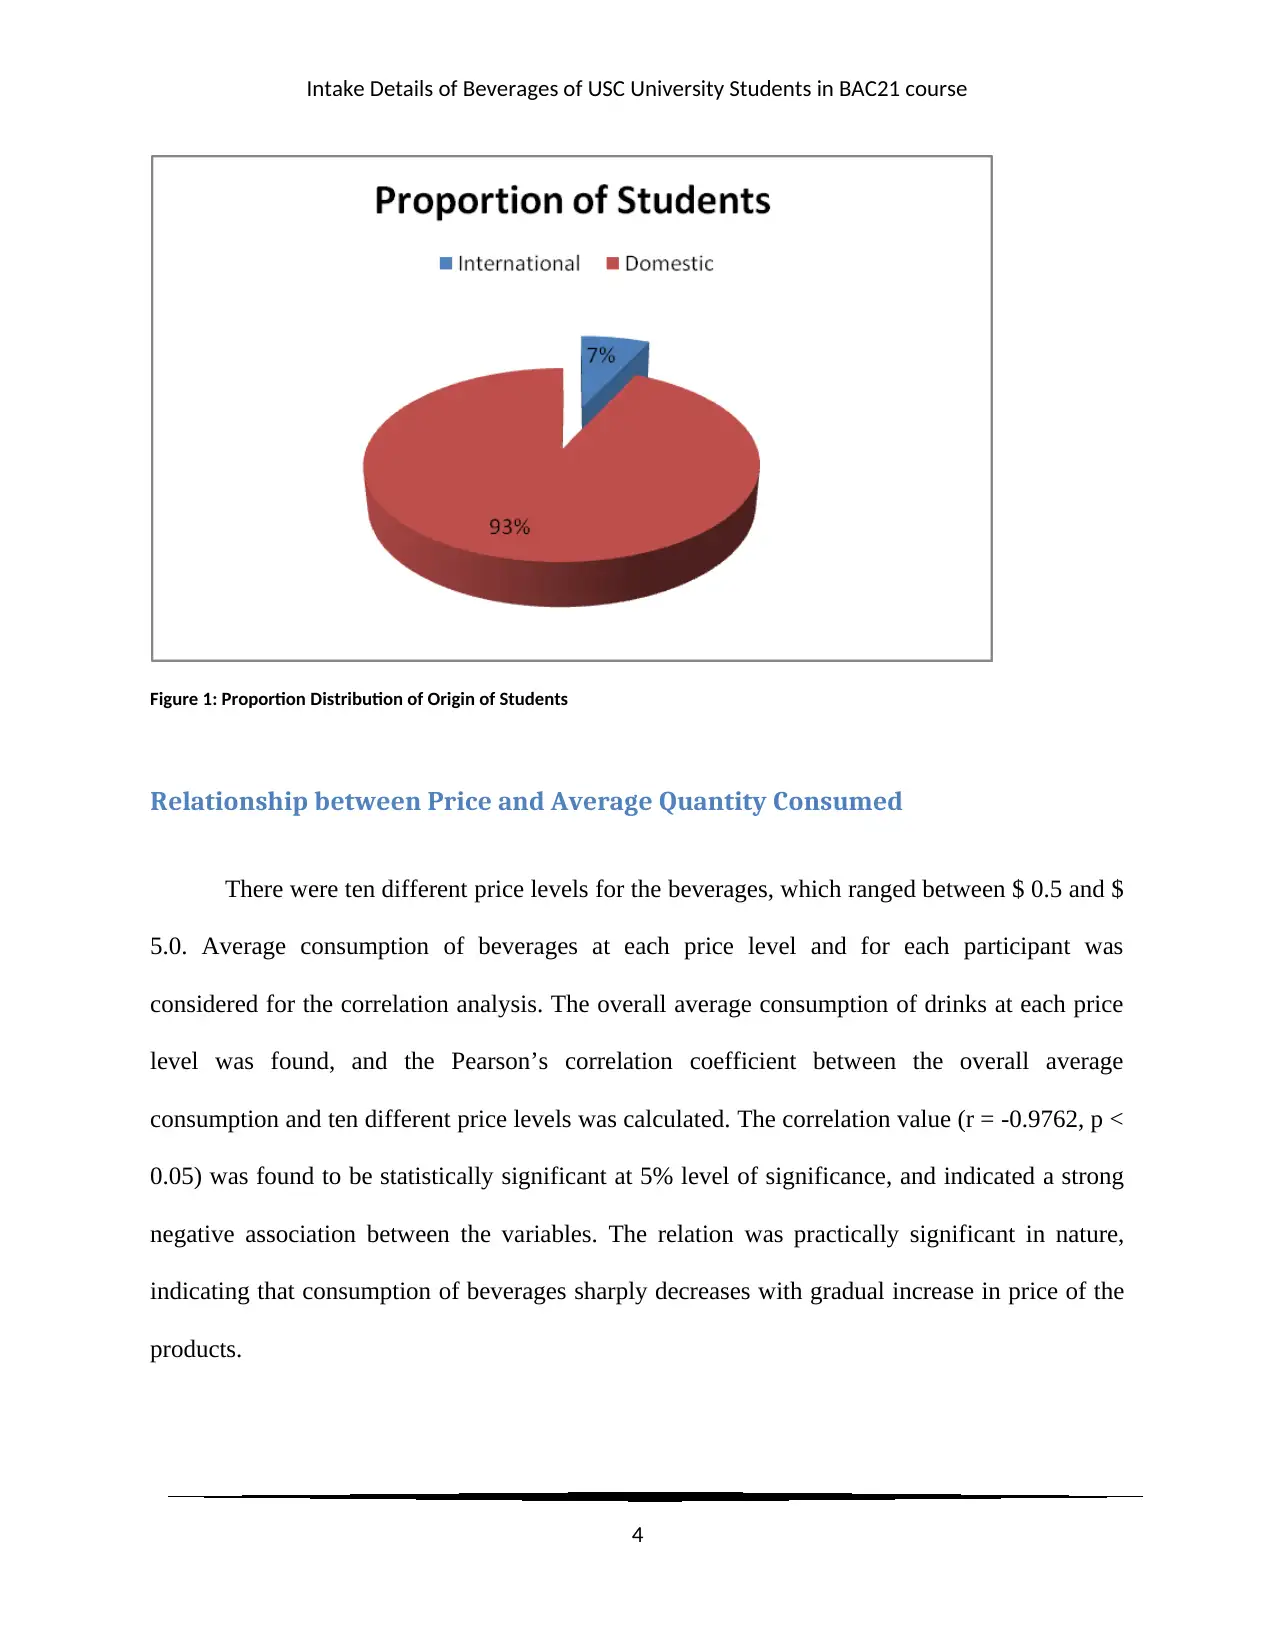
There were ten different price levels for the beverages, which ranged between $ 0.5 and $
5.0. Average consumption of beverages at each price level and for each participant was
considered for the correlation analysis. The overall average consumption of drinks at each price
level was found, and the Pearson’s correlation coefficient between the overall average
consumption and ten different price levels was calculated. The correlation value (r = -0.9762, p <
0.05) was found to be statistically significant at 5% level of significance, and indicated a strong
negative association between the variables. The relation was practically significant in nature,
indicating that consumption of beverages sharply decreases with gradual increase in price of the
products.
4
Figure 1: Proportion Distribution of Origin of Students
Relationship between Price and Average Quantity Consumed
There were ten different price levels for the beverages, which ranged between $ 0.5 and $
5.0. Average consumption of beverages at each price level and for each participant was
considered for the correlation analysis. The overall average consumption of drinks at each price
level was found, and the Pearson’s correlation coefficient between the overall average
consumption and ten different price levels was calculated. The correlation value (r = -0.9762, p <
0.05) was found to be statistically significant at 5% level of significance, and indicated a strong
negative association between the variables. The relation was practically significant in nature,
indicating that consumption of beverages sharply decreases with gradual increase in price of the
products.
4
Paraphrase This Document
Need a fresh take? Get an instant paraphrase of this document with our AI Paraphraser
Intake Details of Beverages of USC University Students in BAC21 course
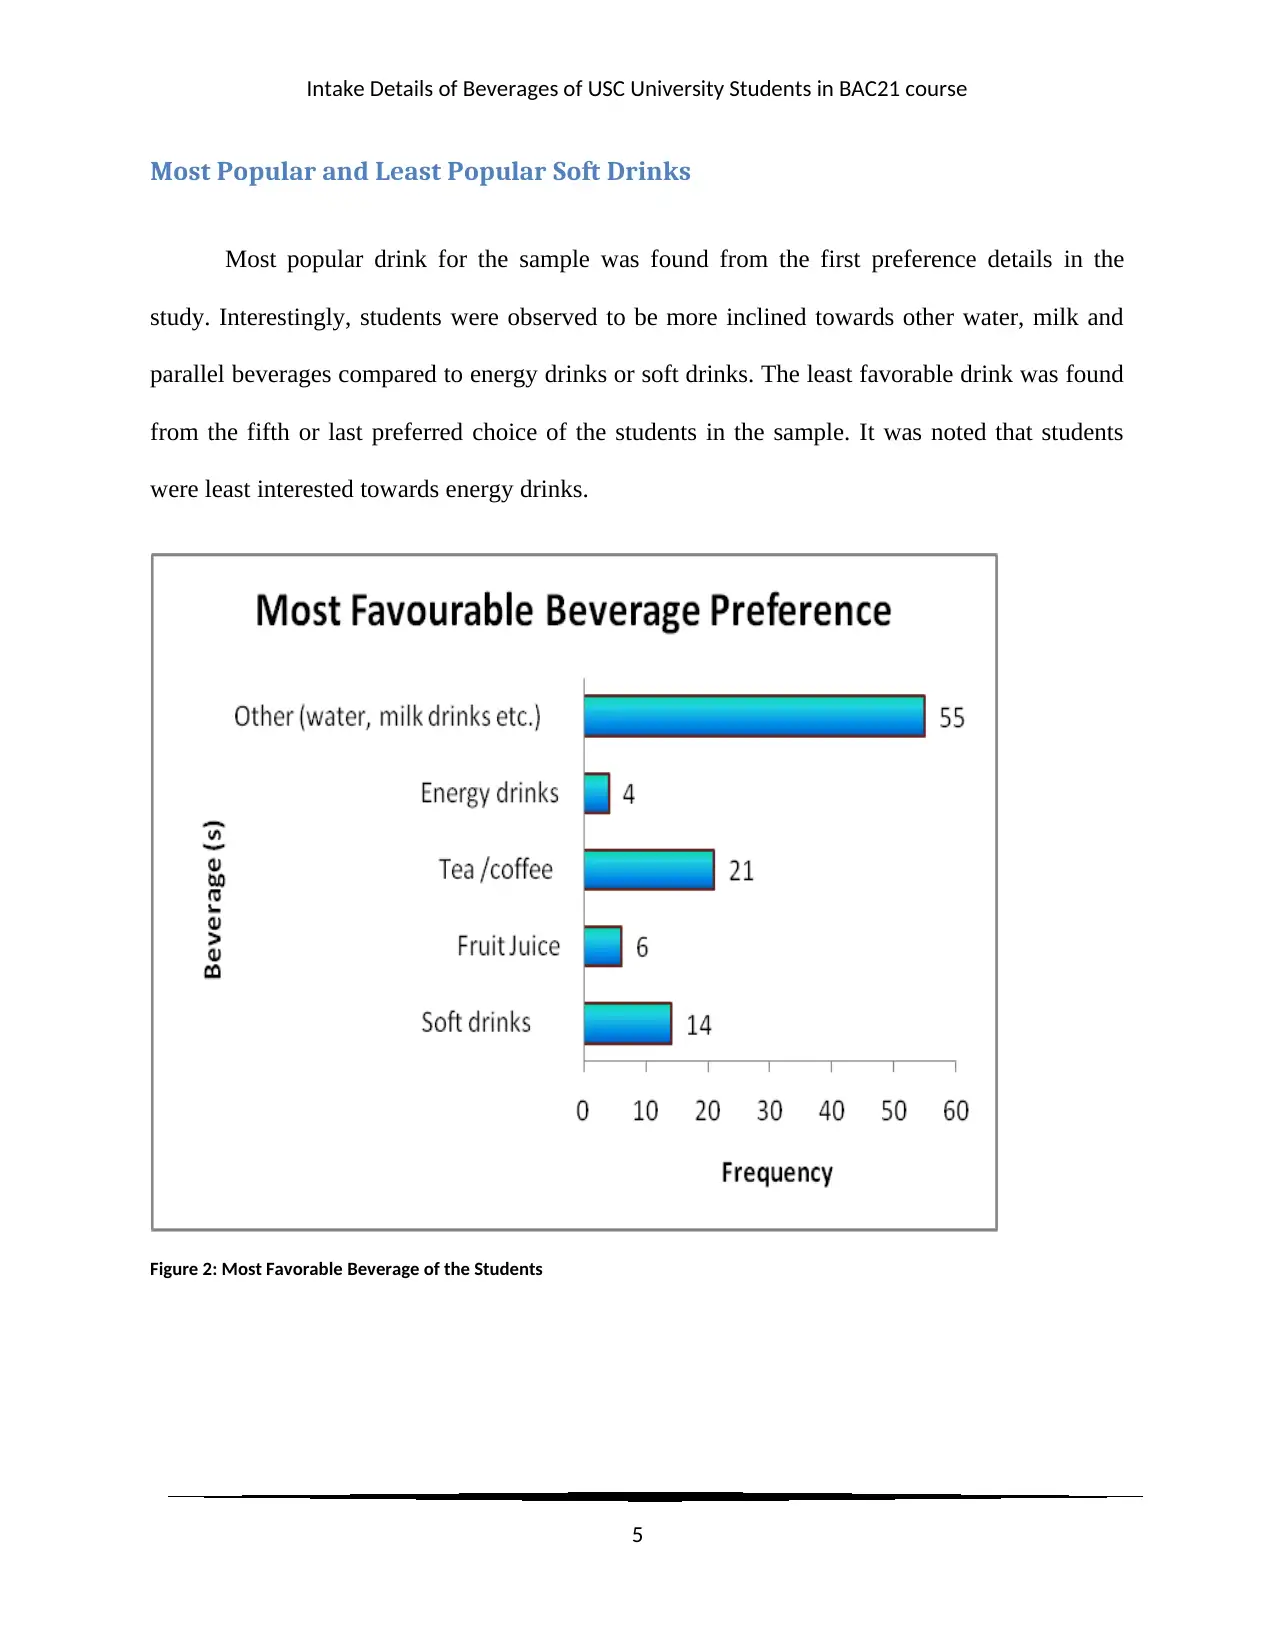
Most Popular and Least Popular Soft Drinks
Most popular drink for the sample was found from the first preference details in the
study. Interestingly, students were observed to be more inclined towards other water, milk and
parallel beverages compared to energy drinks or soft drinks. The least favorable drink was found
from the fifth or last preferred choice of the students in the sample. It was noted that students
were least interested towards energy drinks.
Figure 2: Most Favorable Beverage of the Students
5
Intake Details of Beverages of USC University Students in BAC21 course
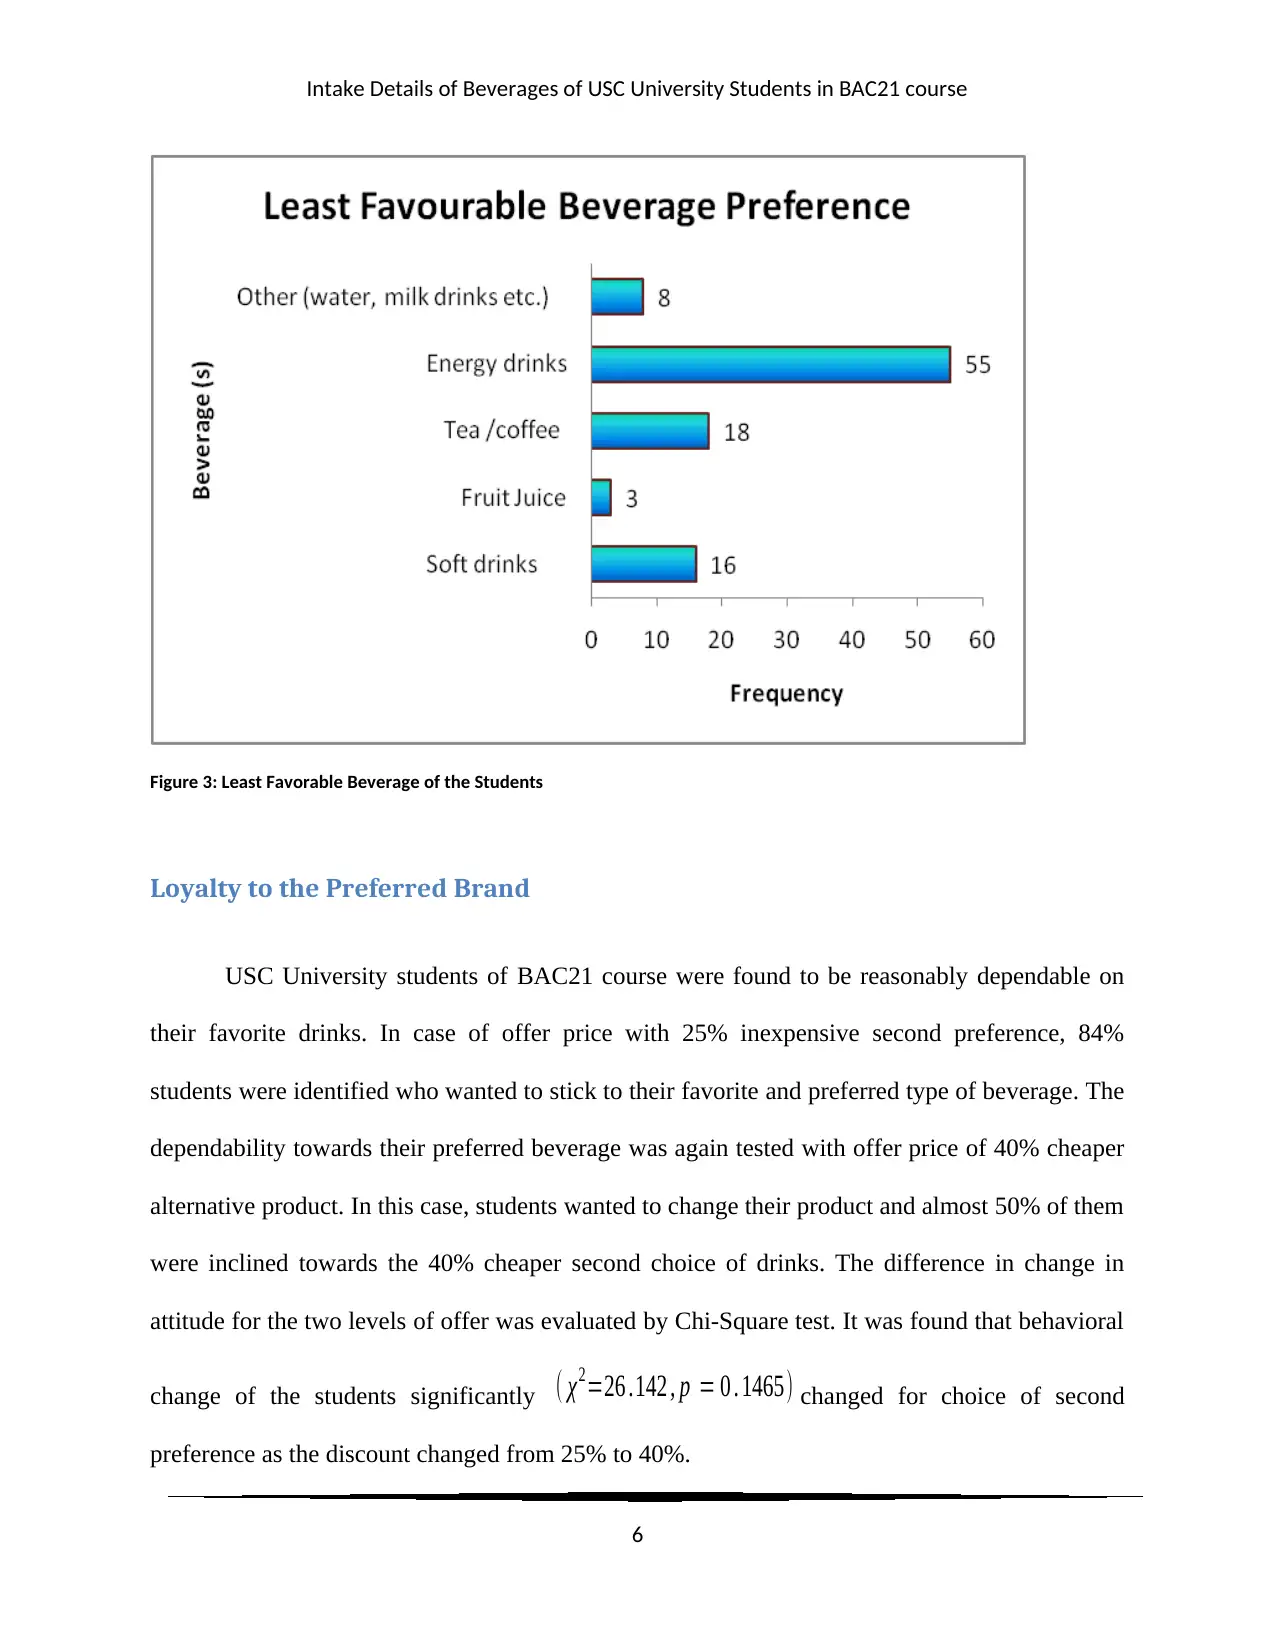
Figure 3: Least Favorable Beverage of the Students
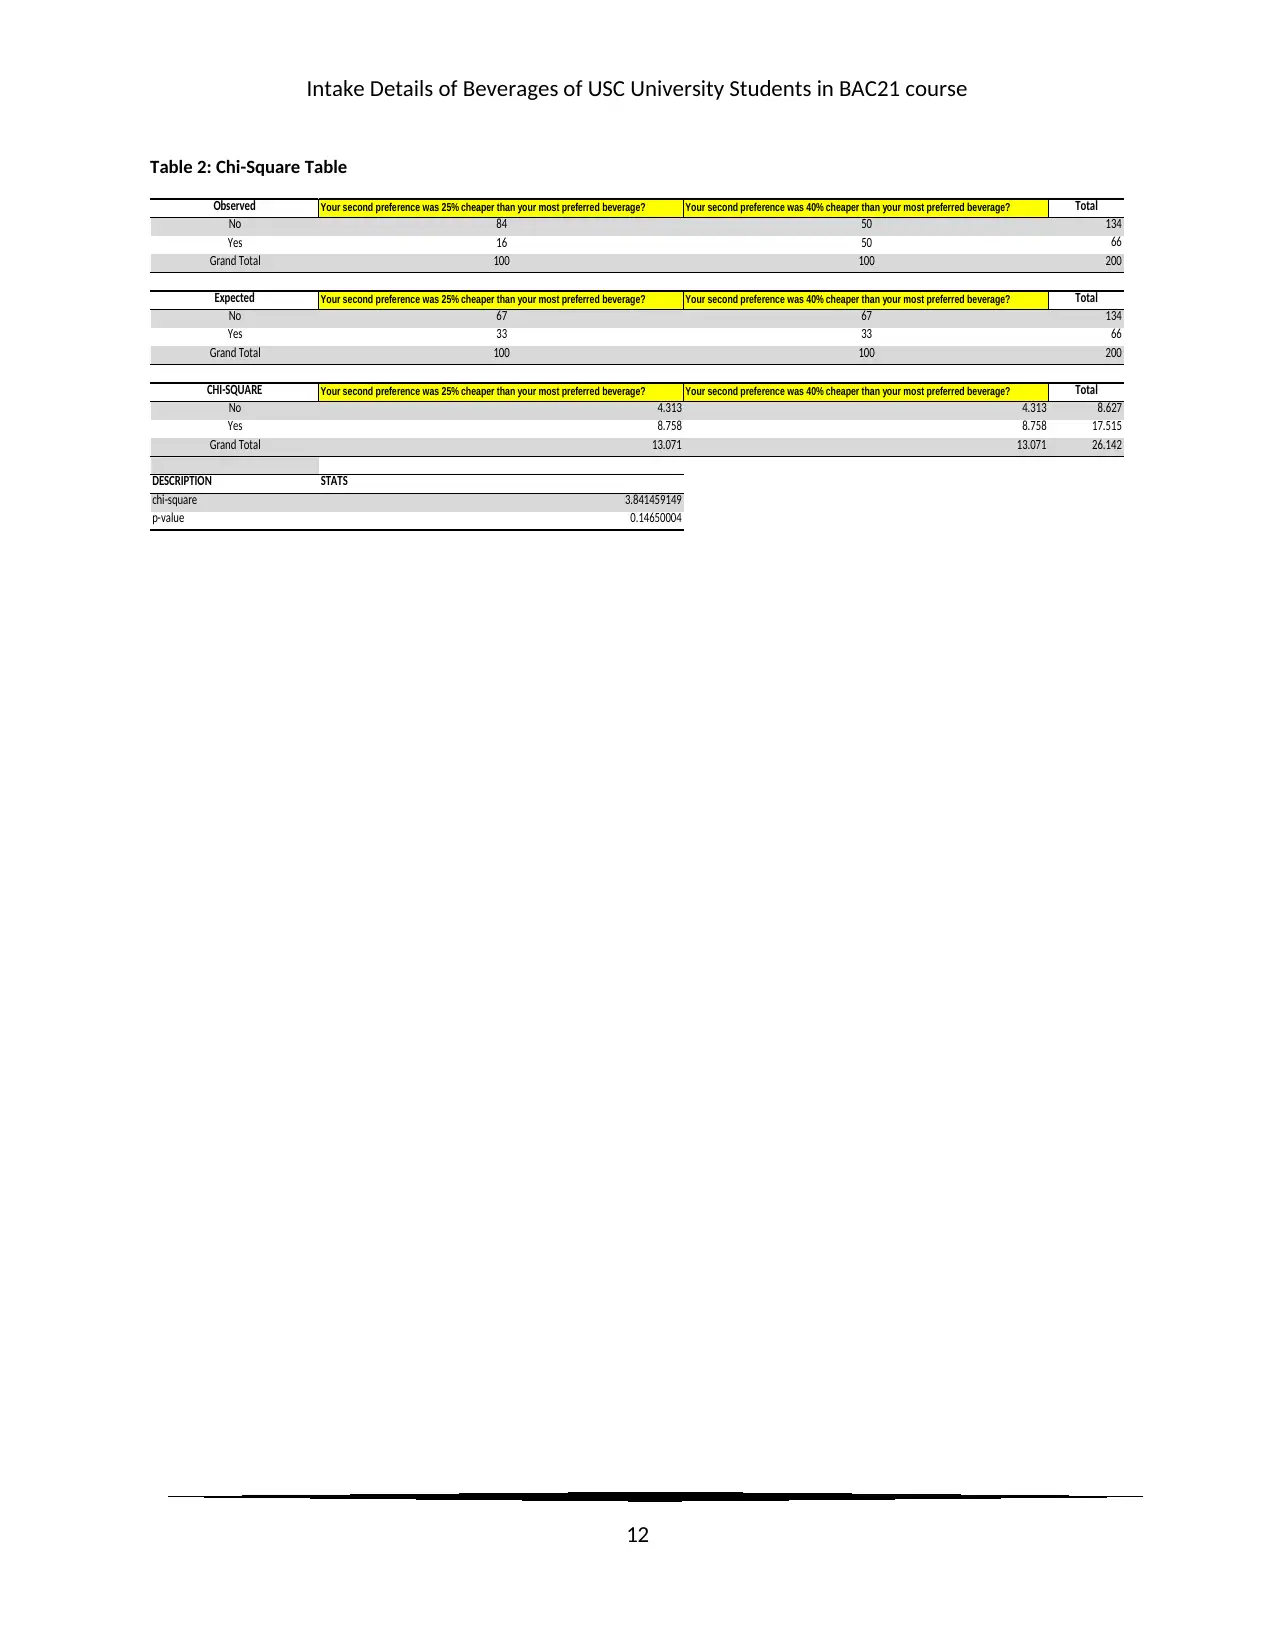
Loyalty to the Preferred Brand
USC University students of BAC21 course were found to be reasonably dependable on
their favorite drinks. In case of offer price with 25% inexpensive second preference, 84%
students were identified who wanted to stick to their favorite and preferred type of beverage. The
dependability towards their preferred beverage was again tested with offer price of 40% cheaper
alternative product. In this case, students wanted to change their product and almost 50% of them
were inclined towards the 40% cheaper second choice of drinks. The difference in change in
attitude for the two levels of offer was evaluated by Chi-Square test. It was found that behavioral
change of the students significantly ( χ2=26 .142 , p = 0 . 1465) changed for choice of second
preference as the discount changed from 25% to 40%.
6
Figure 3: Least Favorable Beverage of the Students
Loyalty to the Preferred Brand
USC University students of BAC21 course were found to be reasonably dependable on
their favorite drinks. In case of offer price with 25% inexpensive second preference, 84%
students were identified who wanted to stick to their favorite and preferred type of beverage. The
dependability towards their preferred beverage was again tested with offer price of 40% cheaper
alternative product. In this case, students wanted to change their product and almost 50% of them
were inclined towards the 40% cheaper second choice of drinks. The difference in change in
attitude for the two levels of offer was evaluated by Chi-Square test. It was found that behavioral
change of the students significantly ( χ2=26 .142 , p = 0 . 1465) changed for choice of second
preference as the discount changed from 25% to 40%.
6
⊘ This is a preview!⊘
Do you want full access?
Subscribe today to unlock all pages.
Trusted by 1+ million students worldwide
Intake Details of Beverages of USC University Students in BAC21 course
Price-Quantity Relationship difference of International and Local Students
The correlation between price levels and overall consumption of beverages was
separately evaluated for domestic and international students. The association between price and
quantity was found to be negative for both the origin of students. The correlation for domestic
students was (r = -0.987, p < 0.05) found to be more strongly negative compared to that of the
foreign students (r = - 0.940, p < 0.05). Both the relations were highly negative and significant at
5% level, indicating that consumption of beverages sharply decreases with gradual increase in
price of the products (Yüksel, 2018).
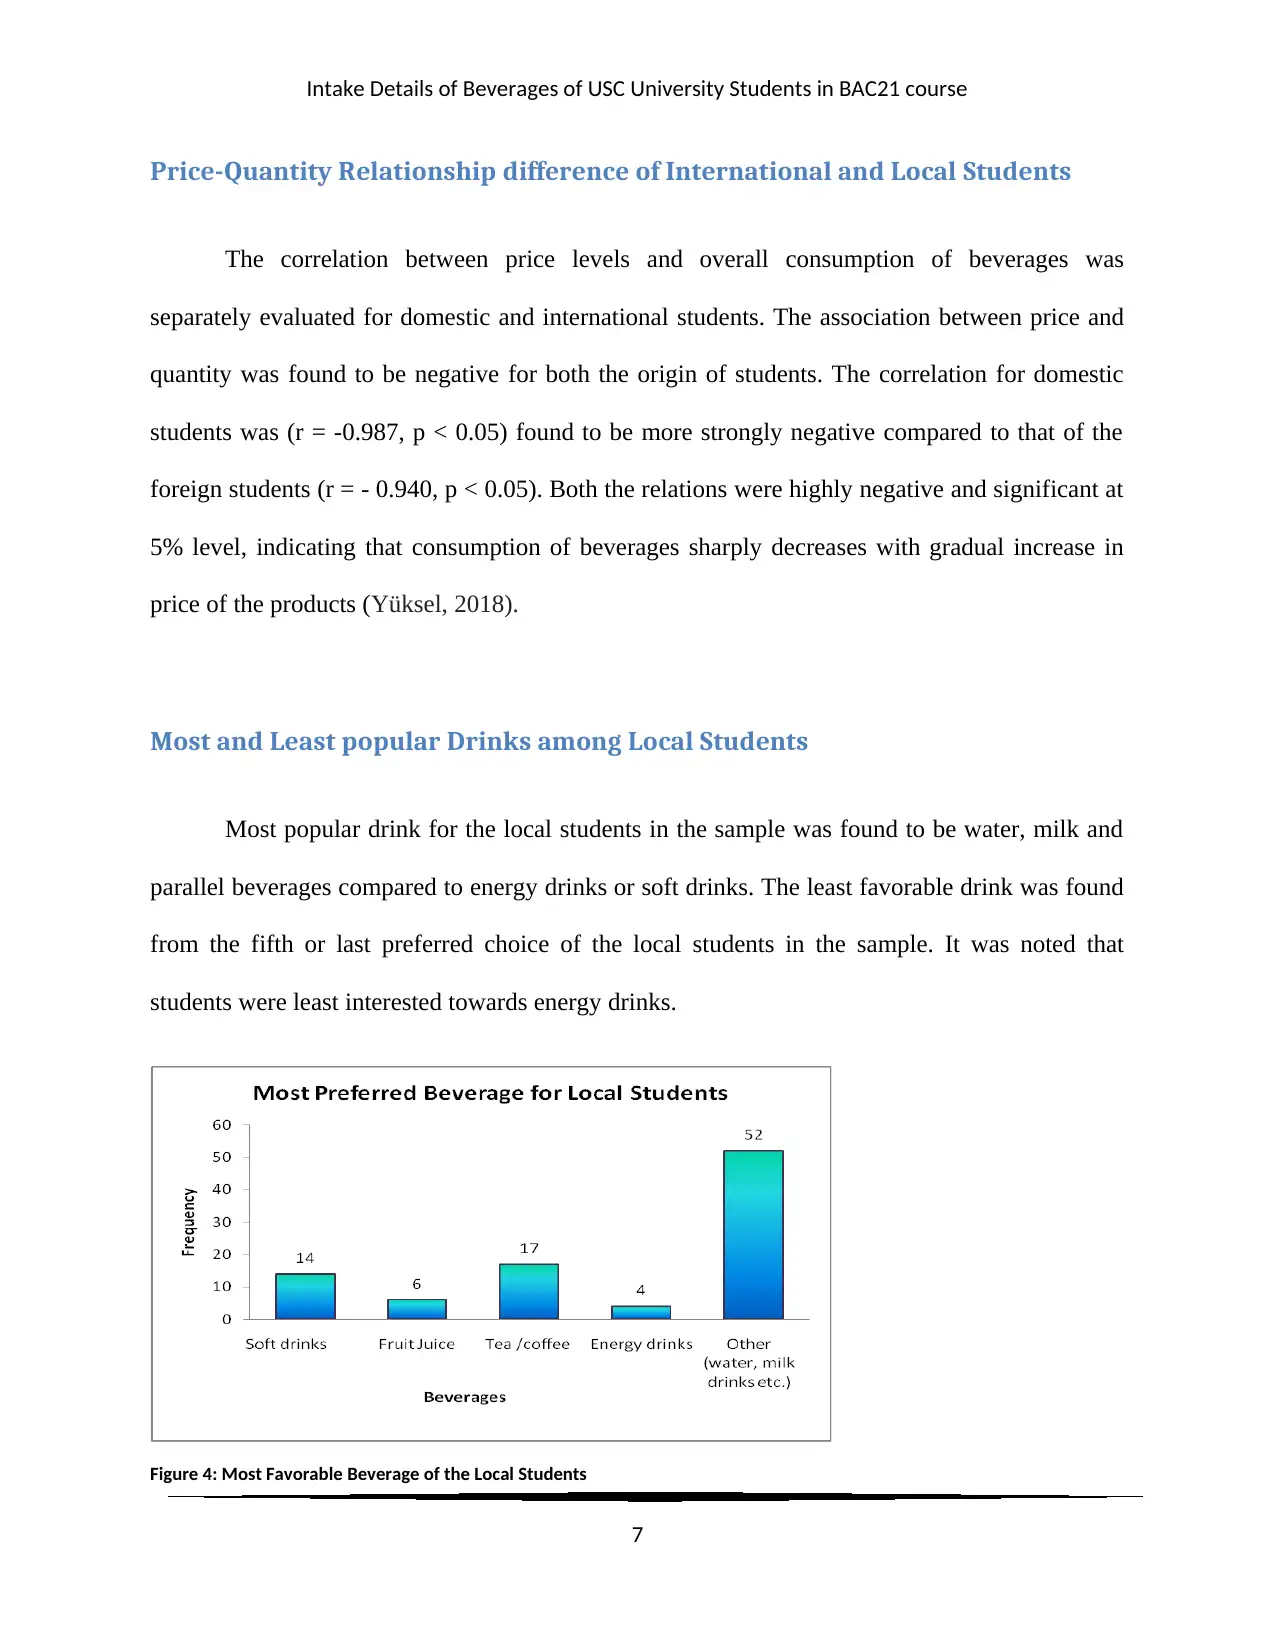
Most and Least popular Drinks among Local Students
Most popular drink for the local students in the sample was found to be water, milk and
parallel beverages compared to energy drinks or soft drinks. The least favorable drink was found
from the fifth or last preferred choice of the local students in the sample. It was noted that
students were least interested towards energy drinks.
Figure 4: Most Favorable Beverage of the Local Students
7
Price-Quantity Relationship difference of International and Local Students
The correlation between price levels and overall consumption of beverages was
separately evaluated for domestic and international students. The association between price and
quantity was found to be negative for both the origin of students. The correlation for domestic
students was (r = -0.987, p < 0.05) found to be more strongly negative compared to that of the
foreign students (r = - 0.940, p < 0.05). Both the relations were highly negative and significant at
5% level, indicating that consumption of beverages sharply decreases with gradual increase in
price of the products (Yüksel, 2018).
Most and Least popular Drinks among Local Students
Most popular drink for the local students in the sample was found to be water, milk and
parallel beverages compared to energy drinks or soft drinks. The least favorable drink was found
from the fifth or last preferred choice of the local students in the sample. It was noted that
students were least interested towards energy drinks.
Figure 4: Most Favorable Beverage of the Local Students
7
Paraphrase This Document
Need a fresh take? Get an instant paraphrase of this document with our AI Paraphraser
Intake Details of Beverages of USC University Students in BAC21 course
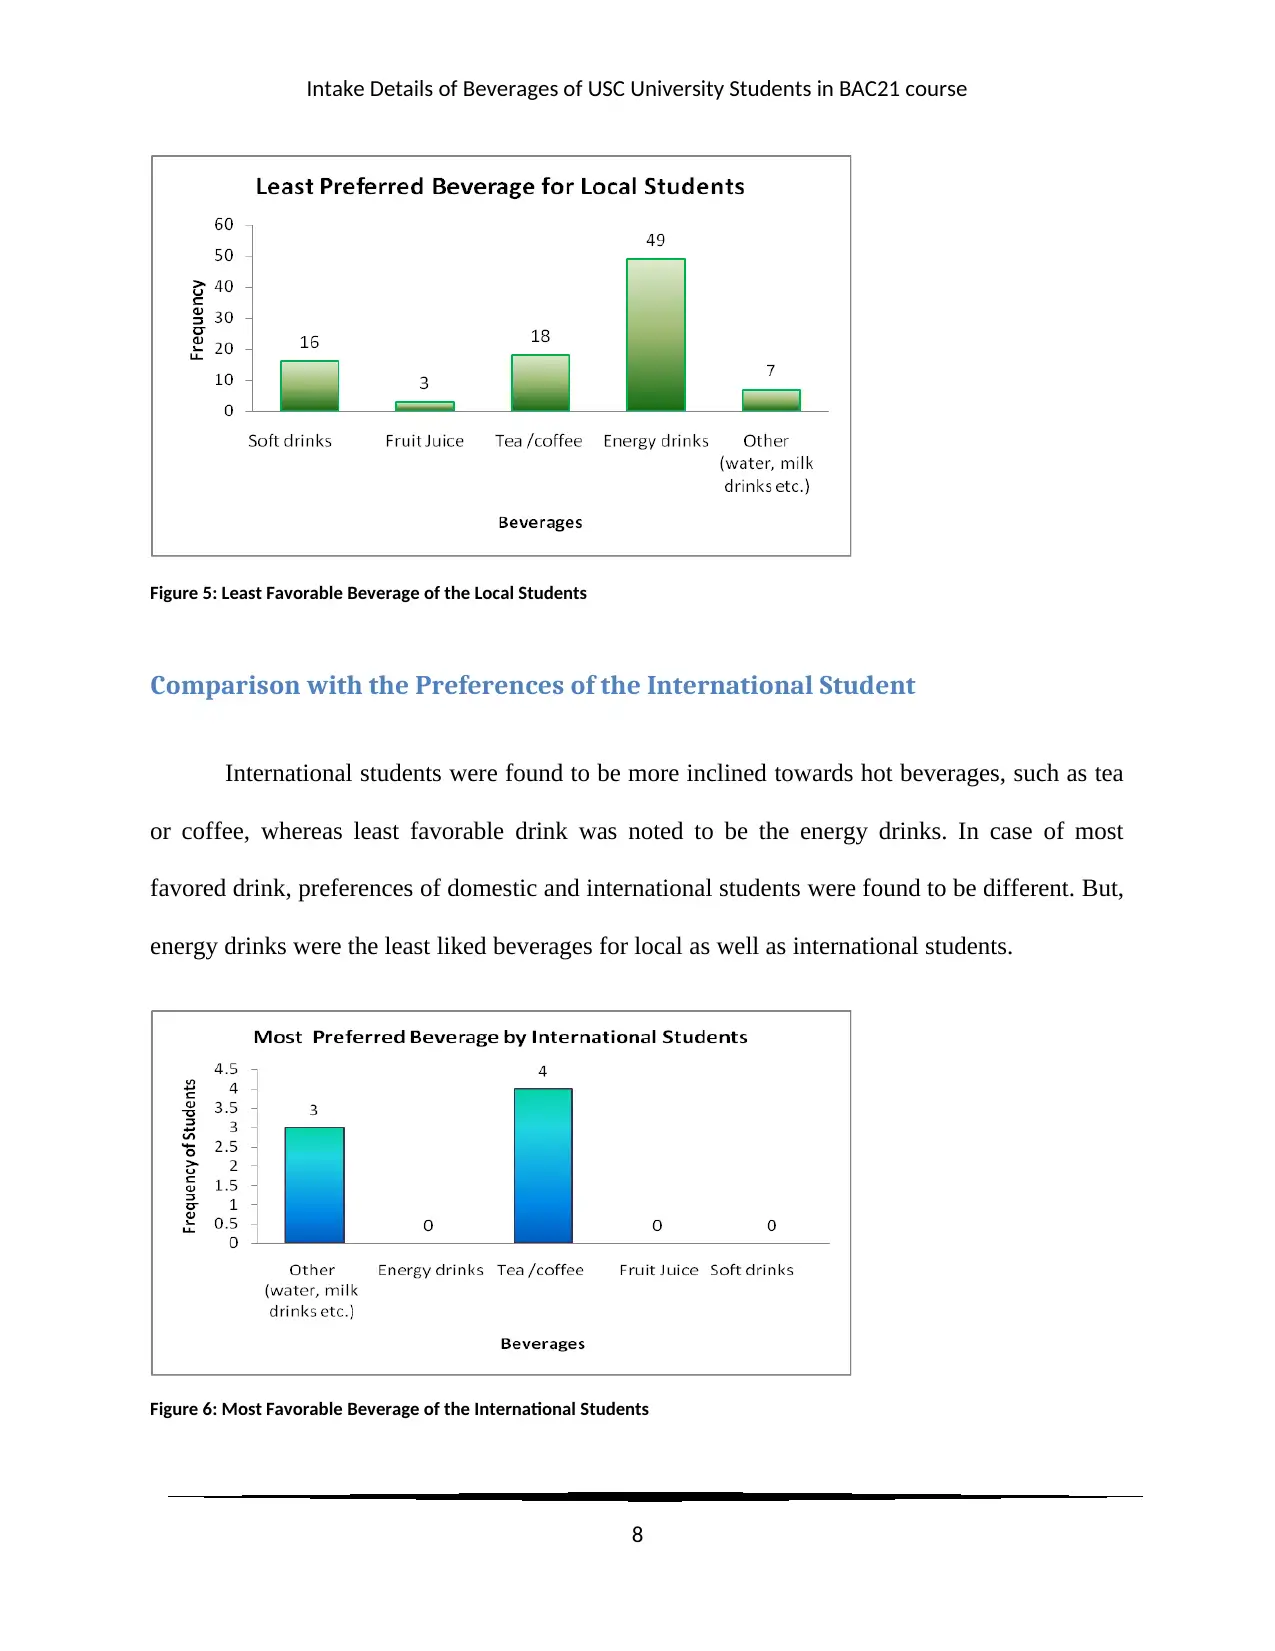
Figure 5: Least Favorable Beverage of the Local Students
Comparison with the Preferences of the International Student
International students were found to be more inclined towards hot beverages, such as tea
or coffee, whereas least favorable drink was noted to be the energy drinks. In case of most
favored drink, preferences of domestic and international students were found to be different. But,
energy drinks were the least liked beverages for local as well as international students.
Figure 6: Most Favorable Beverage of the International Students
8
Intake Details of Beverages of USC University Students in BAC21 course
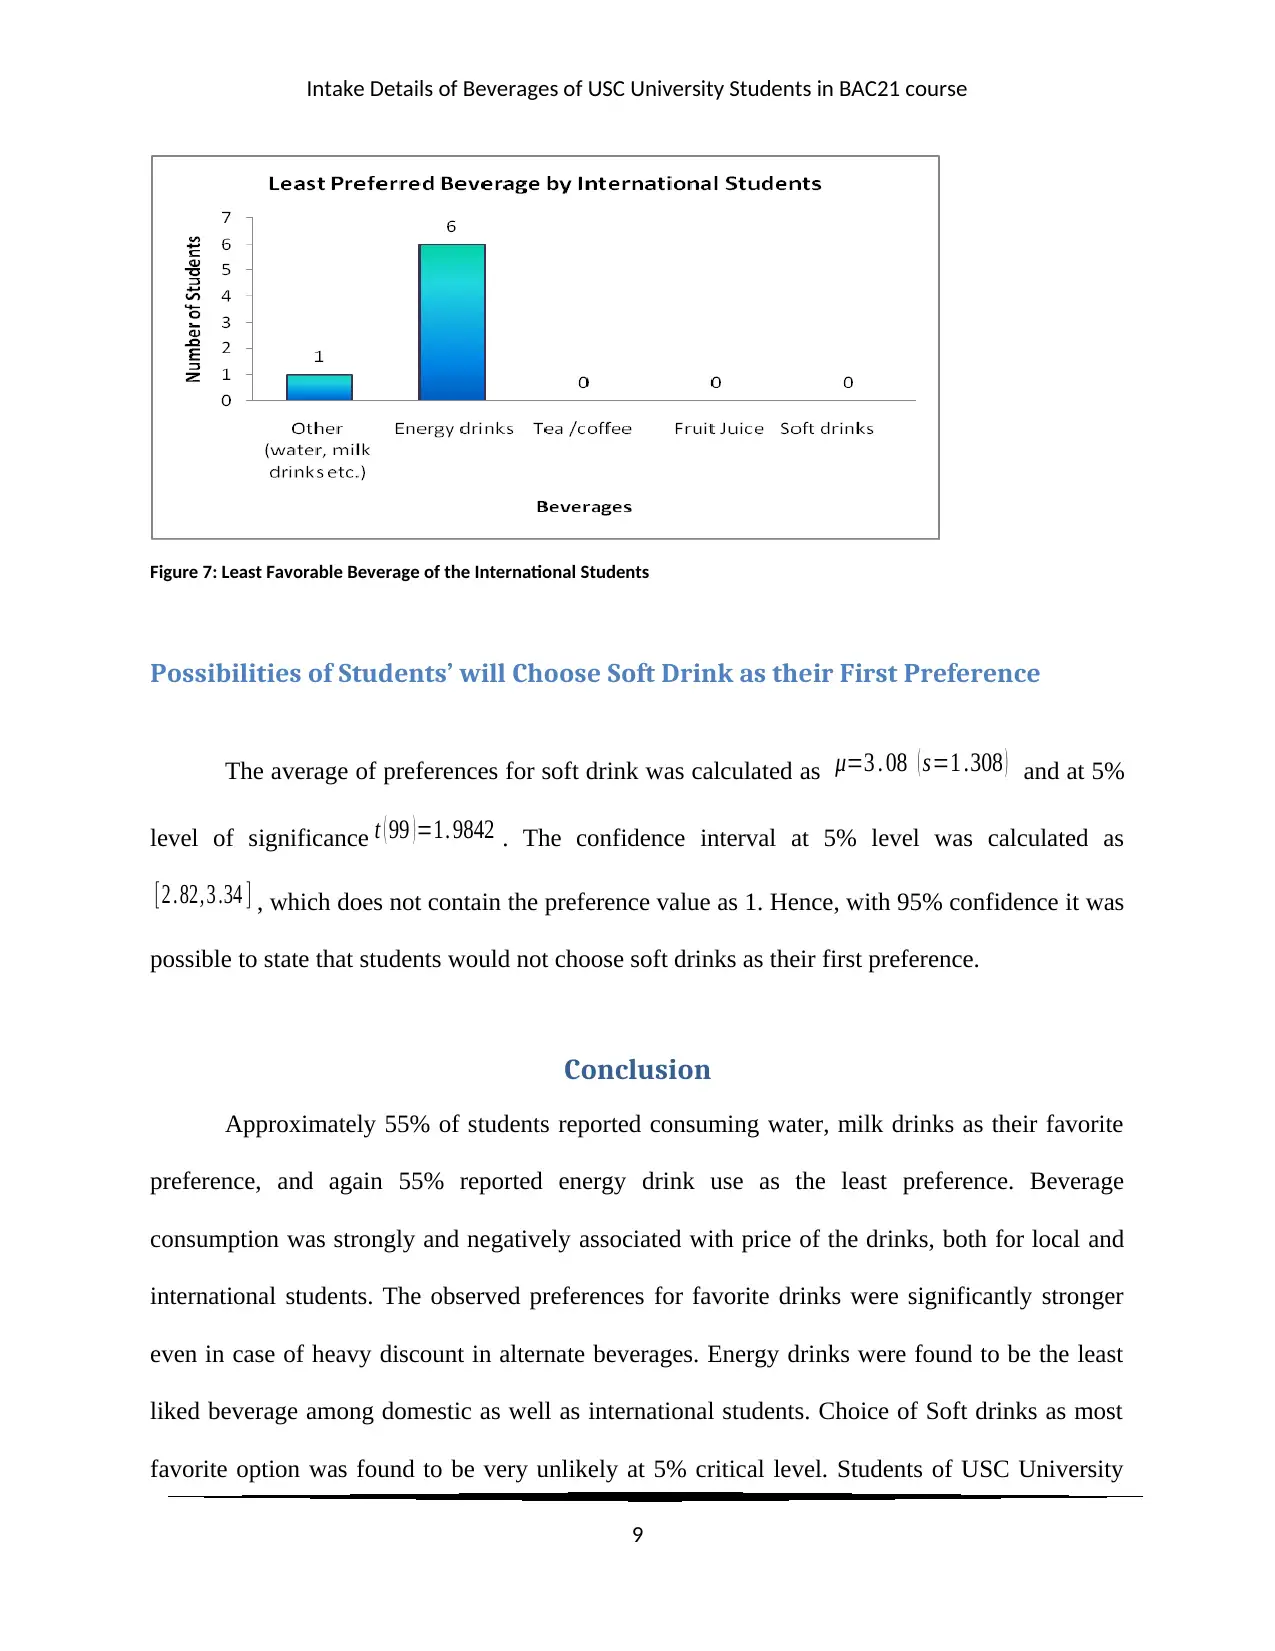
Figure 7: Least Favorable Beverage of the International Students
Possibilities of Students’ will Choose Soft Drink as their First Preference
The average of preferences for soft drink was calculated as μ=3 . 08 ( s=1 .308 ) and at 5%
level of significance t ( 99 ) =1. 9842 . The confidence interval at 5% level was calculated as
[ 2 . 82, 3 .34 ] , which does not contain the preference value as 1. Hence, with 95% confidence it was
possible to state that students would not choose soft drinks as their first preference.
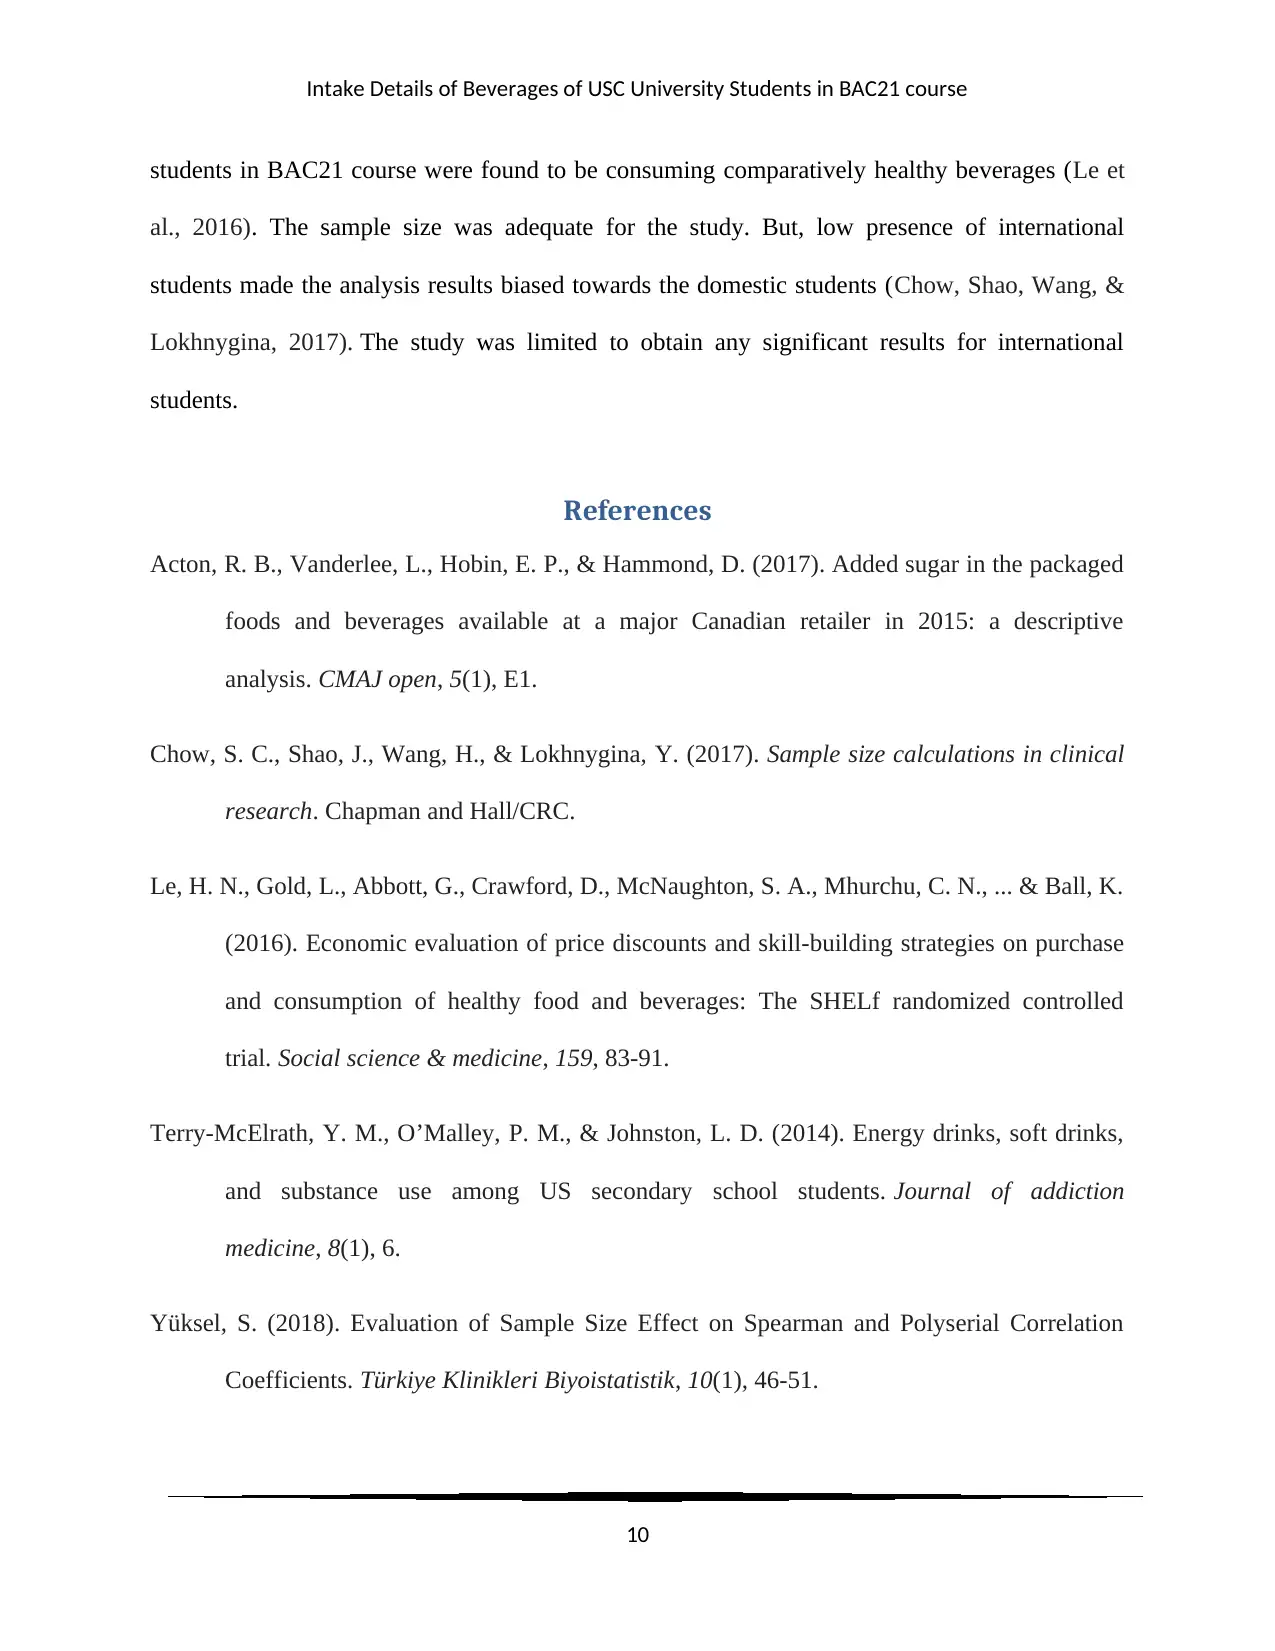
Conclusion
Approximately 55% of students reported consuming water, milk drinks as their favorite
preference, and again 55% reported energy drink use as the least preference. Beverage
consumption was strongly and negatively associated with price of the drinks, both for local and
international students. The observed preferences for favorite drinks were significantly stronger
even in case of heavy discount in alternate beverages. Energy drinks were found to be the least
liked beverage among domestic as well as international students. Choice of Soft drinks as most
favorite option was found to be very unlikely at 5% critical level. Students of USC University
9
Figure 7: Least Favorable Beverage of the International Students
Possibilities of Students’ will Choose Soft Drink as their First Preference
The average of preferences for soft drink was calculated as μ=3 . 08 ( s=1 .308 ) and at 5%
level of significance t ( 99 ) =1. 9842 . The confidence interval at 5% level was calculated as
[ 2 . 82, 3 .34 ] , which does not contain the preference value as 1. Hence, with 95% confidence it was
possible to state that students would not choose soft drinks as their first preference.
Conclusion
Approximately 55% of students reported consuming water, milk drinks as their favorite
preference, and again 55% reported energy drink use as the least preference. Beverage
consumption was strongly and negatively associated with price of the drinks, both for local and
international students. The observed preferences for favorite drinks were significantly stronger
even in case of heavy discount in alternate beverages. Energy drinks were found to be the least
liked beverage among domestic as well as international students. Choice of Soft drinks as most
favorite option was found to be very unlikely at 5% critical level. Students of USC University
9
⊘ This is a preview!⊘
Do you want full access?
Subscribe today to unlock all pages.
Trusted by 1+ million students worldwide
Intake Details of Beverages of USC University Students in BAC21 course
students in BAC21 course were found to be consuming comparatively healthy beverages (Le et
al., 2016). The sample size was adequate for the study. But, low presence of international
students made the analysis results biased towards the domestic students (Chow, Shao, Wang, &
Lokhnygina, 2017). The study was limited to obtain any significant results for international
students.
References
Acton, R. B., Vanderlee, L., Hobin, E. P., & Hammond, D. (2017). Added sugar in the packaged
foods and beverages available at a major Canadian retailer in 2015: a descriptive
analysis. CMAJ open, 5(1), E1.
Chow, S. C., Shao, J., Wang, H., & Lokhnygina, Y. (2017). Sample size calculations in clinical
research. Chapman and Hall/CRC.
Le, H. N., Gold, L., Abbott, G., Crawford, D., McNaughton, S. A., Mhurchu, C. N., ... & Ball, K.
(2016). Economic evaluation of price discounts and skill-building strategies on purchase
and consumption of healthy food and beverages: The SHELf randomized controlled
trial. Social science & medicine, 159, 83-91.
Terry-McElrath, Y. M., O’Malley, P. M., & Johnston, L. D. (2014). Energy drinks, soft drinks,
and substance use among US secondary school students. Journal of addiction
medicine, 8(1), 6.
Yüksel, S. (2018). Evaluation of Sample Size Effect on Spearman and Polyserial Correlation
Coefficients. Türkiye Klinikleri Biyoistatistik, 10(1), 46-51.
10
Paraphrase This Document
Need a fresh take? Get an instant paraphrase of this document with our AI Paraphraser
Intake Details of Beverages of USC University Students in BAC21 course
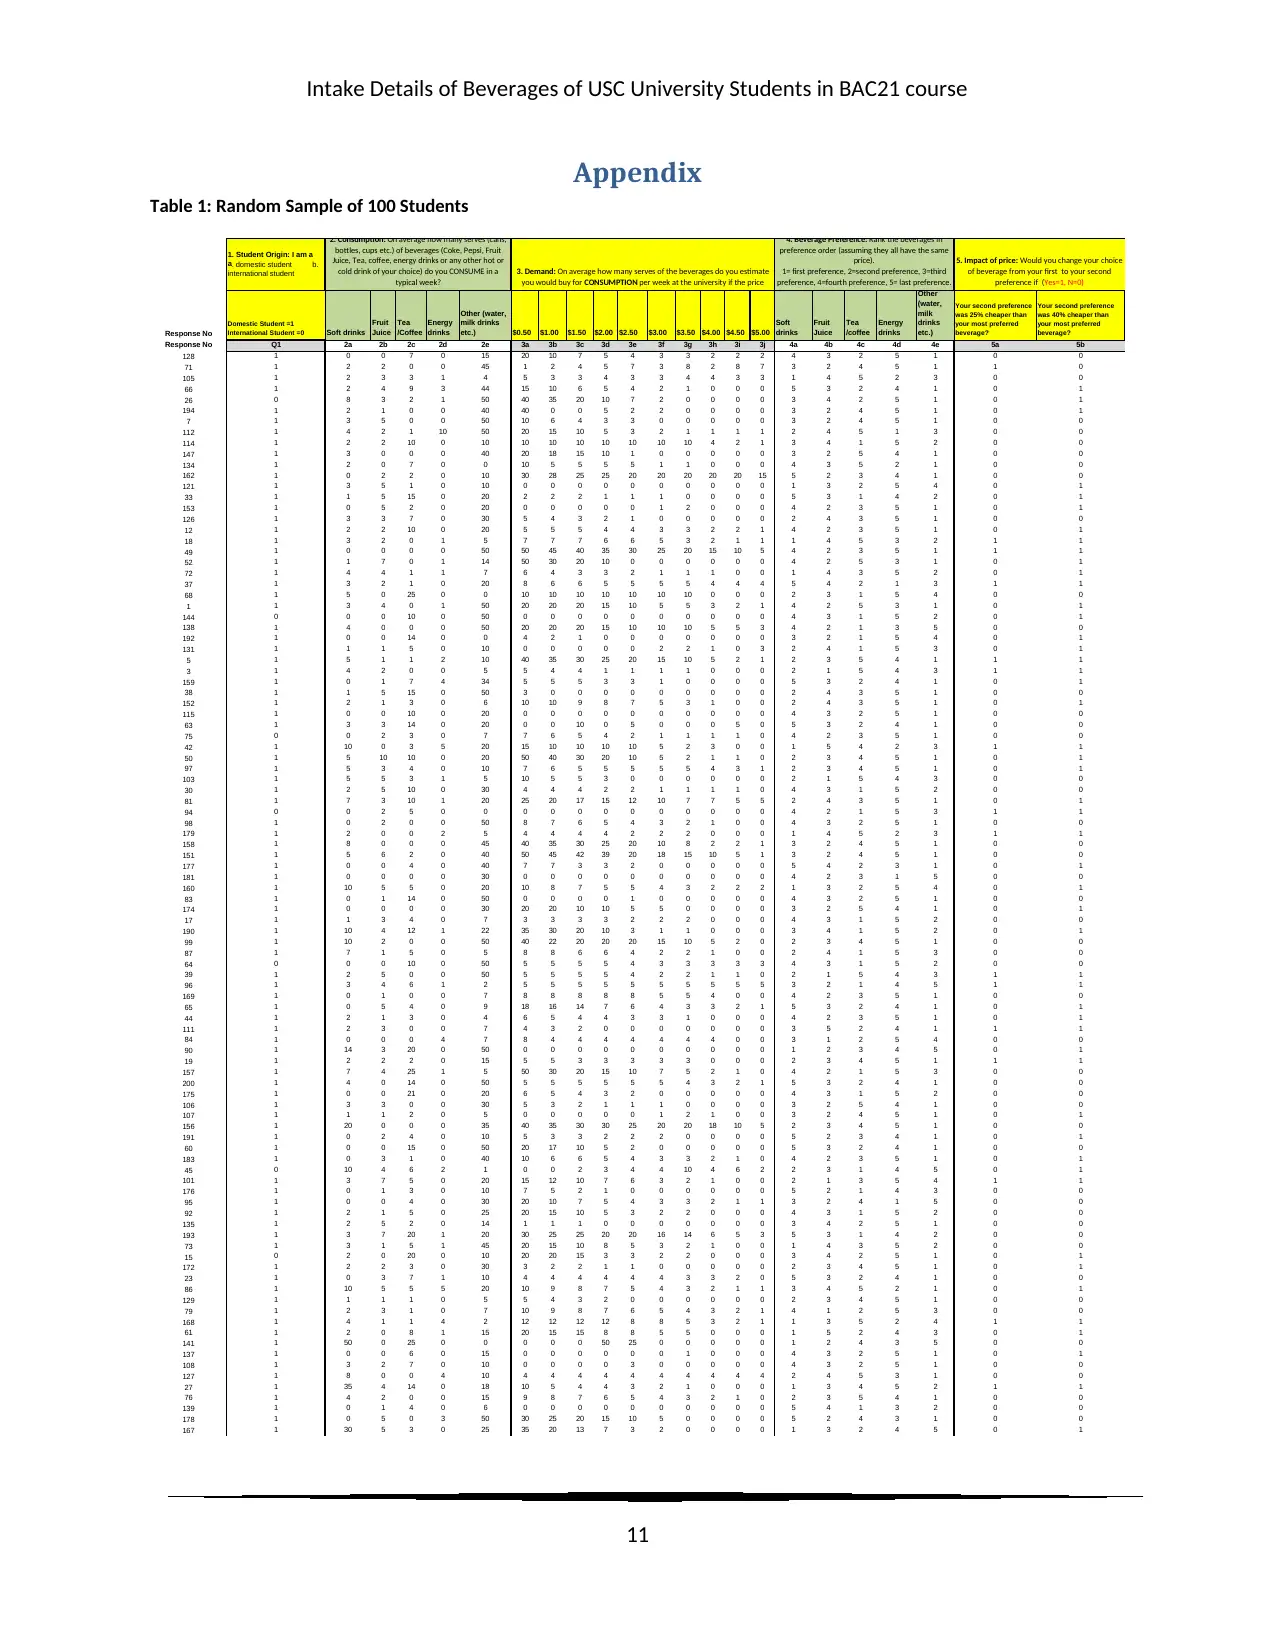
Appendix
Table 1: Random Sample of 100 Students
1. Student Origin: I am a
a. domestic student b.
international student
Response No
Domestic Student =1
International Student =0 Soft drinks
Fruit
Juice
Tea
/Coffee
Energy
drinks
Other (water,
milk drinks
etc.) $0.50 $1.00 $1.50 $2.00 $2.50 $3.00 $3.50 $4.00 $4.50 $5.00
Soft
drinks
Fruit
Juice
Tea
/coffee
Energy
drinks
Other
(water,
milk
drinks
etc.)
Your second preference
was 25% cheaper than
your most preferred
beverage?
Your second preference
was 40% cheaper than
your most preferred
beverage?
Response No Q1 2a 2b 2c 2d 2e 3a 3b 3c 3d 3e 3f 3g 3h 3i 3j 4a 4b 4c 4d 4e 5a 5b
128 1 0 0 7 0 15 20 10 7 5 4 3 3 2 2 2 4 3 2 5 1 0 0
71 1 2 2 0 0 45 1 2 4 5 7 3 8 2 8 7 3 2 4 5 1 1 0
105 1 2 3 3 1 4 5 3 3 4 3 3 4 4 3 3 1 4 5 2 3 0 0
66 1 2 4 9 3 44 15 10 6 5 4 2 1 0 0 0 5 3 2 4 1 0 1
26 0 8 3 2 1 50 40 35 20 10 7 2 0 0 0 0 3 4 2 5 1 0 1
194 1 2 1 0 0 40 40 0 0 5 2 2 0 0 0 0 3 2 4 5 1 0 1
7 1 3 5 0 0 50 10 6 4 3 3 0 0 0 0 0 3 2 4 5 1 0 0
112 1 4 2 1 10 50 20 15 10 5 3 2 1 1 1 1 2 4 5 1 3 0 0
114 1 2 2 10 0 10 10 10 10 10 10 10 10 4 2 1 3 4 1 5 2 0 0
147 1 3 0 0 0 40 20 18 15 10 1 0 0 0 0 0 3 2 5 4 1 0 0
134 1 2 0 7 0 0 10 5 5 5 5 1 1 0 0 0 4 3 5 2 1 0 0
162 1 0 2 2 0 10 30 28 25 25 20 20 20 20 20 15 5 2 3 4 1 0 0
121 1 3 5 1 0 10 0 0 0 0 0 0 0 0 0 0 1 3 2 5 4 0 1
33 1 1 5 15 0 20 2 2 2 1 1 1 0 0 0 0 5 3 1 4 2 0 1
153 1 0 5 2 0 20 0 0 0 0 0 1 2 0 0 0 4 2 3 5 1 0 1
126 1 3 3 7 0 30 5 4 3 2 1 0 0 0 0 0 2 4 3 5 1 0 0
12 1 2 2 10 0 20 5 5 5 4 4 3 3 2 2 1 4 2 3 5 1 0 1
18 1 3 2 0 1 5 7 7 7 6 6 5 3 2 1 1 1 4 5 3 2 1 1
49 1 0 0 0 0 50 50 45 40 35 30 25 20 15 10 5 4 2 3 5 1 1 1
52 1 1 7 0 1 14 50 30 20 10 0 0 0 0 0 0 4 2 5 3 1 0 1
72 1 4 4 1 1 7 6 4 3 3 2 1 1 1 0 0 1 4 3 5 2 0 1
37 1 3 2 1 0 20 8 6 6 5 5 5 5 4 4 4 5 4 2 1 3 1 1
68 1 5 0 25 0 0 10 10 10 10 10 10 10 0 0 0 2 3 1 5 4 0 0
1 1 3 4 0 1 50 20 20 20 15 10 5 5 3 2 1 4 2 5 3 1 0 1
144 0 0 0 10 0 50 0 0 0 0 0 0 0 0 0 0 4 3 1 5 2 0 1
138 1 4 0 0 0 50 20 20 20 15 10 10 10 5 5 3 4 2 1 3 5 0 0
192 1 0 0 14 0 0 4 2 1 0 0 0 0 0 0 0 3 2 1 5 4 0 1
131 1 1 1 5 0 10 0 0 0 0 0 2 2 1 0 3 2 4 1 5 3 0 1
5 1 5 1 1 2 10 40 35 30 25 20 15 10 5 2 1 2 3 5 4 1 1 1
3 1 4 2 0 0 5 5 4 4 1 1 1 1 0 0 0 2 1 5 4 3 1 1
159 1 0 1 7 4 34 5 5 5 3 3 1 0 0 0 0 5 3 2 4 1 0 1
38 1 1 5 15 0 50 3 0 0 0 0 0 0 0 0 0 2 4 3 5 1 0 0
152 1 2 1 3 0 6 10 10 9 8 7 5 3 1 0 0 2 4 3 5 1 0 1
115 1 0 0 10 0 20 0 0 0 0 0 0 0 0 0 0 4 3 2 5 1 0 0
63 1 3 3 14 0 20 0 0 10 0 5 0 0 0 5 0 5 3 2 4 1 0 0
75 0 0 2 3 0 7 7 6 5 4 2 1 1 1 1 0 4 2 3 5 1 0 0
42 1 10 0 3 5 20 15 10 10 10 10 5 2 3 0 0 1 5 4 2 3 1 1
50 1 5 10 10 0 20 50 40 30 20 10 5 2 1 1 0 2 3 4 5 1 0 1
97 1 5 3 4 0 10 7 6 5 5 5 5 5 4 3 1 2 3 4 5 1 0 1
103 1 5 5 3 1 5 10 5 5 3 0 0 0 0 0 0 2 1 5 4 3 0 0
30 1 2 5 10 0 30 4 4 4 2 2 1 1 1 1 0 4 3 1 5 2 0 0
81 1 7 3 10 1 20 25 20 17 15 12 10 7 7 5 5 2 4 3 5 1 0 1
94 0 0 2 5 0 0 0 0 0 0 0 0 0 0 0 0 4 2 1 5 3 1 1
98 1 0 2 0 0 50 8 7 6 5 4 3 2 1 0 0 4 3 2 5 1 0 0
179 1 2 0 0 2 5 4 4 4 4 2 2 2 0 0 0 1 4 5 2 3 1 1
158 1 8 0 0 0 45 40 35 30 25 20 10 8 2 2 1 3 2 4 5 1 0 0
151 1 5 6 2 0 40 50 45 42 39 20 18 15 10 5 1 3 2 4 5 1 0 0
177 1 0 0 4 0 40 7 7 3 3 2 0 0 0 0 0 5 4 2 3 1 0 1
181 1 0 0 0 0 30 0 0 0 0 0 0 0 0 0 0 4 2 3 1 5 0 0
160 1 10 5 5 0 20 10 8 7 5 5 4 3 2 2 2 1 3 2 5 4 0 1
83 1 0 1 14 0 50 0 0 0 0 1 0 0 0 0 0 4 3 2 5 1 0 0
174 1 0 0 0 0 30 20 20 10 10 5 5 0 0 0 0 3 2 5 4 1 0 1
17 1 1 3 4 0 7 3 3 3 3 2 2 2 0 0 0 4 3 1 5 2 0 0
190 1 10 4 12 1 22 35 30 20 10 3 1 1 0 0 0 3 4 1 5 2 0 1
99 1 10 2 0 0 50 40 22 20 20 20 15 10 5 2 0 2 3 4 5 1 0 0
87 1 7 1 5 0 5 8 8 6 6 4 2 2 1 0 0 2 4 1 5 3 0 0
64 0 0 0 10 0 50 5 5 5 5 4 3 3 3 3 3 4 3 1 5 2 0 0
39 1 2 5 0 0 50 5 5 5 5 4 2 2 1 1 0 2 1 5 4 3 1 1
96 1 3 4 6 1 2 5 5 5 5 5 5 5 5 5 5 3 2 1 4 5 1 1
169 1 0 1 0 0 7 8 8 8 8 8 5 5 4 0 0 4 2 3 5 1 0 0
65 1 0 5 4 0 9 18 16 14 7 6 4 3 3 2 1 5 3 2 4 1 0 1
44 1 2 1 3 0 4 6 5 4 4 3 3 1 0 0 0 4 2 3 5 1 0 1
111 1 2 3 0 0 7 4 3 2 0 0 0 0 0 0 0 3 5 2 4 1 1 1
84 1 0 0 0 4 7 8 4 4 4 4 4 4 4 0 0 3 1 2 5 4 0 0
90 1 14 3 20 0 50 0 0 0 0 0 0 0 0 0 0 1 2 3 4 5 0 1
19 1 2 2 2 0 15 5 5 3 3 3 3 3 0 0 0 2 3 4 5 1 1 1
157 1 7 4 25 1 5 50 30 20 15 10 7 5 2 1 0 4 2 1 5 3 0 0
200 1 4 0 14 0 50 5 5 5 5 5 5 4 3 2 1 5 3 2 4 1 0 0
175 1 0 0 21 0 20 6 5 4 3 2 0 0 0 0 0 4 3 1 5 2 0 0
106 1 3 3 0 0 30 5 3 2 1 1 1 0 0 0 0 3 2 5 4 1 0 0
107 1 1 1 2 0 5 0 0 0 0 0 1 2 1 0 0 3 2 4 5 1 0 1
156 1 20 0 0 0 35 40 35 30 30 25 20 20 18 10 5 2 3 4 5 1 0 0
191 1 0 2 4 0 10 5 3 3 2 2 2 0 0 0 0 5 2 3 4 1 0 1
60 1 0 0 15 0 50 20 17 10 5 2 0 0 0 0 0 5 3 2 4 1 0 0
183 1 0 3 1 0 40 10 6 6 5 4 3 3 2 1 0 4 2 3 5 1 0 1
45 0 10 4 6 2 1 0 0 2 3 4 4 10 4 6 2 2 3 1 4 5 0 1
101 1 3 7 5 0 20 15 12 10 7 6 3 2 1 0 0 2 1 3 5 4 1 1
176 1 0 1 3 0 10 7 5 2 1 0 0 0 0 0 0 5 2 1 4 3 0 0
95 1 0 0 4 0 30 20 10 7 5 4 3 3 2 1 1 3 2 4 1 5 0 0
92 1 2 1 5 0 25 20 15 10 5 3 2 2 0 0 0 4 3 1 5 2 0 0
135 1 2 5 2 0 14 1 1 1 0 0 0 0 0 0 0 3 4 2 5 1 0 0
193 1 3 7 20 1 20 30 25 25 20 20 16 14 6 5 3 5 3 1 4 2 0 0
73 1 3 1 5 1 45 20 15 10 8 5 3 2 1 0 0 1 4 3 5 2 0 0
15 0 2 0 20 0 10 20 20 15 3 3 2 2 0 0 0 3 4 2 5 1 0 1
172 1 2 2 3 0 30 3 2 2 1 1 0 0 0 0 0 2 3 4 5 1 0 1
23 1 0 3 7 1 10 4 4 4 4 4 4 3 3 2 0 5 3 2 4 1 0 0
86 1 10 5 5 5 20 10 9 8 7 5 4 3 2 1 1 3 4 5 2 1 0 1
129 1 1 1 1 0 5 5 4 3 2 0 0 0 0 0 0 2 3 4 5 1 0 0
79 1 2 3 1 0 7 10 9 8 7 6 5 4 3 2 1 4 1 2 5 3 0 0
168 1 4 1 1 4 2 12 12 12 12 8 8 5 3 2 1 1 3 5 2 4 1 1
61 1 2 0 8 1 15 20 15 15 8 8 5 5 0 0 0 1 5 2 4 3 0 1
141 1 50 0 25 0 0 0 0 0 50 25 0 0 0 0 0 1 2 4 3 5 0 0
137 1 0 0 6 0 15 0 0 0 0 0 0 1 0 0 0 4 3 2 5 1 0 1
108 1 3 2 7 0 10 0 0 0 0 3 0 0 0 0 0 4 3 2 5 1 0 0
127 1 8 0 0 4 10 4 4 4 4 4 4 4 4 4 4 2 4 5 3 1 0 0
27 1 35 4 14 0 18 10 5 4 4 3 2 1 0 0 0 1 3 4 5 2 1 1
76 1 4 2 0 0 15 9 8 7 6 5 4 3 2 1 0 2 3 5 4 1 0 0
139 1 0 1 4 0 6 0 0 0 0 0 0 0 0 0 0 5 4 1 3 2 0 0
178 1 0 5 0 3 50 30 25 20 15 10 5 0 0 0 0 5 2 4 3 1 0 0
167 1 30 5 3 0 25 35 20 13 7 3 2 0 0 0 0 1 3 2 4 5 0 1
2. Consumption: On average how many serves (cans,
bottles, cups etc.) of beverages (Coke, Pepsi, Fruit
Juice, Tea, coffee, energy drinks or any other hot or
cold drink of your choice) do you CONSUME in a
typical week?
3. Demand: On average how many serves of the beverages do you estimate
you would buy for CONSUMPTION per week at the university if the price
4. Beverage Preference: Rank the beverages in
preference order (assuming they all have the same
price).
1= first preference, 2=second preference, 3=third
preference, 4=fourth preference, 5= last preference.
5. Impact of price: Would you change your choice
of beverage from your first to your second
preference if (Yes=1, N=0)
11
Intake Details of Beverages of USC University Students in BAC21 course
Table 2: Chi-Square Table
Observed Your second preference was 25% cheaper than your most preferred beverage? Your second preference was 40% cheaper than your most preferred beverage? Total
No 84 50 134
Yes 16 50 66
Grand Total 100 100 200
Expected Your second preference was 25% cheaper than your most preferred beverage? Your second preference was 40% cheaper than your most preferred beverage? Total
No 67 67 134
Yes 33 33 66
Grand Total 100 100 200
CHI-SQUARE Your second preference was 25% cheaper than your most preferred beverage? Your second preference was 40% cheaper than your most preferred beverage? Total
No 4.313 4.313 8.627
Yes 8.758 8.758 17.515
Grand Total 13.071 13.071 26.142
DESCRIPTION STATS
chi-square 3.841459149
p-value 0.14650004
12
⊘ This is a preview!⊘
Do you want full access?
Subscribe today to unlock all pages.
Trusted by 1+ million students worldwide
1 out of 12
Related Documents


Your All-in-One AI-Powered Toolkit for Academic Success.
+13062052269
info@desklib.com
Available 24*7 on WhatsApp / Email
![[object Object]](/_next/static/media/star-bottom.7253800d.svg)
Unlock your academic potential
Copyright © 2020–2026 A2Z Services. All Rights Reserved. Developed and managed by ZUCOL.