Analysis of Financial Management Decisions at Woolworths (FIN5FMA)
VerifiedAdded on 2022/09/30
|11
|2191
|23
Report
AI Summary
This report presents a comprehensive financial analysis of the Woolworths Company, an Australian retail market leader, spanning from 2014 to 2018. The analysis delves into various financial ratios, including market capitalization, price-to-earnings ratio, return on equity, liquidity aspects, and debt-to-asset ratios, to assess the company's financial performance. It then proceeds to determine the Weighted Average Cost of Capital (WACC), utilizing both the Capital Asset Pricing Model (CAPM) and the Dividend Discount Model (DDM) to calculate the cost of equity. The report further examines the company's dividend policies, identifying a stable dividend policy with a payout ratio around 70%. Finally, it explores the capital structure policies, highlighting the adoption of the Static Trade-Off Theory to optimize the capital structure by balancing tax benefits and financial distress costs, concluding that the company has consistently reduced its debt to mitigate financial risk.
Running head: FINANCIAL MANAGEMENT
Financial Management
Name of the Student:
Name of the University:
Author’s Note:
Financial Management
Name of the Student:
Name of the University:
Author’s Note:
Paraphrase This Document
Need a fresh take? Get an instant paraphrase of this document with our AI Paraphraser
1FINANCIAL MANAGEMENT
Table of Contents
Introduction......................................................................................................................................2
Discussion........................................................................................................................................2
Financial Analysis.......................................................................................................................2
Weighted Average Cost of Capital..............................................................................................4
Dividend Policies.........................................................................................................................6
Capital Structure Policies............................................................................................................7
Conclusion.......................................................................................................................................7
References........................................................................................................................................9
2FINANCIAL MANAGEMENT
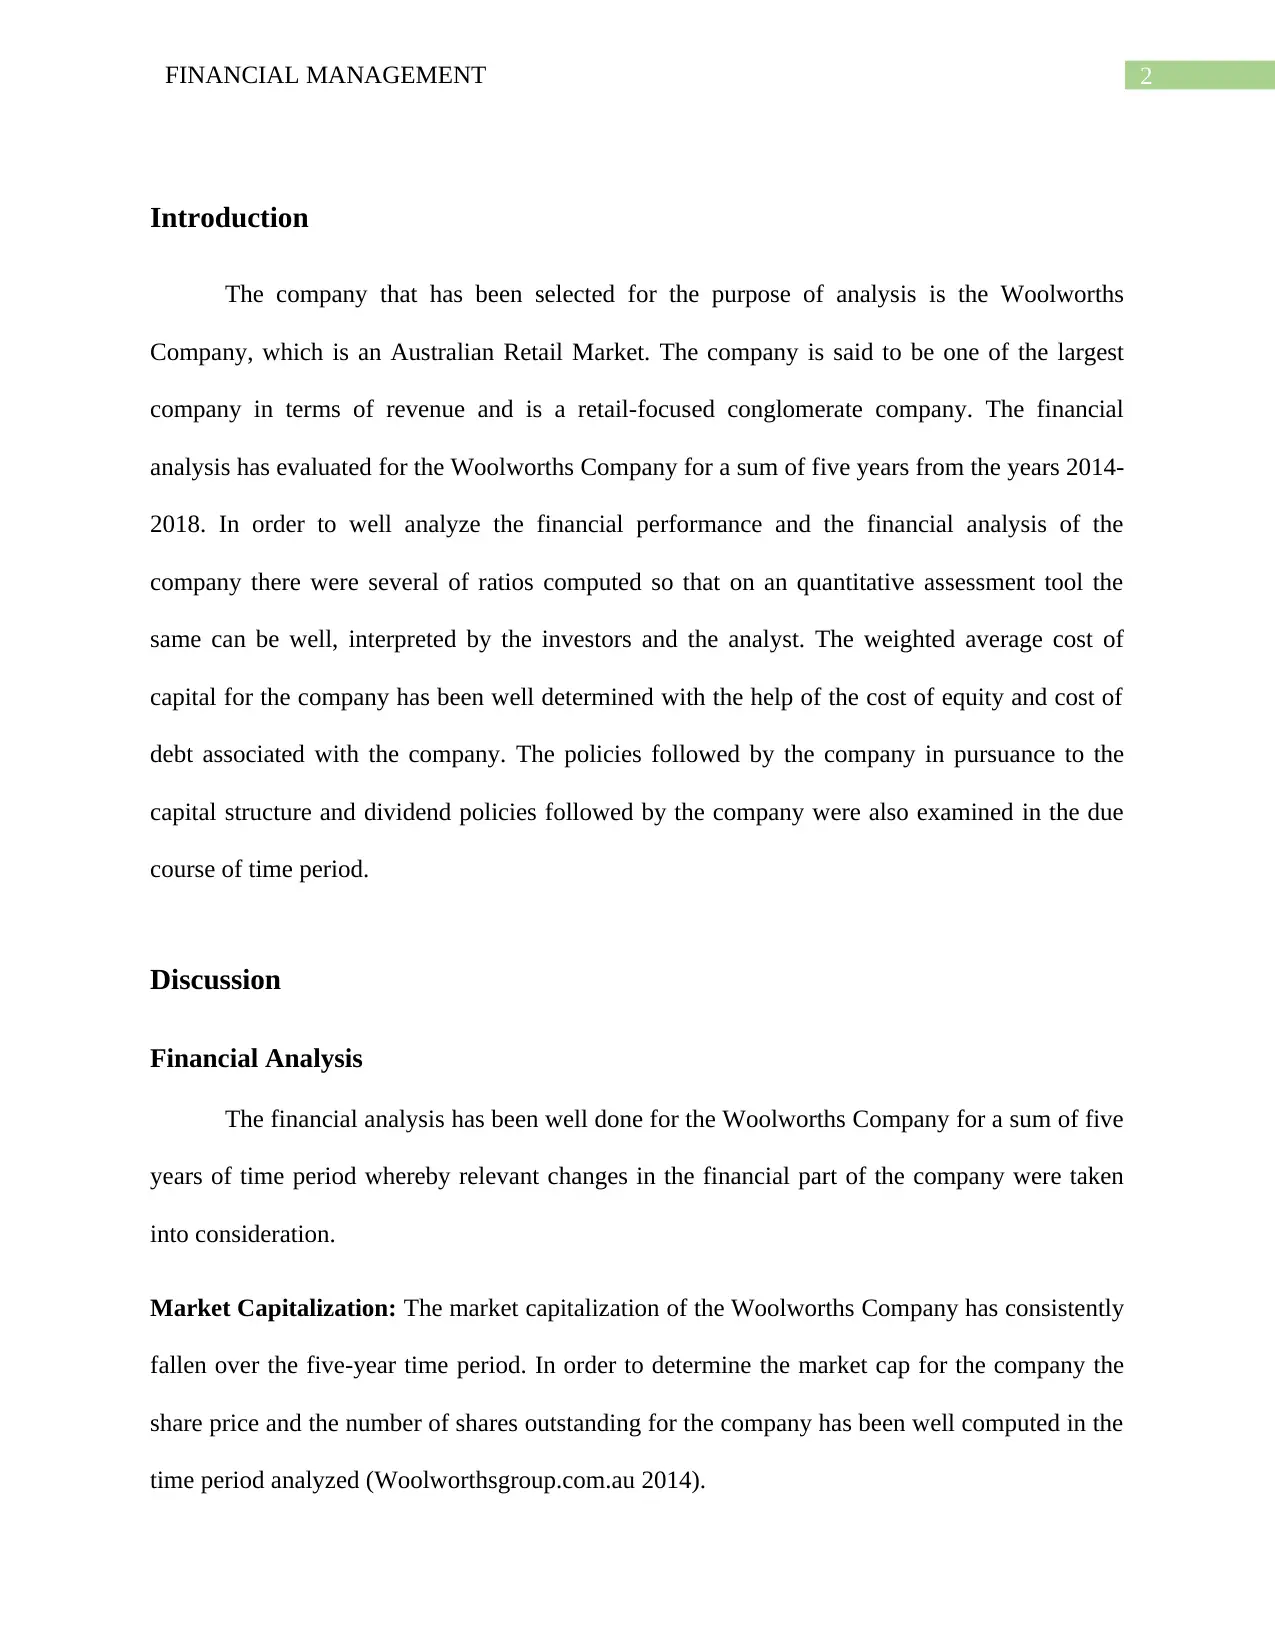
Introduction
The company that has been selected for the purpose of analysis is the Woolworths
Company, which is an Australian Retail Market. The company is said to be one of the largest
company in terms of revenue and is a retail-focused conglomerate company. The financial
analysis has evaluated for the Woolworths Company for a sum of five years from the years 2014-
2018. In order to well analyze the financial performance and the financial analysis of the
company there were several of ratios computed so that on an quantitative assessment tool the
same can be well, interpreted by the investors and the analyst. The weighted average cost of
capital for the company has been well determined with the help of the cost of equity and cost of
debt associated with the company. The policies followed by the company in pursuance to the
capital structure and dividend policies followed by the company were also examined in the due
course of time period.
Discussion
Financial Analysis
The financial analysis has been well done for the Woolworths Company for a sum of five
years of time period whereby relevant changes in the financial part of the company were taken
into consideration.
Market Capitalization: The market capitalization of the Woolworths Company has consistently
fallen over the five-year time period. In order to determine the market cap for the company the
share price and the number of shares outstanding for the company has been well computed in the
time period analyzed (Woolworthsgroup.com.au 2014).
⊘ This is a preview!⊘
Do you want full access?
Subscribe today to unlock all pages.
Trusted by 1+ million students worldwide
3FINANCIAL MANAGEMENT
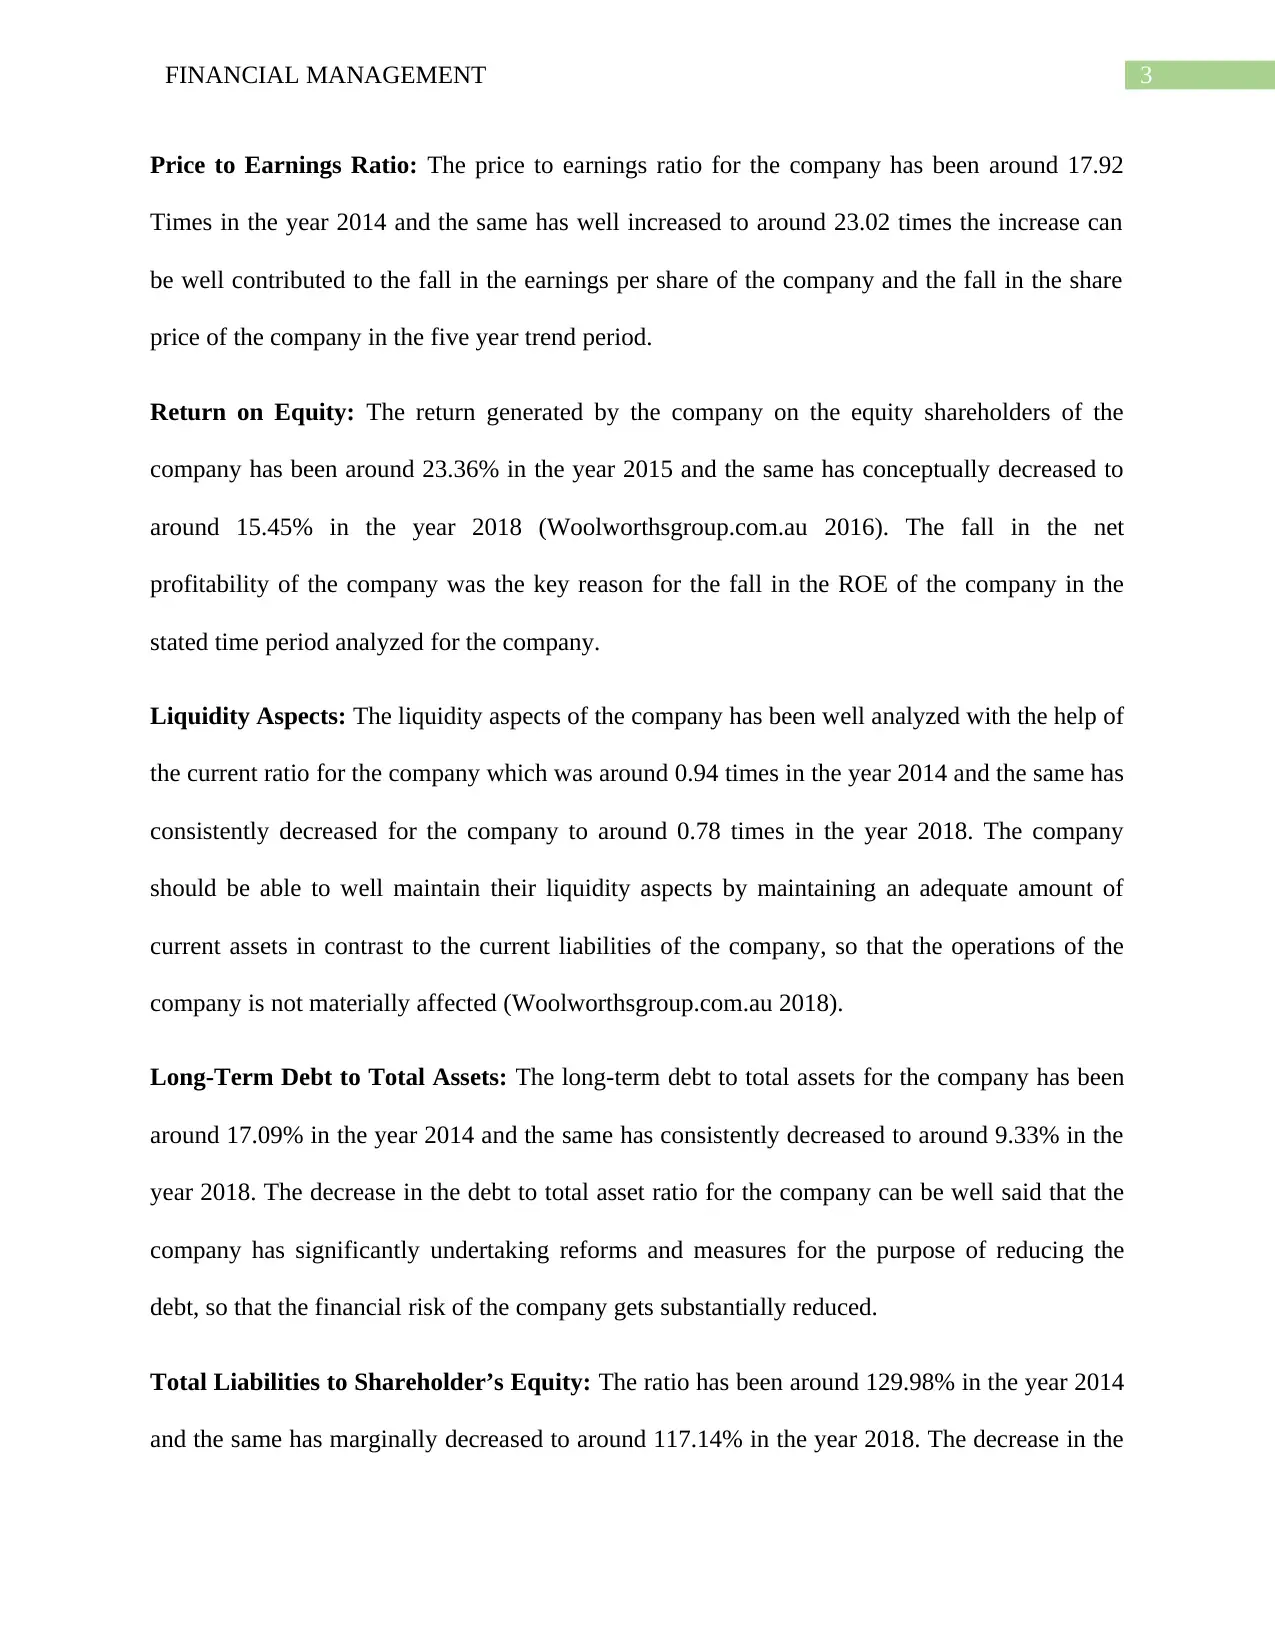
Price to Earnings Ratio: The price to earnings ratio for the company has been around 17.92
Times in the year 2014 and the same has well increased to around 23.02 times the increase can
be well contributed to the fall in the earnings per share of the company and the fall in the share
price of the company in the five year trend period.
Return on Equity: The return generated by the company on the equity shareholders of the
company has been around 23.36% in the year 2015 and the same has conceptually decreased to
around 15.45% in the year 2018 (Woolworthsgroup.com.au 2016). The fall in the net
profitability of the company was the key reason for the fall in the ROE of the company in the
stated time period analyzed for the company.
Liquidity Aspects: The liquidity aspects of the company has been well analyzed with the help of
the current ratio for the company which was around 0.94 times in the year 2014 and the same has
consistently decreased for the company to around 0.78 times in the year 2018. The company
should be able to well maintain their liquidity aspects by maintaining an adequate amount of
current assets in contrast to the current liabilities of the company, so that the operations of the
company is not materially affected (Woolworthsgroup.com.au 2018).
Long-Term Debt to Total Assets: The long-term debt to total assets for the company has been
around 17.09% in the year 2014 and the same has consistently decreased to around 9.33% in the
year 2018. The decrease in the debt to total asset ratio for the company can be well said that the
company has significantly undertaking reforms and measures for the purpose of reducing the
debt, so that the financial risk of the company gets substantially reduced.
Total Liabilities to Shareholder’s Equity: The ratio has been around 129.98% in the year 2014
and the same has marginally decreased to around 117.14% in the year 2018. The decrease in the
Paraphrase This Document
Need a fresh take? Get an instant paraphrase of this document with our AI Paraphraser
4FINANCIAL MANAGEMENT
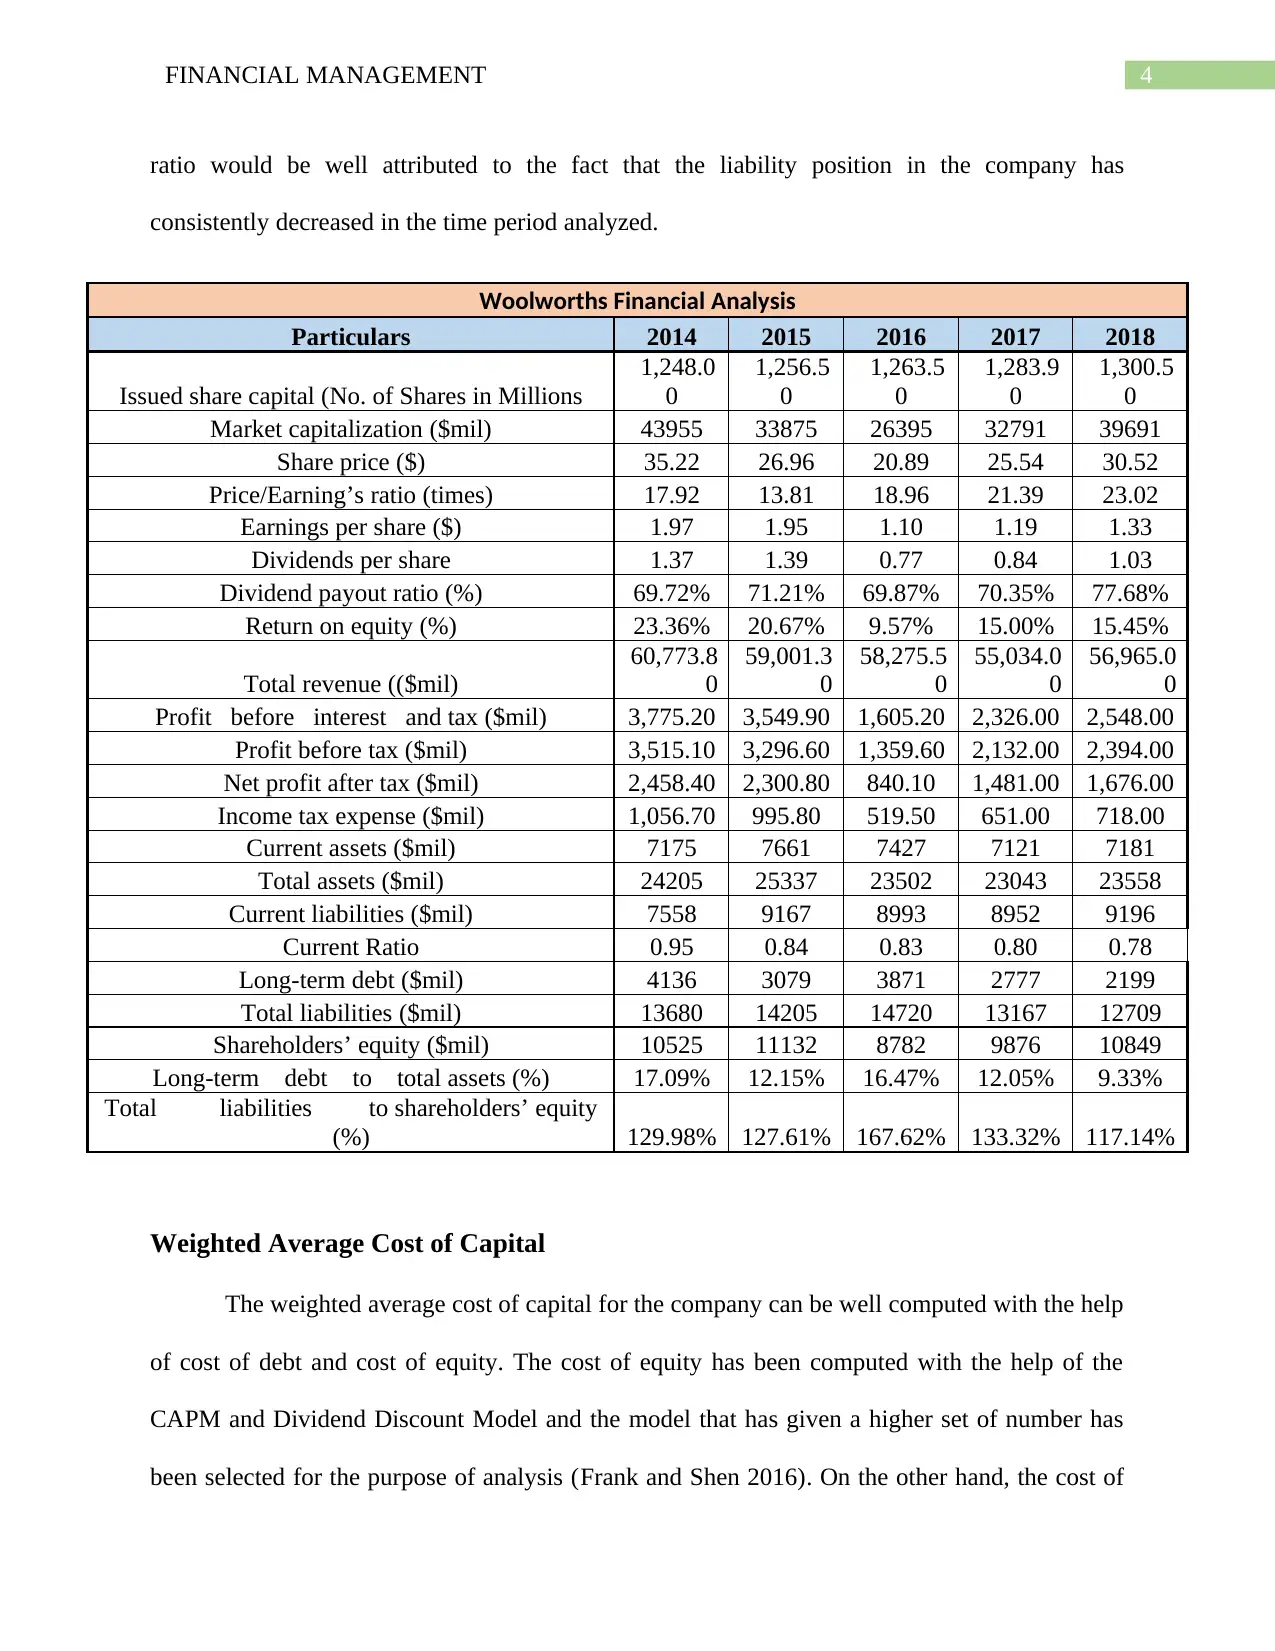
ratio would be well attributed to the fact that the liability position in the company has
consistently decreased in the time period analyzed.
Woolworths Financial Analysis
Particulars 2014 2015 2016 2017 2018
Issued share capital (No. of Shares in Millions
1,248.0
0
1,256.5
0
1,263.5
0
1,283.9
0
1,300.5
0
Market capitalization ($mil) 43955 33875 26395 32791 39691
Share price ($) 35.22 26.96 20.89 25.54 30.52
Price/Earning’s ratio (times) 17.92 13.81 18.96 21.39 23.02
Earnings per share ($) 1.97 1.95 1.10 1.19 1.33
Dividends per share 1.37 1.39 0.77 0.84 1.03
Dividend payout ratio (%) 69.72% 71.21% 69.87% 70.35% 77.68%
Return on equity (%) 23.36% 20.67% 9.57% 15.00% 15.45%
Total revenue (($mil)
60,773.8
0
59,001.3
0
58,275.5
0
55,034.0
0
56,965.0
0
Profit before interest and tax ($mil) 3,775.20 3,549.90 1,605.20 2,326.00 2,548.00
Profit before tax ($mil) 3,515.10 3,296.60 1,359.60 2,132.00 2,394.00
Net profit after tax ($mil) 2,458.40 2,300.80 840.10 1,481.00 1,676.00
Income tax expense ($mil) 1,056.70 995.80 519.50 651.00 718.00
Current assets ($mil) 7175 7661 7427 7121 7181
Total assets ($mil) 24205 25337 23502 23043 23558
Current liabilities ($mil) 7558 9167 8993 8952 9196
Current Ratio 0.95 0.84 0.83 0.80 0.78
Long-term debt ($mil) 4136 3079 3871 2777 2199
Total liabilities ($mil) 13680 14205 14720 13167 12709
Shareholders’ equity ($mil) 10525 11132 8782 9876 10849
Long-term debt to total assets (%) 17.09% 12.15% 16.47% 12.05% 9.33%
Total liabilities to shareholders’ equity
(%) 129.98% 127.61% 167.62% 133.32% 117.14%
Weighted Average Cost of Capital
The weighted average cost of capital for the company can be well computed with the help
of cost of debt and cost of equity. The cost of equity has been computed with the help of the
CAPM and Dividend Discount Model and the model that has given a higher set of number has
been selected for the purpose of analysis (Frank and Shen 2016). On the other hand, the cost of
5FINANCIAL MANAGEMENT
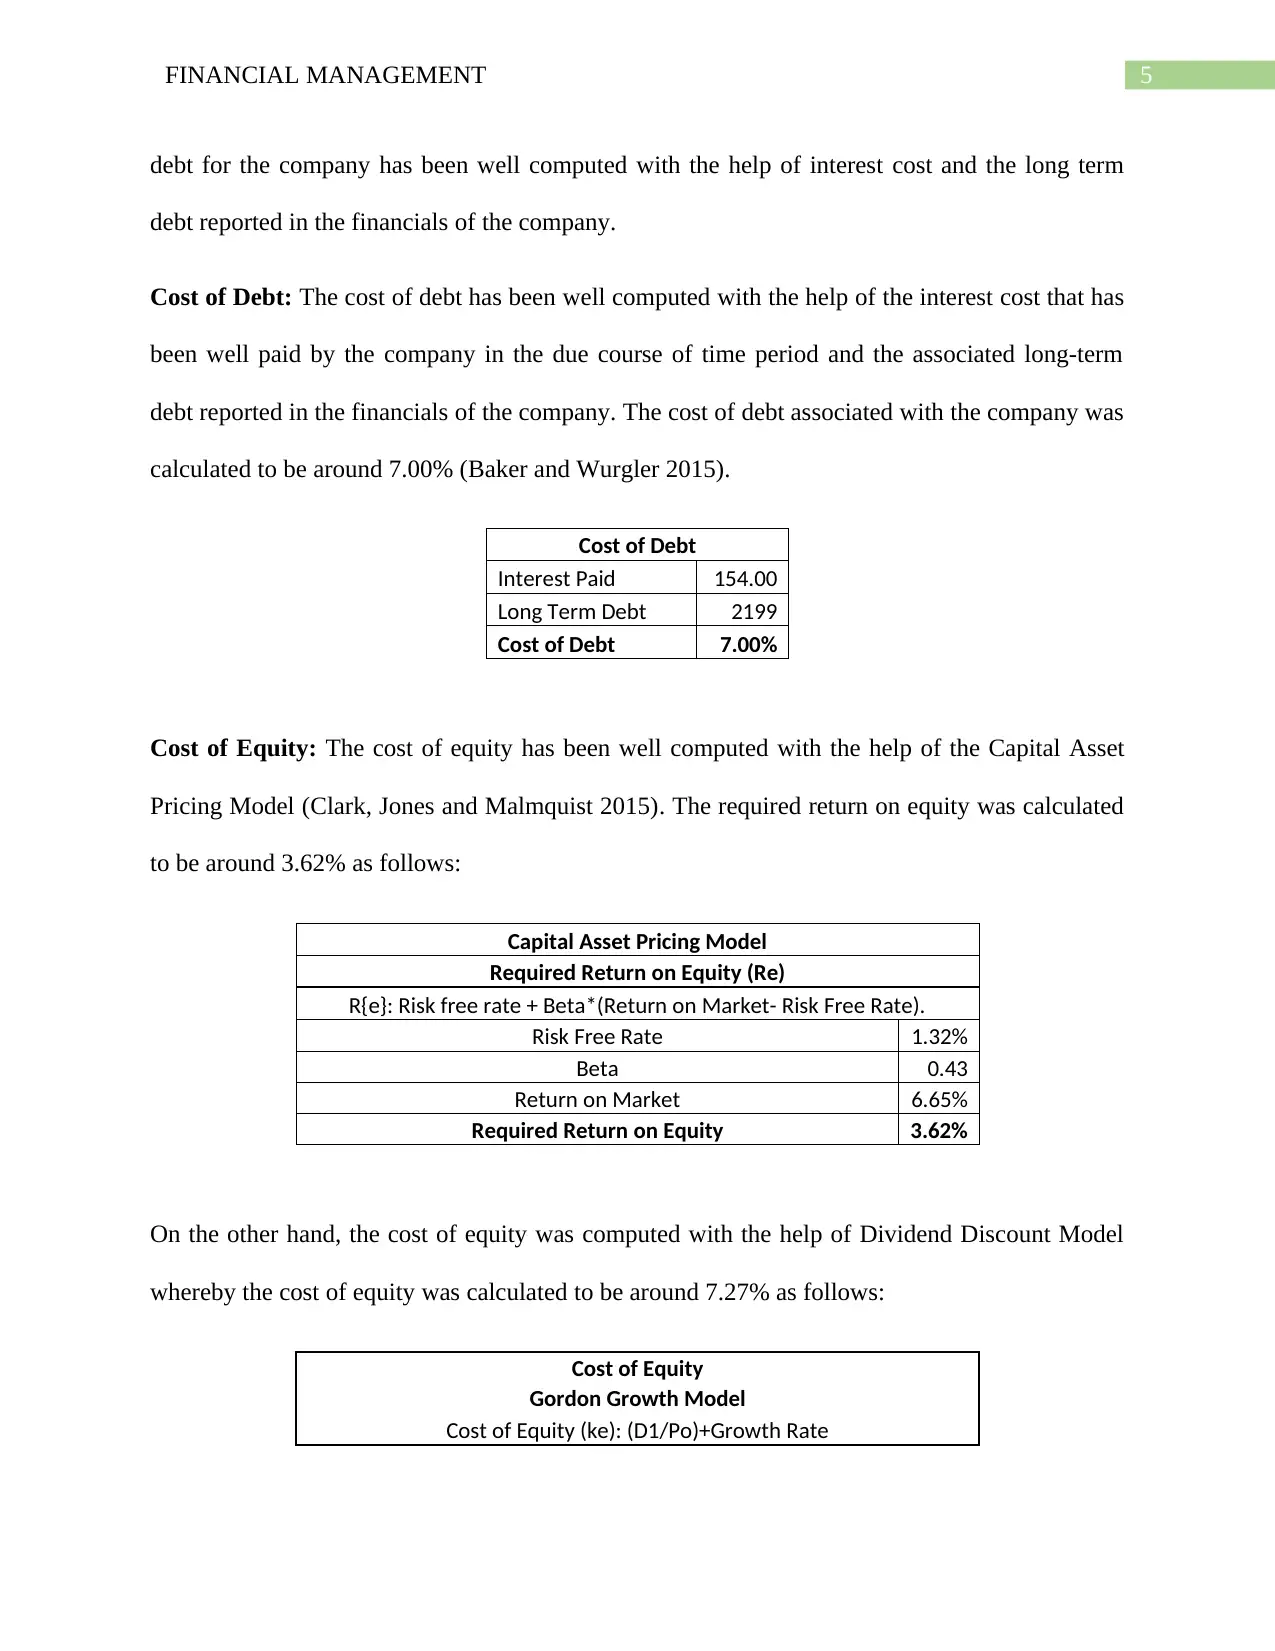
debt for the company has been well computed with the help of interest cost and the long term
debt reported in the financials of the company.
Cost of Debt: The cost of debt has been well computed with the help of the interest cost that has
been well paid by the company in the due course of time period and the associated long-term
debt reported in the financials of the company. The cost of debt associated with the company was
calculated to be around 7.00% (Baker and Wurgler 2015).
Cost of Debt
Interest Paid 154.00
Long Term Debt 2199
Cost of Debt 7.00%
Cost of Equity: The cost of equity has been well computed with the help of the Capital Asset
Pricing Model (Clark, Jones and Malmquist 2015). The required return on equity was calculated
to be around 3.62% as follows:
Capital Asset Pricing Model
Required Return on Equity (Re)
R{e}: Risk free rate + Beta*(Return on Market- Risk Free Rate).
Risk Free Rate 1.32%
Beta 0.43
Return on Market 6.65%
Required Return on Equity 3.62%
On the other hand, the cost of equity was computed with the help of Dividend Discount Model
whereby the cost of equity was calculated to be around 7.27% as follows:
Cost of Equity
Gordon Growth Model
Cost of Equity (ke): (D1/Po)+Growth Rate
⊘ This is a preview!⊘
Do you want full access?
Subscribe today to unlock all pages.
Trusted by 1+ million students worldwide
6FINANCIAL MANAGEMENT
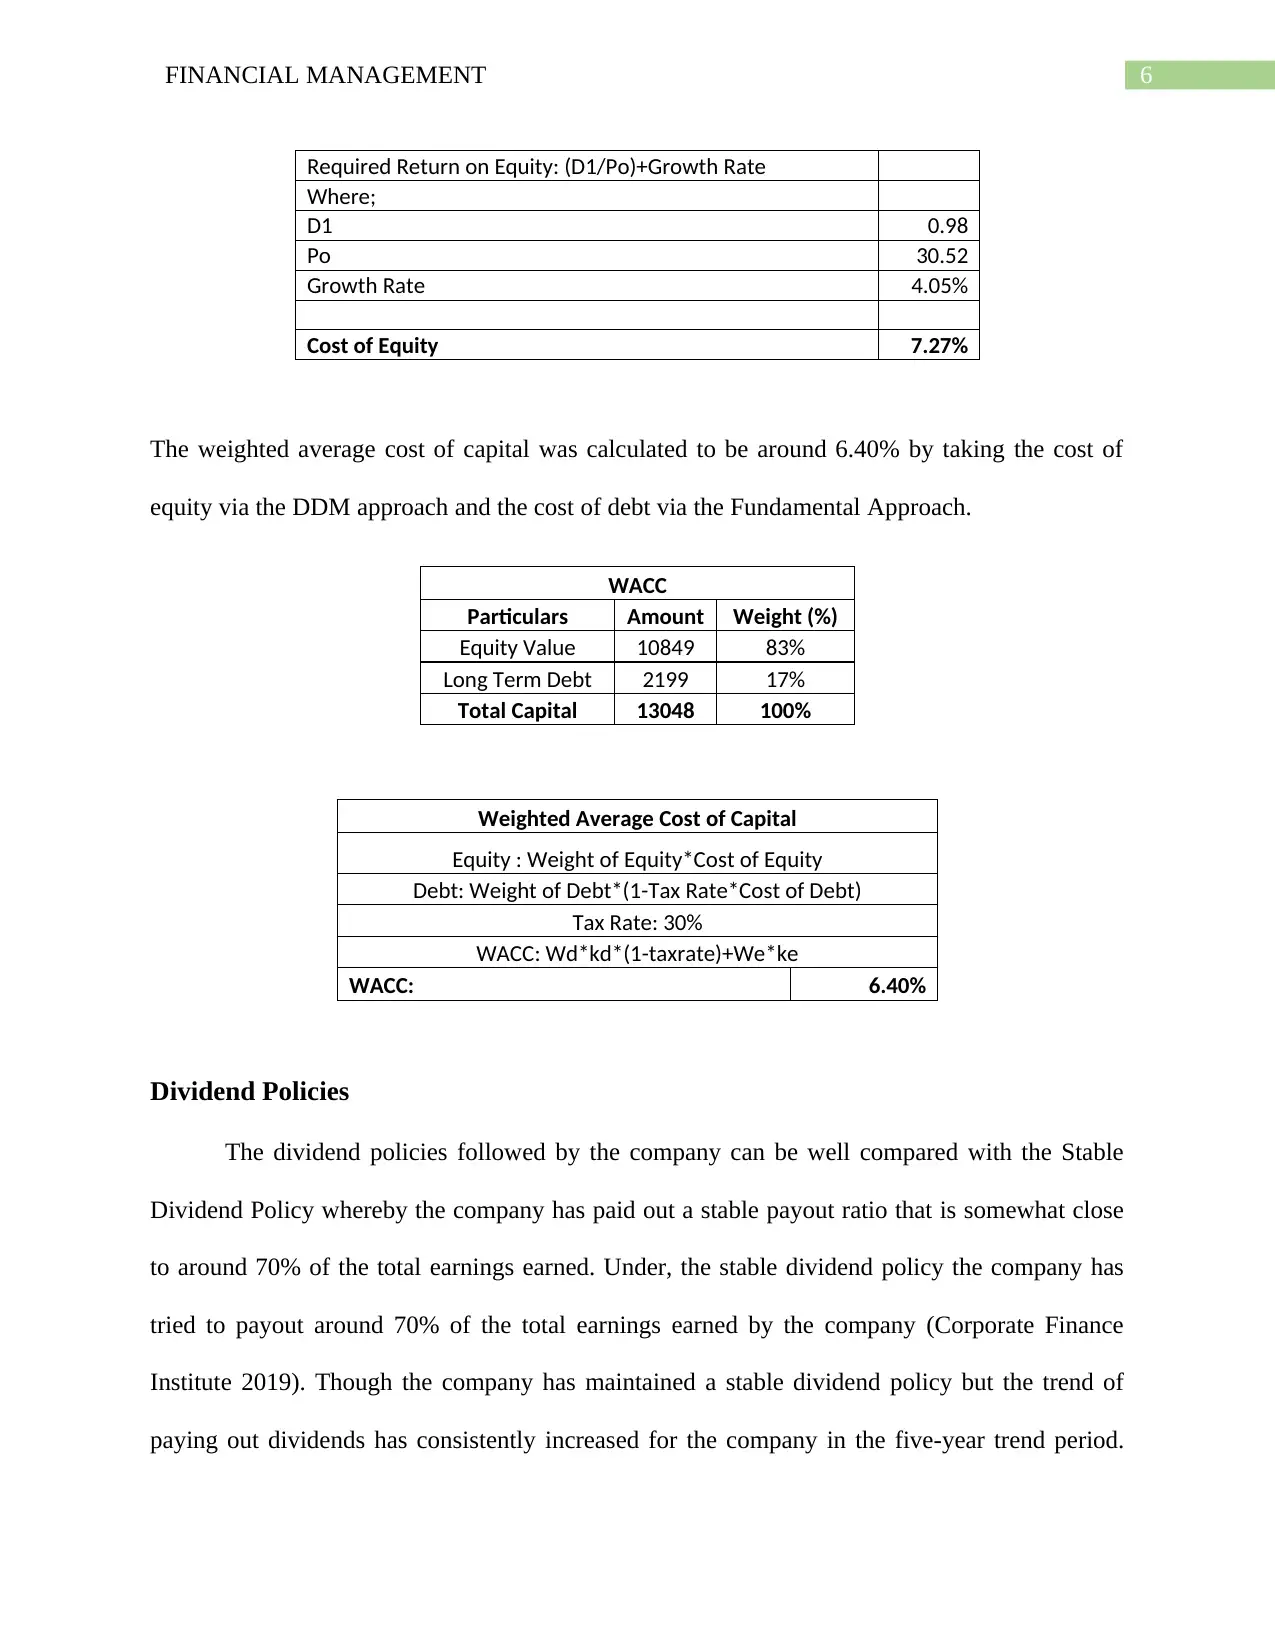
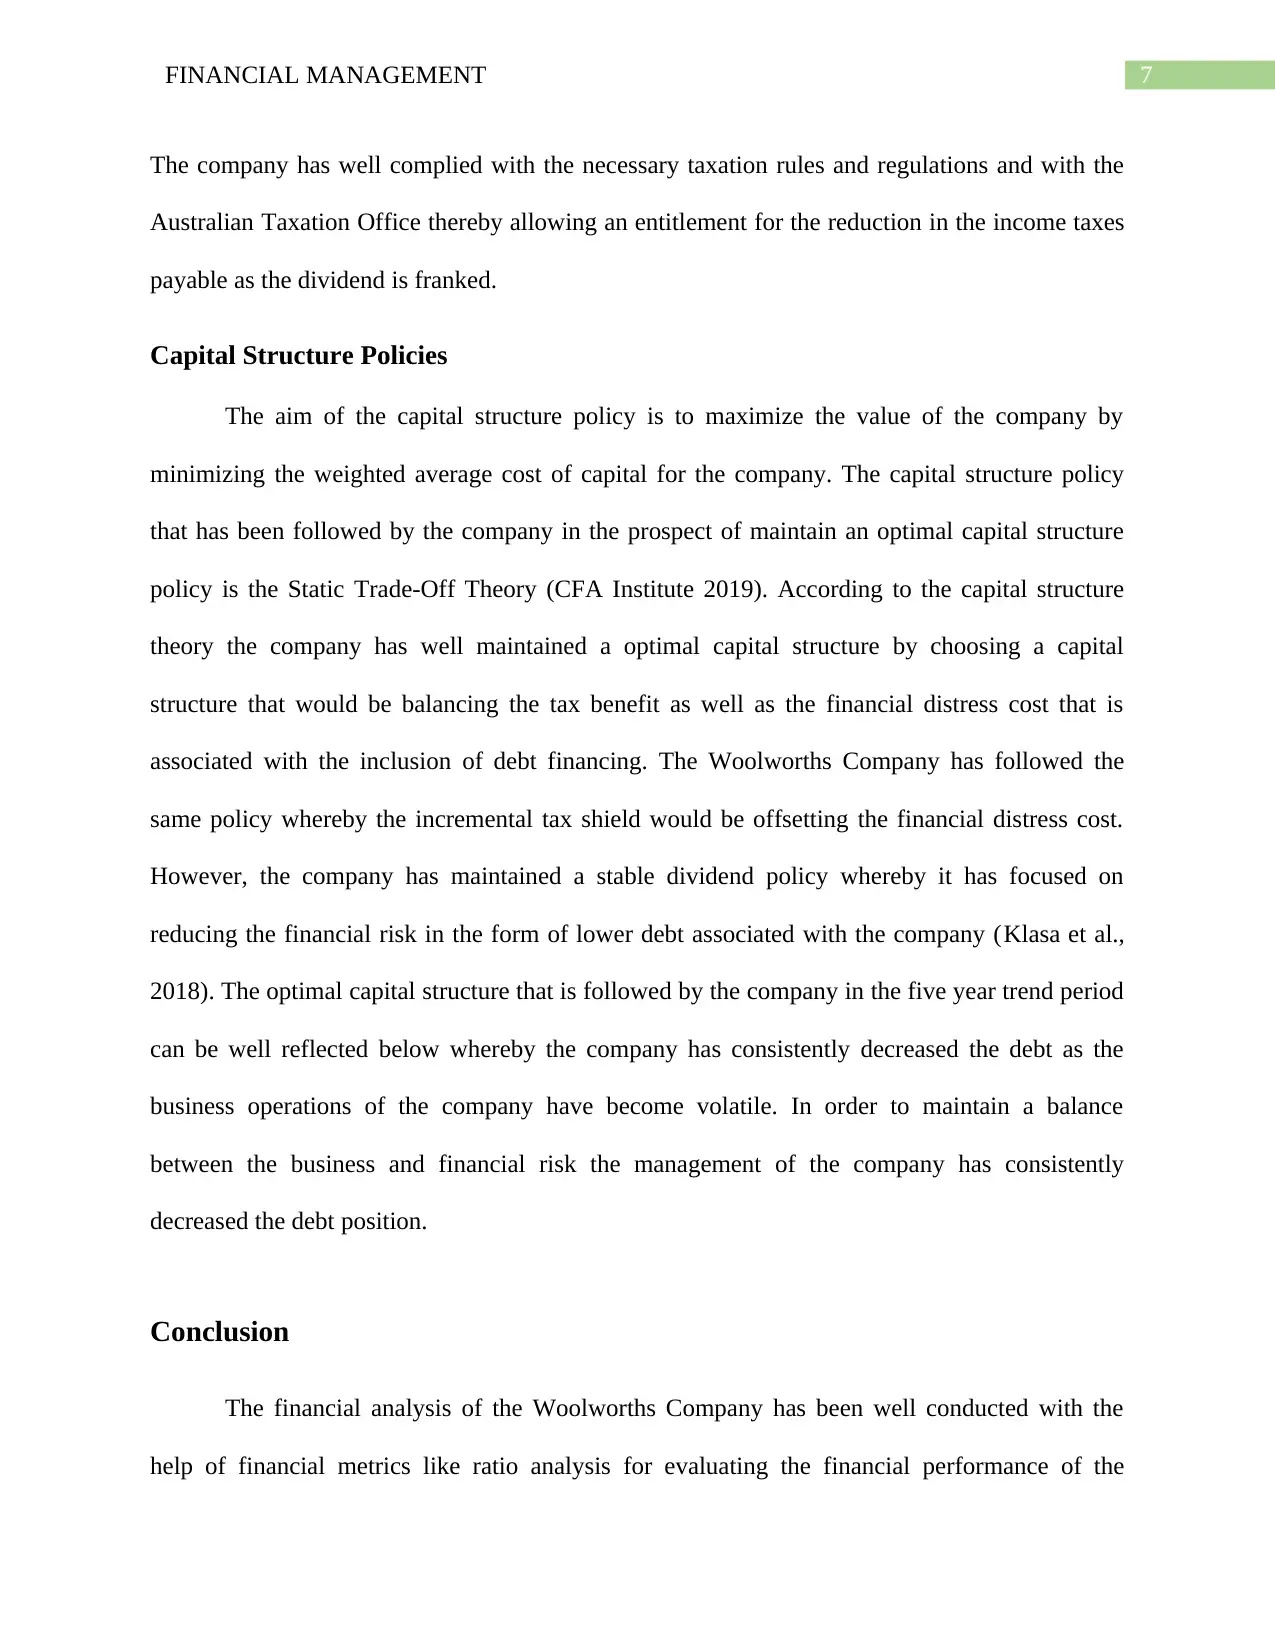
Required Return on Equity: (D1/Po)+Growth Rate
Where;
D1 0.98
Po 30.52
Growth Rate 4.05%
Cost of Equity 7.27%
The weighted average cost of capital was calculated to be around 6.40% by taking the cost of
equity via the DDM approach and the cost of debt via the Fundamental Approach.
WACC
Particulars Amount Weight (%)
Equity Value 10849 83%
Long Term Debt 2199 17%
Total Capital 13048 100%
Weighted Average Cost of Capital
Equity : Weight of Equity*Cost of Equity
Debt: Weight of Debt*(1-Tax Rate*Cost of Debt)
Tax Rate: 30%
WACC: Wd*kd*(1-taxrate)+We*ke
WACC: 6.40%
Dividend Policies
The dividend policies followed by the company can be well compared with the Stable
Dividend Policy whereby the company has paid out a stable payout ratio that is somewhat close
to around 70% of the total earnings earned. Under, the stable dividend policy the company has
tried to payout around 70% of the total earnings earned by the company (Corporate Finance
Institute 2019). Though the company has maintained a stable dividend policy but the trend of
paying out dividends has consistently increased for the company in the five-year trend period.
Paraphrase This Document
Need a fresh take? Get an instant paraphrase of this document with our AI Paraphraser
7FINANCIAL MANAGEMENT
The company has well complied with the necessary taxation rules and regulations and with the
Australian Taxation Office thereby allowing an entitlement for the reduction in the income taxes
payable as the dividend is franked.
Capital Structure Policies
The aim of the capital structure policy is to maximize the value of the company by
minimizing the weighted average cost of capital for the company. The capital structure policy
that has been followed by the company in the prospect of maintain an optimal capital structure
policy is the Static Trade-Off Theory (CFA Institute 2019). According to the capital structure
theory the company has well maintained a optimal capital structure by choosing a capital
structure that would be balancing the tax benefit as well as the financial distress cost that is
associated with the inclusion of debt financing. The Woolworths Company has followed the
same policy whereby the incremental tax shield would be offsetting the financial distress cost.
However, the company has maintained a stable dividend policy whereby it has focused on
reducing the financial risk in the form of lower debt associated with the company (Klasa et al.,
2018). The optimal capital structure that is followed by the company in the five year trend period
can be well reflected below whereby the company has consistently decreased the debt as the
business operations of the company have become volatile. In order to maintain a balance
between the business and financial risk the management of the company has consistently
decreased the debt position.
Conclusion
The financial analysis of the Woolworths Company has been well conducted with the
help of financial metrics like ratio analysis for evaluating the financial performance of the
8FINANCIAL MANAGEMENT
company. On the other hand the WACC for the company was computed in order to find out the
cost of capital associated with the company. The policies followed by the company in pursuance
to the capital structure and dividend policies followed by the company were also examined in the
due course of time period.
⊘ This is a preview!⊘
Do you want full access?
Subscribe today to unlock all pages.
Trusted by 1+ million students worldwide
9FINANCIAL MANAGEMENT
References
Baker, M. and Wurgler, J., 2015. Do strict capital requirements raise the cost of capital? Bank
regulation, capital structure, and the low-risk anomaly. American Economic Review, 105(5),
pp.315-20.
CFA Institute. 2019. Capital Structure. [online] Available at:
https://www.cfainstitute.org/en/membership/professional-development/refresher-readings/2020/
capital-structure [Accessed 9 Oct. 2019].
Clark, B., Jones, J. and Malmquist, D., 2015. Leverage and the weighted-average cost of capital
for US banks. Available at SSRN.
Corporate Finance Institute. 2019. Dividend Policy - Overview, Dividend Types, and Examples.
[online] Available at: https://corporatefinanceinstitute.com/resources/knowledge/trading-
investing/dividend-policy/ [Accessed 9 Oct. 2019].
Frank, M.Z. and Shen, T., 2016. Investment and the weighted average cost of capital. Journal of
Financial Economics, 119(2), pp.300-315.
Klasa, S., Ortiz-Molina, H., Serfling, M. and Srinivasan, S., 2018. Protection of trade secrets and
capital structure decisions. Journal of Financial Economics, 128(2), pp.266-286.
Öztekin, Ö., 2015. Capital structure decisions around the world: which factors are reliably
important?. Journal of Financial and Quantitative Analysis, 50(3), pp.301-323.
Paraphrase This Document
Need a fresh take? Get an instant paraphrase of this document with our AI Paraphraser
10FINANCIAL MANAGEMENT
Woolworthsgroup.com.au. 2014. [online] Available at:
https://www.woolworthsgroup.com.au/icms_docs/185964_annual-report-2014.pdf [Accessed 9
Oct. 2019].
Woolworthsgroup.com.au. 2016. [online] Available at:
https://www.woolworthsgroup.com.au/icms_docs/185865_annual-report-2016.pdf [Accessed 9
Oct. 2019].
Woolworthsgroup.com.au. 2018. [online] Available at:
https://www.woolworthsgroup.com.au/icms_docs/195396_annual-report-2018.pdf [Accessed 9
Oct. 2019].
1 out of 11
Related Documents


Your All-in-One AI-Powered Toolkit for Academic Success.
+13062052269
info@desklib.com
Available 24*7 on WhatsApp / Email
![[object Object]](/_next/static/media/star-bottom.7253800d.svg)
Unlock your academic potential
Copyright © 2020–2026 A2Z Services. All Rights Reserved. Developed and managed by ZUCOL.