Deakin University MAF759 Analytical Methods Major Assignment

Verified

Added on  2023/03/17

|9
|560
|21
Homework Assignment
AI Summary
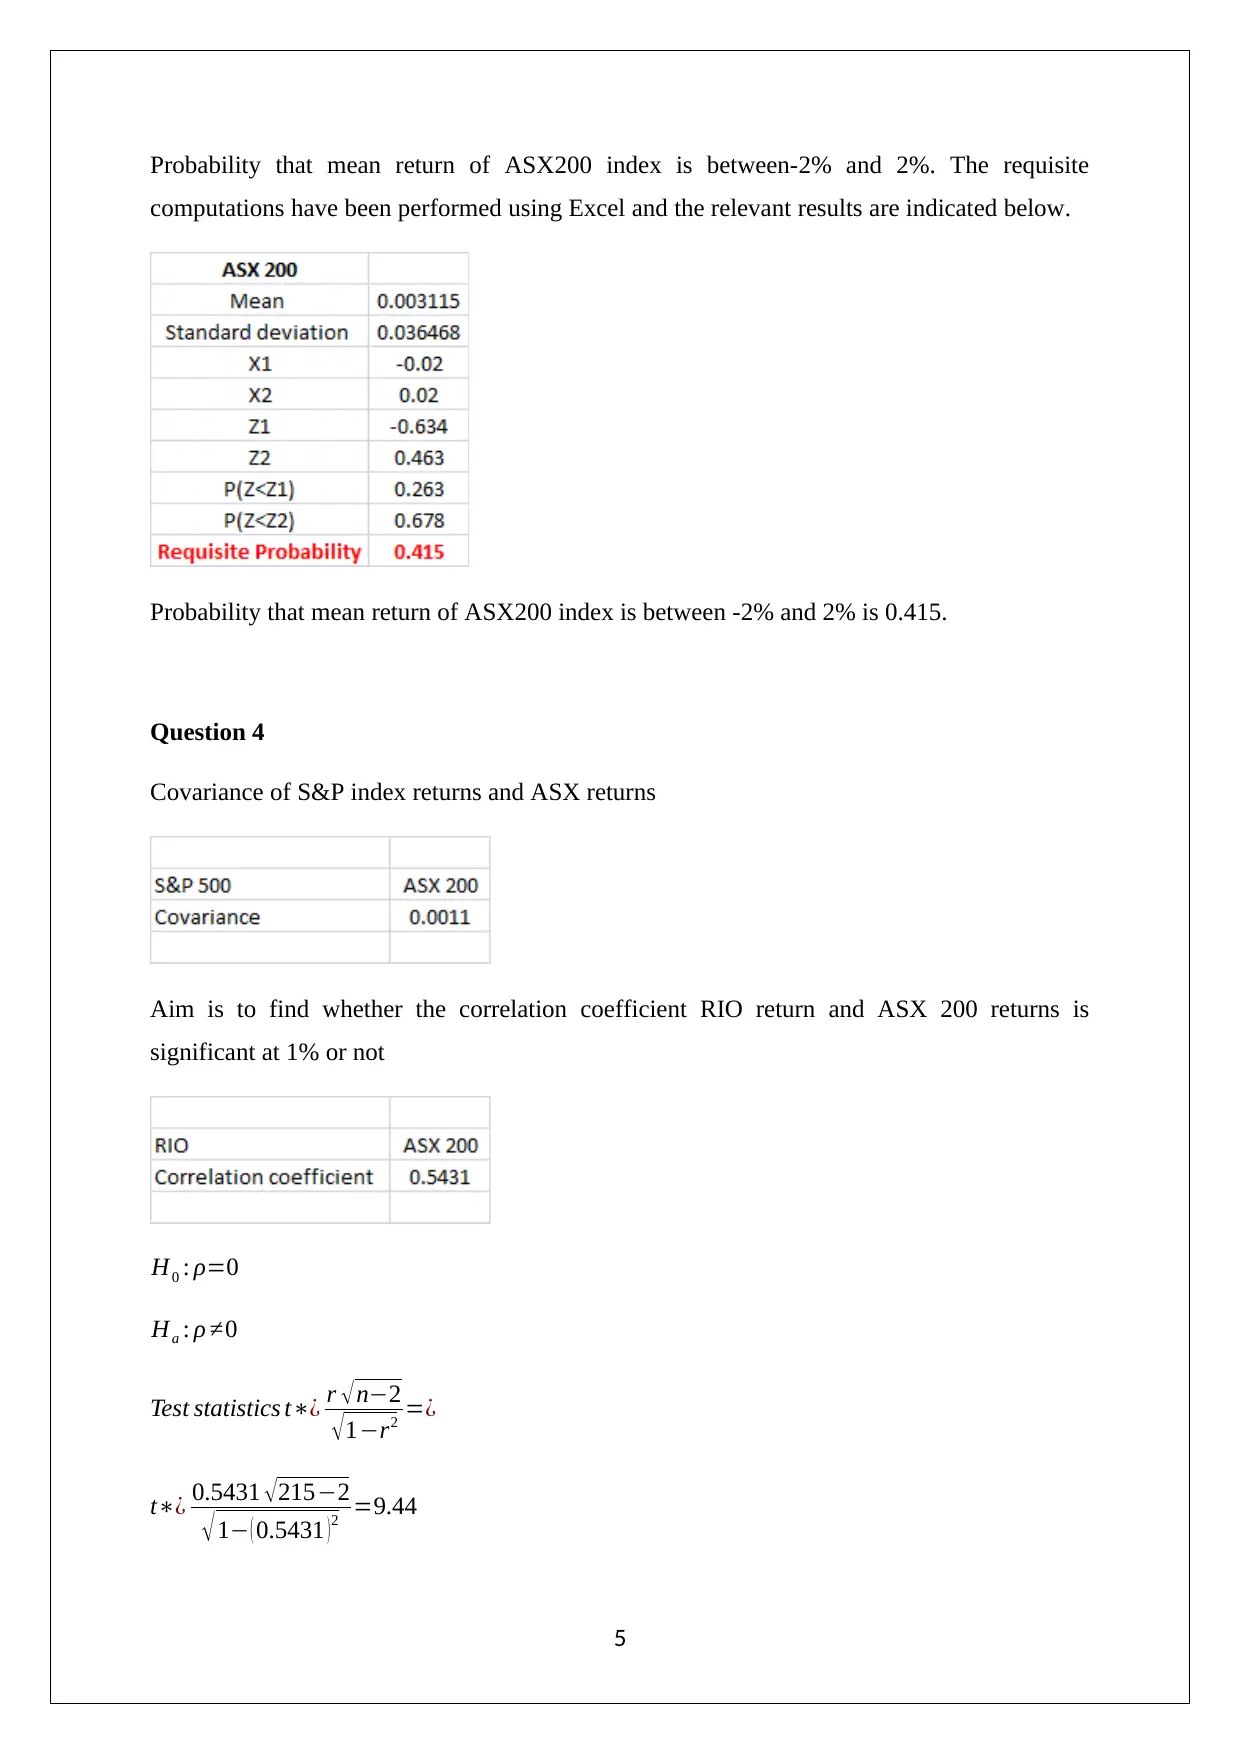
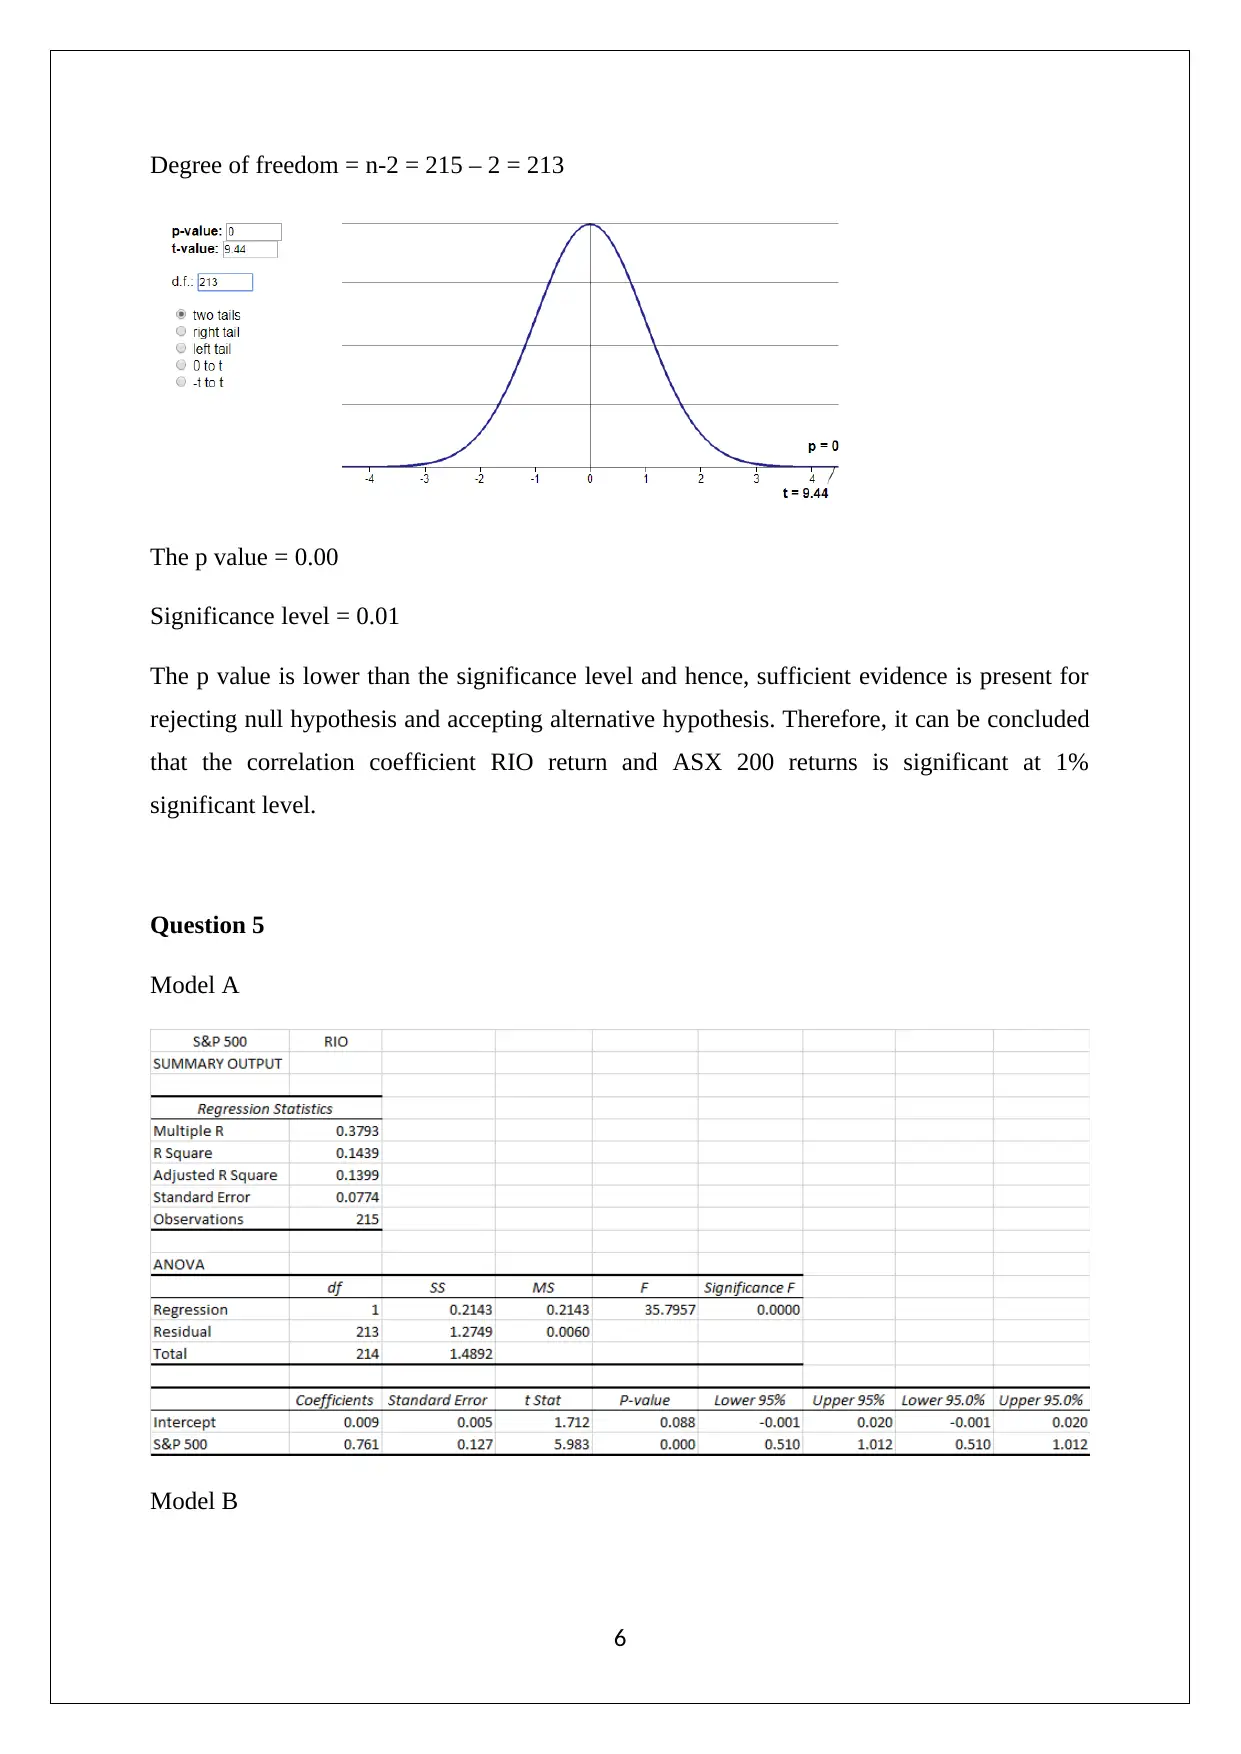
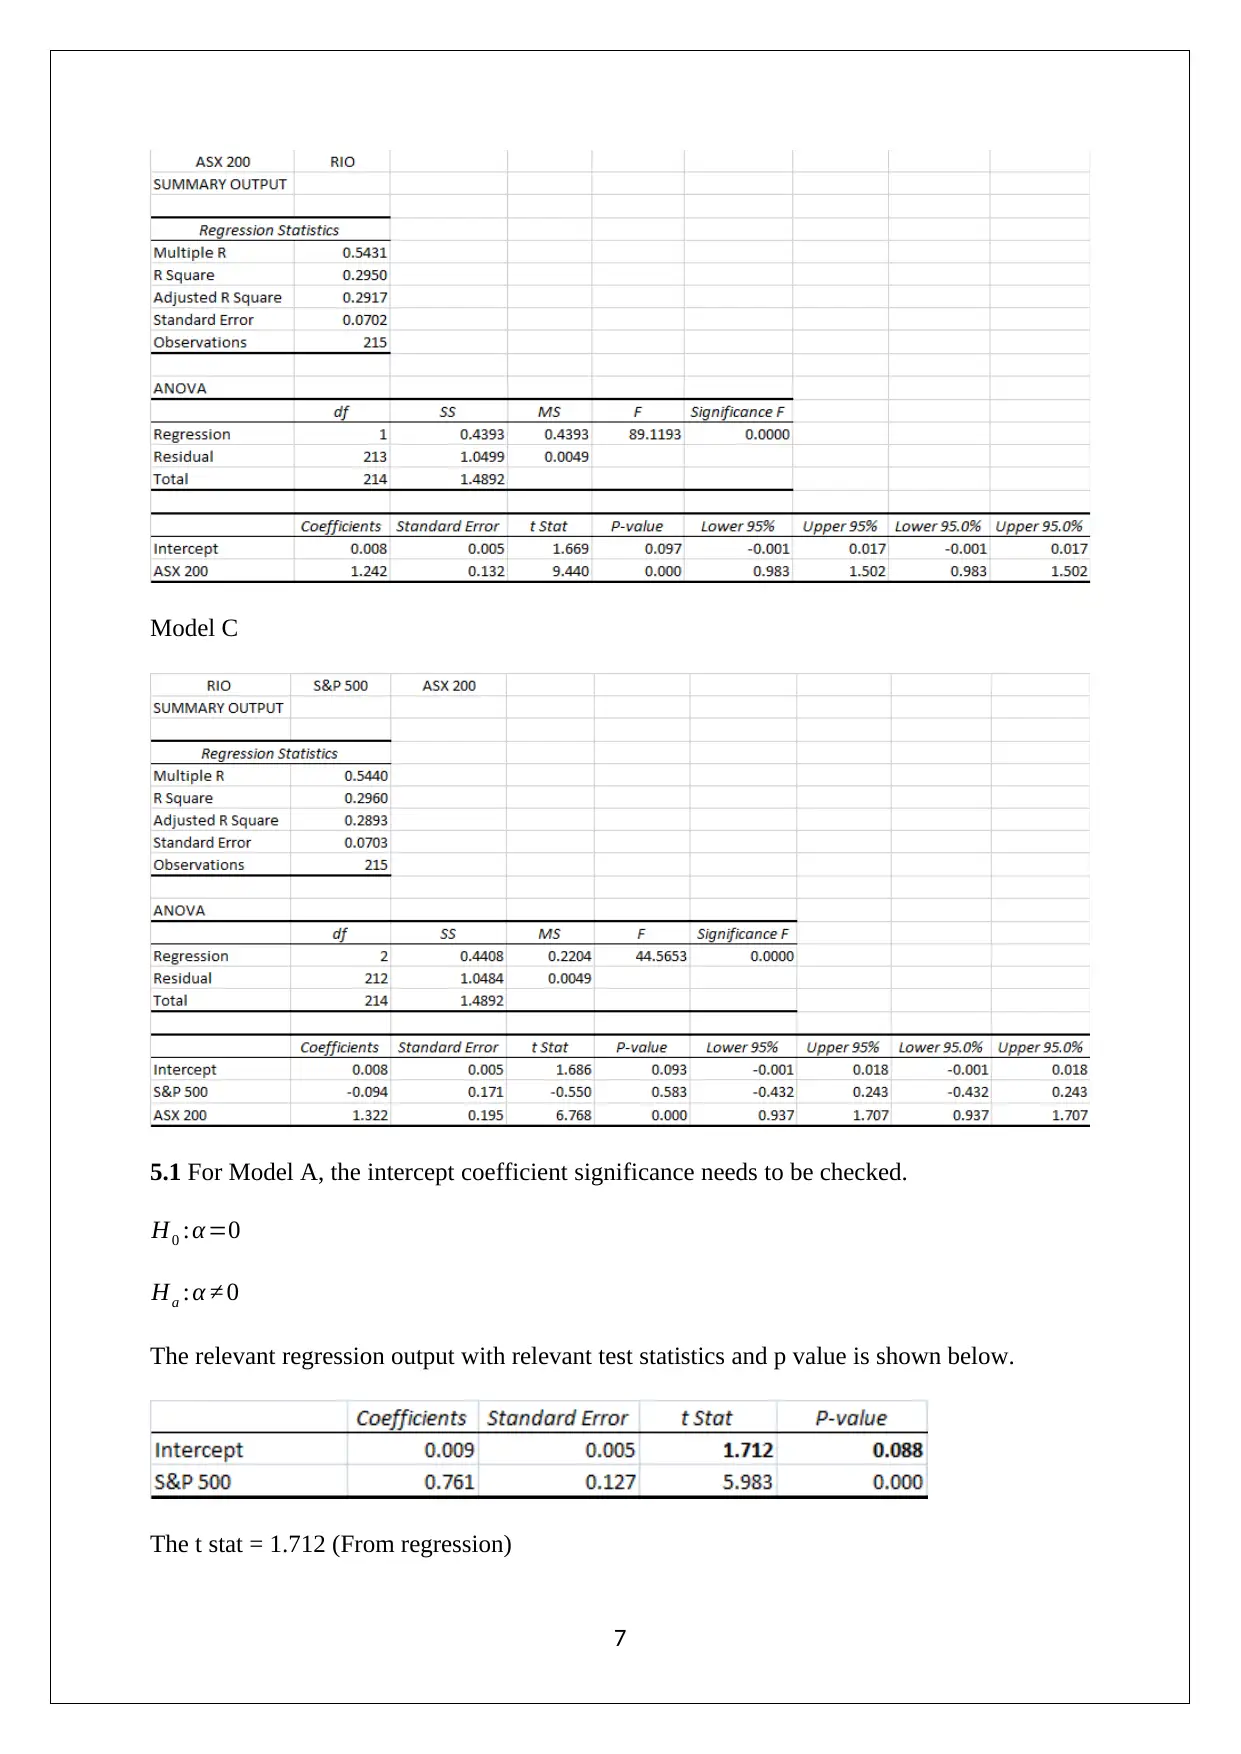
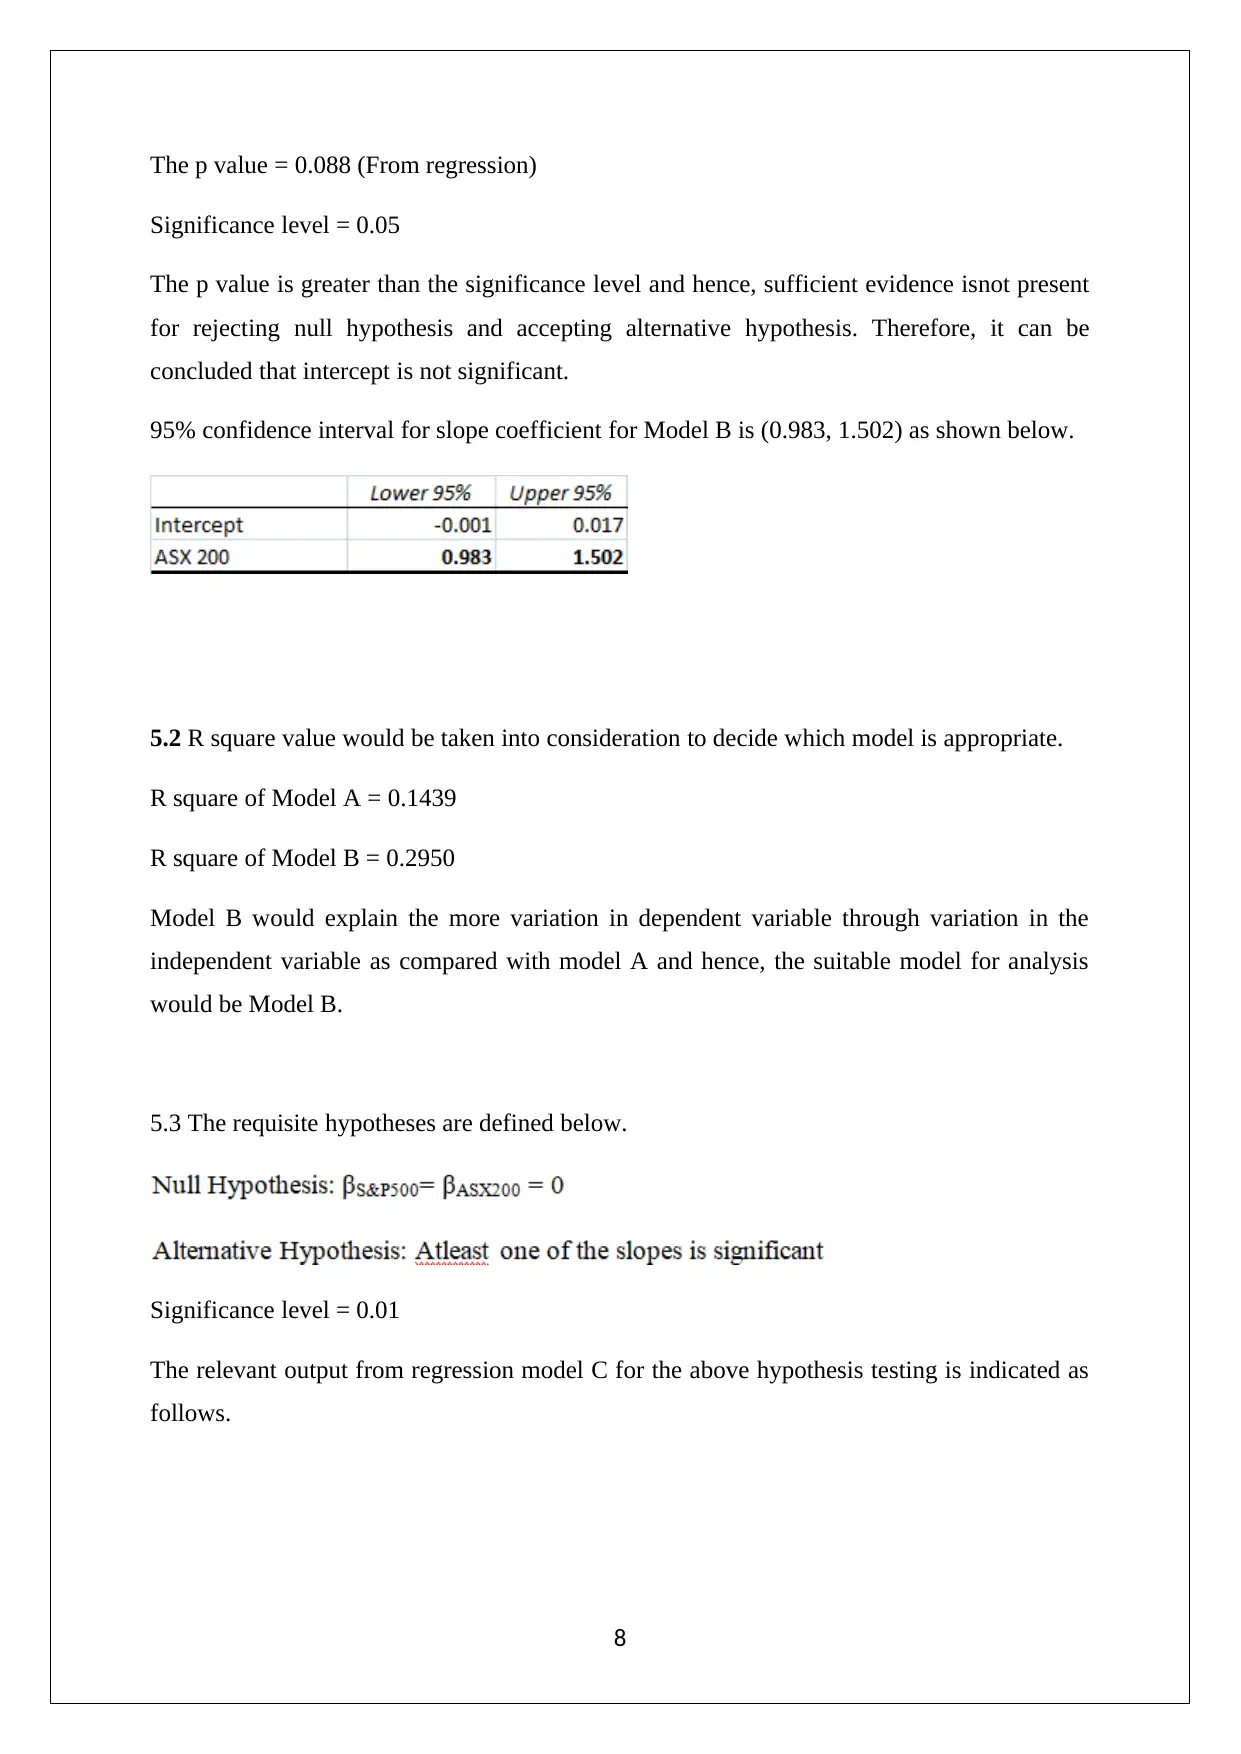
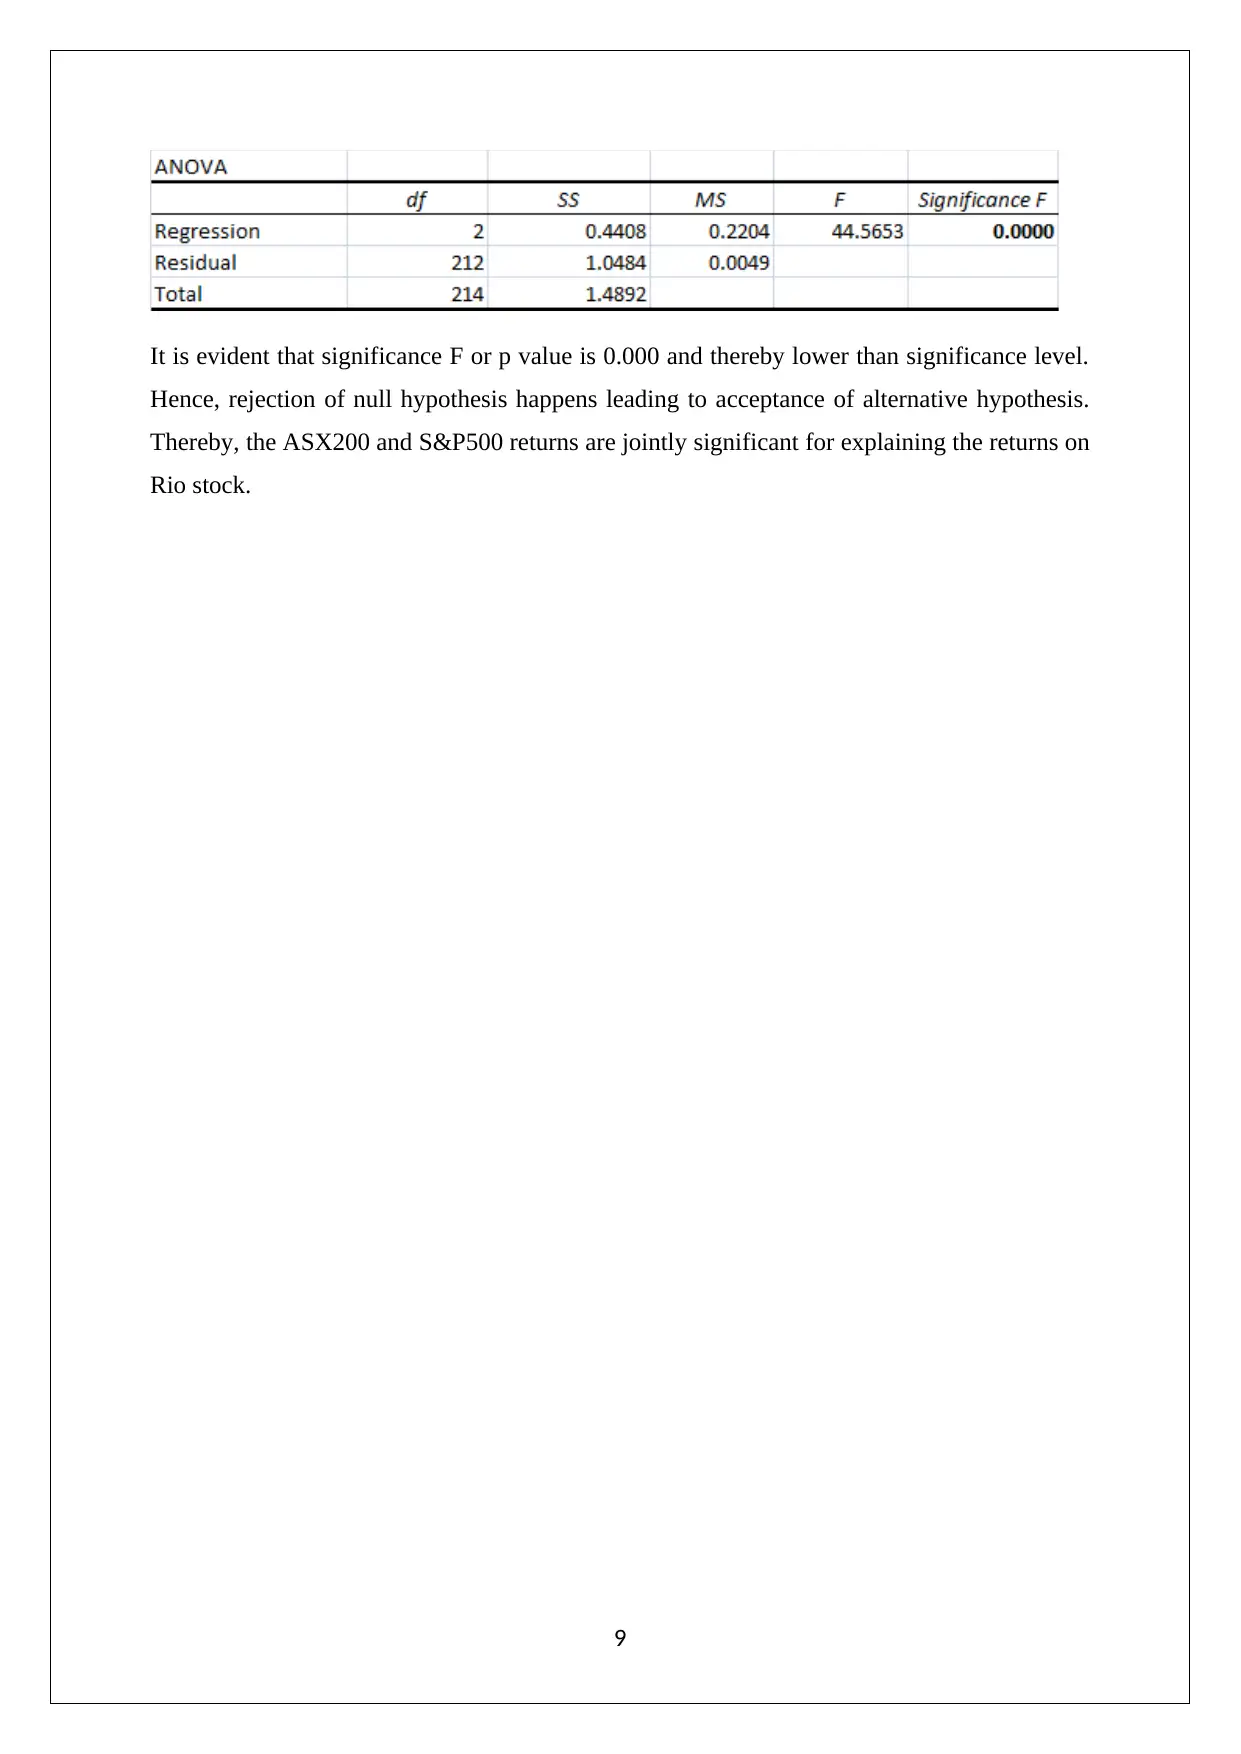
This document presents a comprehensive solution to the MAF759 Analytical Methods assignment, focusing on the analysis of Rio Tinto Limited (RIO) stock performance, alongside the S&P 500 and ASX 200 indices. The assignment begins with the computation of descriptive statistics for monthly RIO prices, S&P 500, and ASX 200 indices. It then delves into calculating monthly discrete returns and constructing frequency distributions for the same. The solution proceeds to address probability calculations for mean returns of the S&P 500 and ASX 200 indices. Furthermore, it includes the analysis of covariance and correlation coefficients, along with hypothesis testing to determine significance levels. The assignment concludes with a detailed regression analysis, comparing different models and evaluating the significance of intercept and slope coefficients, including R-squared values to determine the best-fit model. The analysis covers model selection and interpretation based on statistical outputs, including p-values and confidence intervals. The solution utilizes Excel for computations and provides clear interpretations of the results.
Document Page
ANALYTICAL METHODS
STUDENT ID:
[Pick the date]
tabler-icon-diamond-filled.svg

Paraphrase This Document

Need a fresh take? Get an instant paraphrase of this document with our AI Paraphraser
Document Page
Question 1
Descriptive statistics for the monthly RIO price, S&P 500 and ASX 200 index
2
Document Page
Question 2
Frequency distribution table for the returns of RIO returns, S&P 500 index returns and ASX
200 index returns
3
Document Page
Question 3
Probability that mean return of S&P index is above 5%. The requisite computations have
been performed using Excel and the relevant results are indicated below.
Therefore, the probability that mean return of S&P index is above 5% is 0.133.
4
tabler-icon-diamond-filled.svg

Paraphrase This Document

Need a fresh take? Get an instant paraphrase of this document with our AI Paraphraser
Document Page
Probability that mean return of ASX200 index is between-2% and 2%. The requisite
computations have been performed using Excel and the relevant results are indicated below.
Probability that mean return of ASX200 index is between -2% and 2% is 0.415.
Question 4
Covariance of S&P index returns and ASX returns
Aim is to find whether the correlation coefficient RIO return and ASX 200 returns is
significant at 1% or not
H0 : ρ=0
Ha : ρ 0
Test statistics t¿ r n2
1r2 =¿
t¿ 0.5431 2152
1 ( 0.5431 )2 =9.44
5
Document Page
Degree of freedom = n-2 = 215 – 2 = 213
The p value = 0.00
Significance level = 0.01
The p value is lower than the significance level and hence, sufficient evidence is present for
rejecting null hypothesis and accepting alternative hypothesis. Therefore, it can be concluded
that the correlation coefficient RIO return and ASX 200 returns is significant at 1%
significant level.
Question 5
Model A
Model B
6
Document Page
Model C
5.1 For Model A, the intercept coefficient significance needs to be checked.
H0 :α =0
Ha :α 0
The relevant regression output with relevant test statistics and p value is shown below.
The t stat = 1.712 (From regression)
7
tabler-icon-diamond-filled.svg

Paraphrase This Document

Need a fresh take? Get an instant paraphrase of this document with our AI Paraphraser
Document Page
The p value = 0.088 (From regression)
Significance level = 0.05
The p value is greater than the significance level and hence, sufficient evidence isnot present
for rejecting null hypothesis and accepting alternative hypothesis. Therefore, it can be
concluded that intercept is not significant.
95% confidence interval for slope coefficient for Model B is (0.983, 1.502) as shown below.
5.2 R square value would be taken into consideration to decide which model is appropriate.
R square of Model A = 0.1439
R square of Model B = 0.2950
Model B would explain the more variation in dependent variable through variation in the
independent variable as compared with model A and hence, the suitable model for analysis
would be Model B.
5.3 The requisite hypotheses are defined below.
Significance level = 0.01
The relevant output from regression model C for the above hypothesis testing is indicated as
follows.
8
Document Page
It is evident that significance F or p value is 0.000 and thereby lower than significance level.
Hence, rejection of null hypothesis happens leading to acceptance of alternative hypothesis.
Thereby, the ASX200 and S&P500 returns are jointly significant for explaining the returns on
Rio stock.
9
chevron_up_icon
1 out of 9
circle_padding
hide_on_mobile
zoom_out_icon
[object Object]