Report: Facebook's Revenue, User Statistics and Market Trend Analysis

Verified

Added on  2024/05/17

|19
|1550
|280
Report
AI Summary
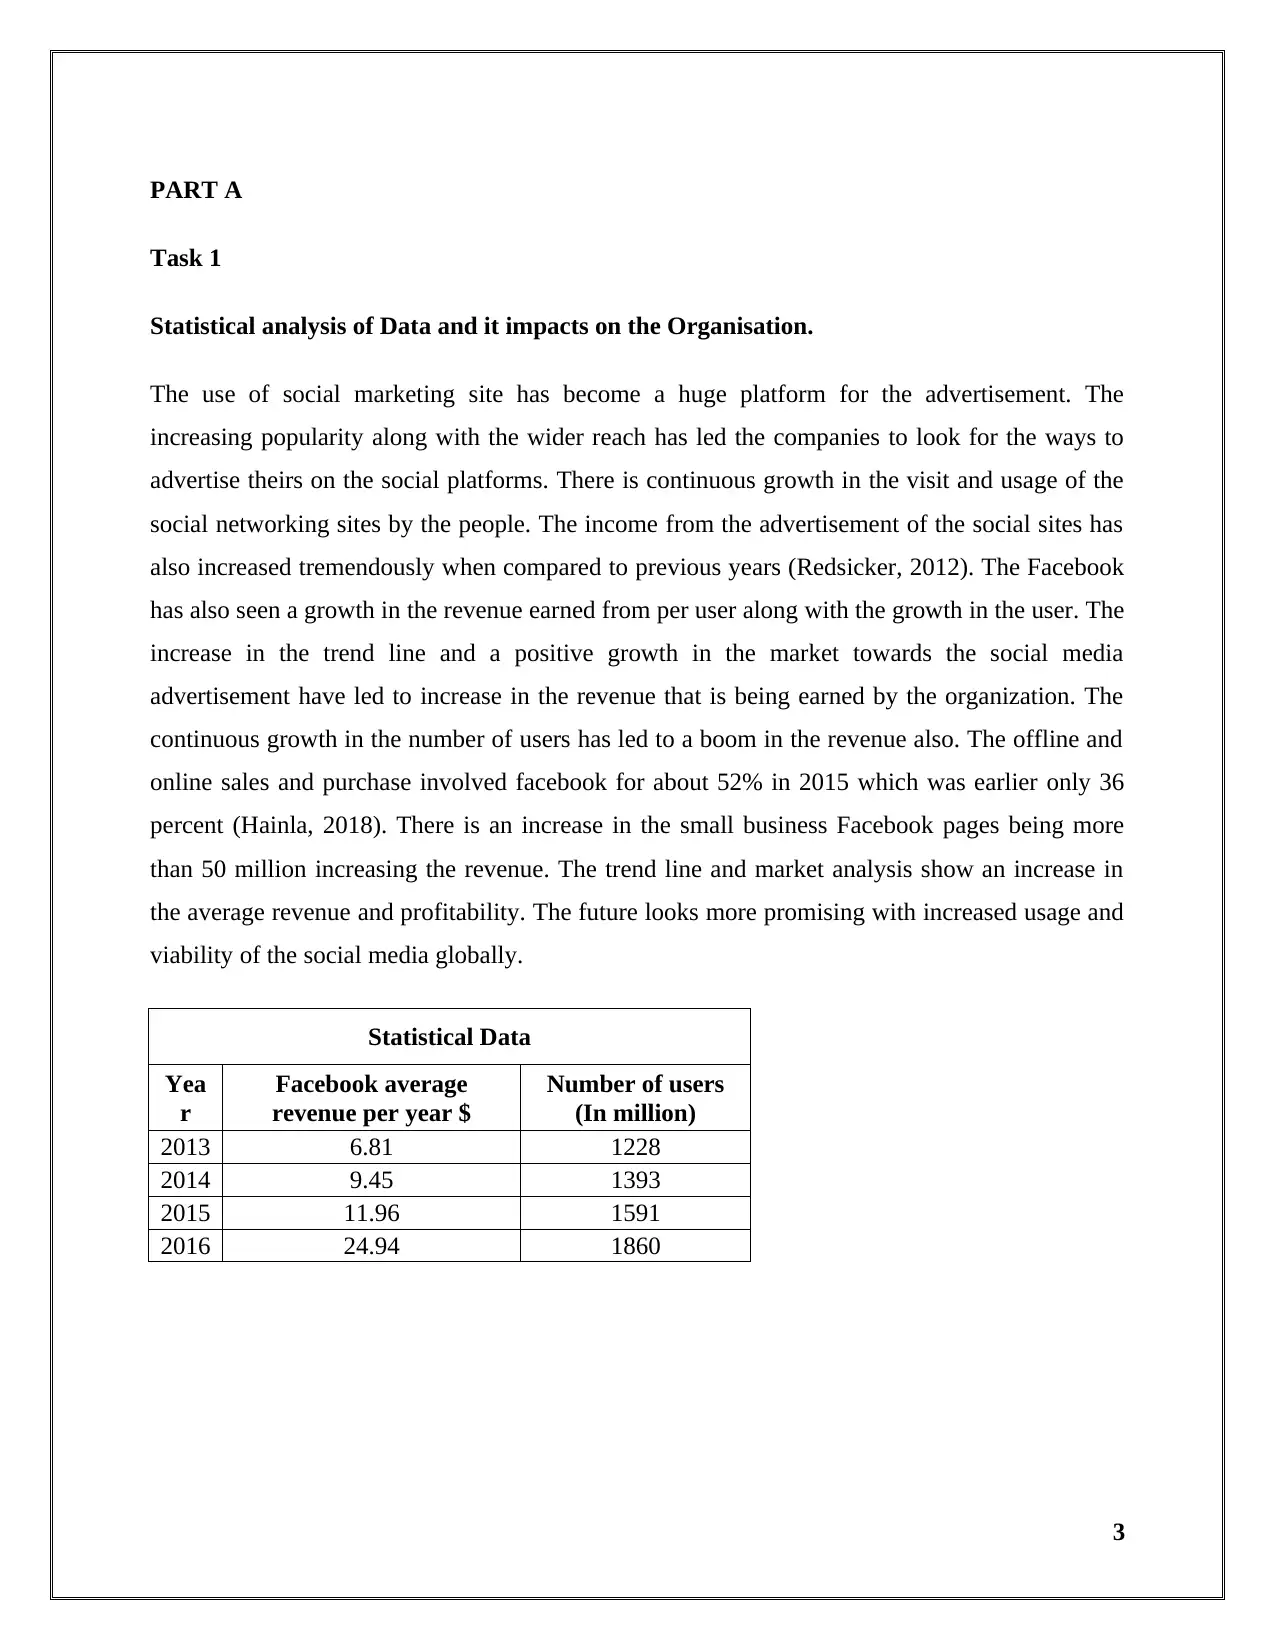
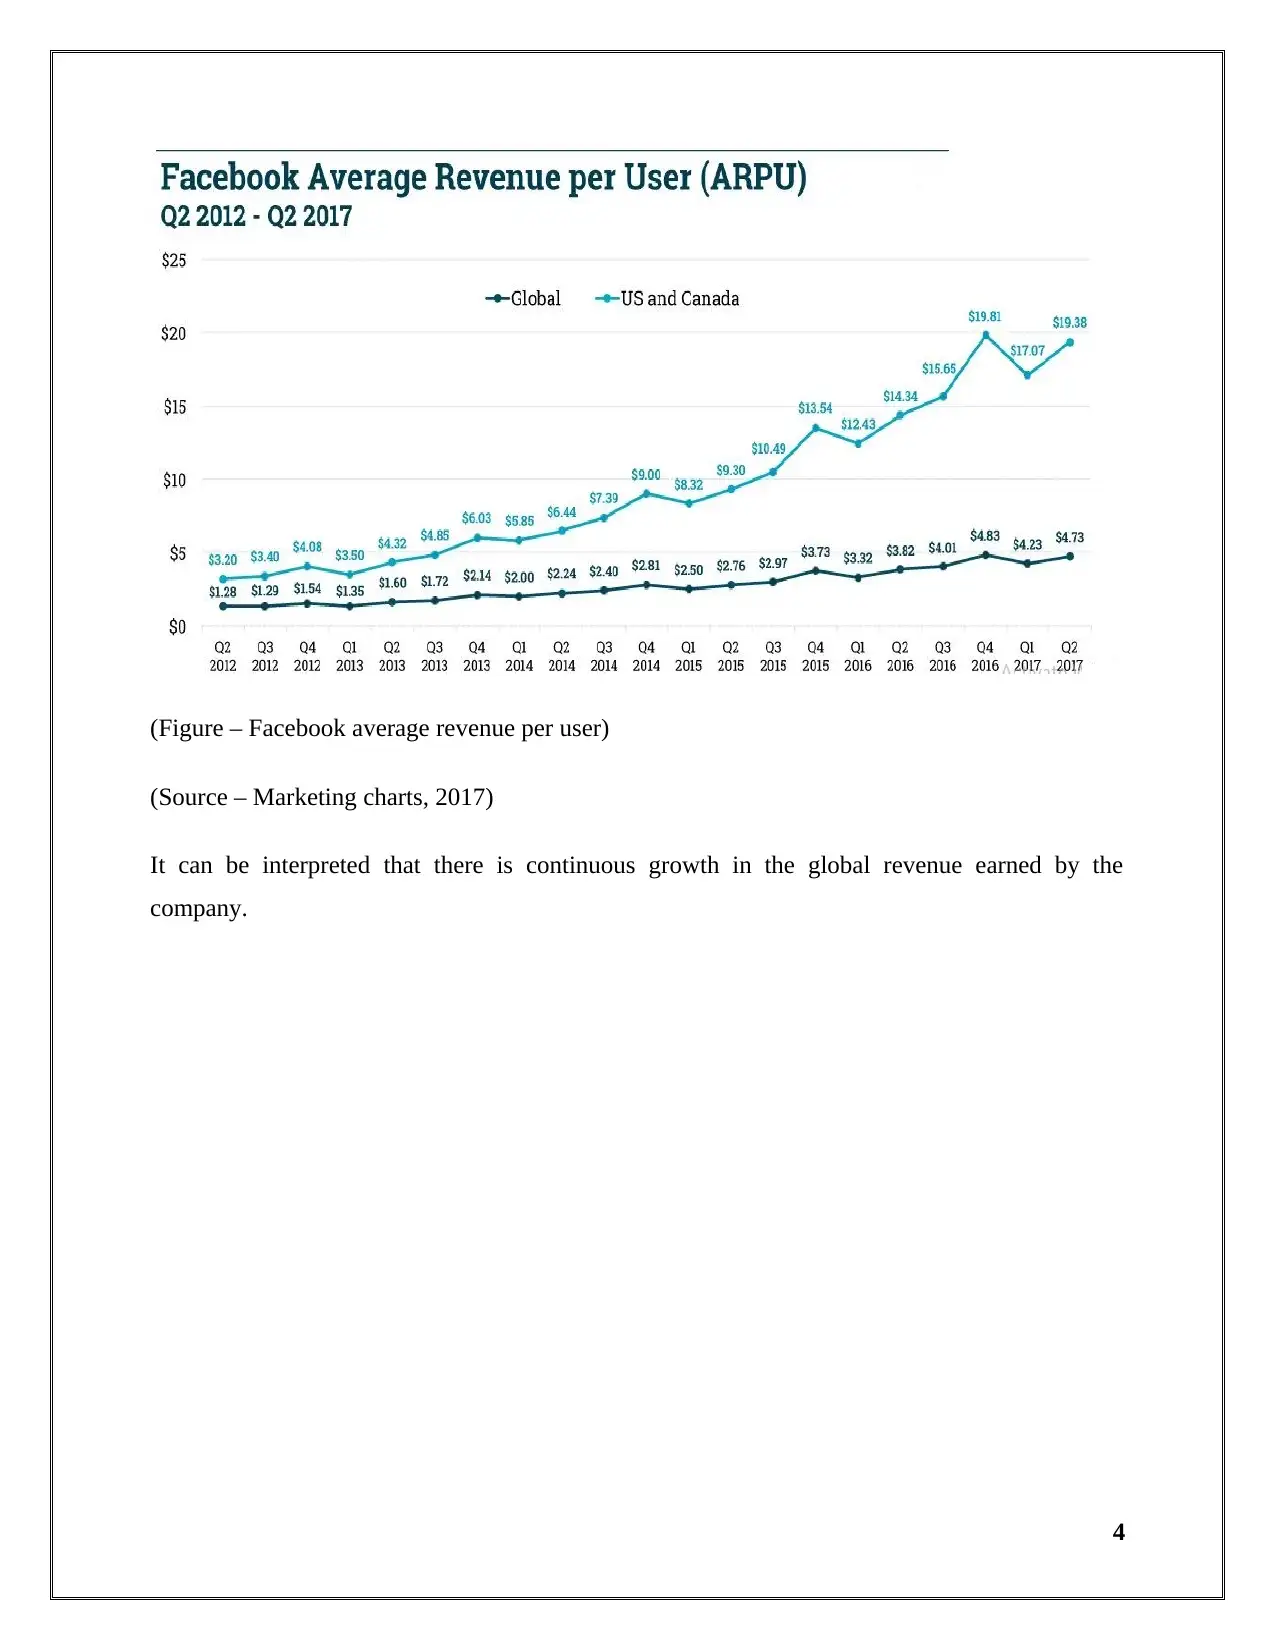
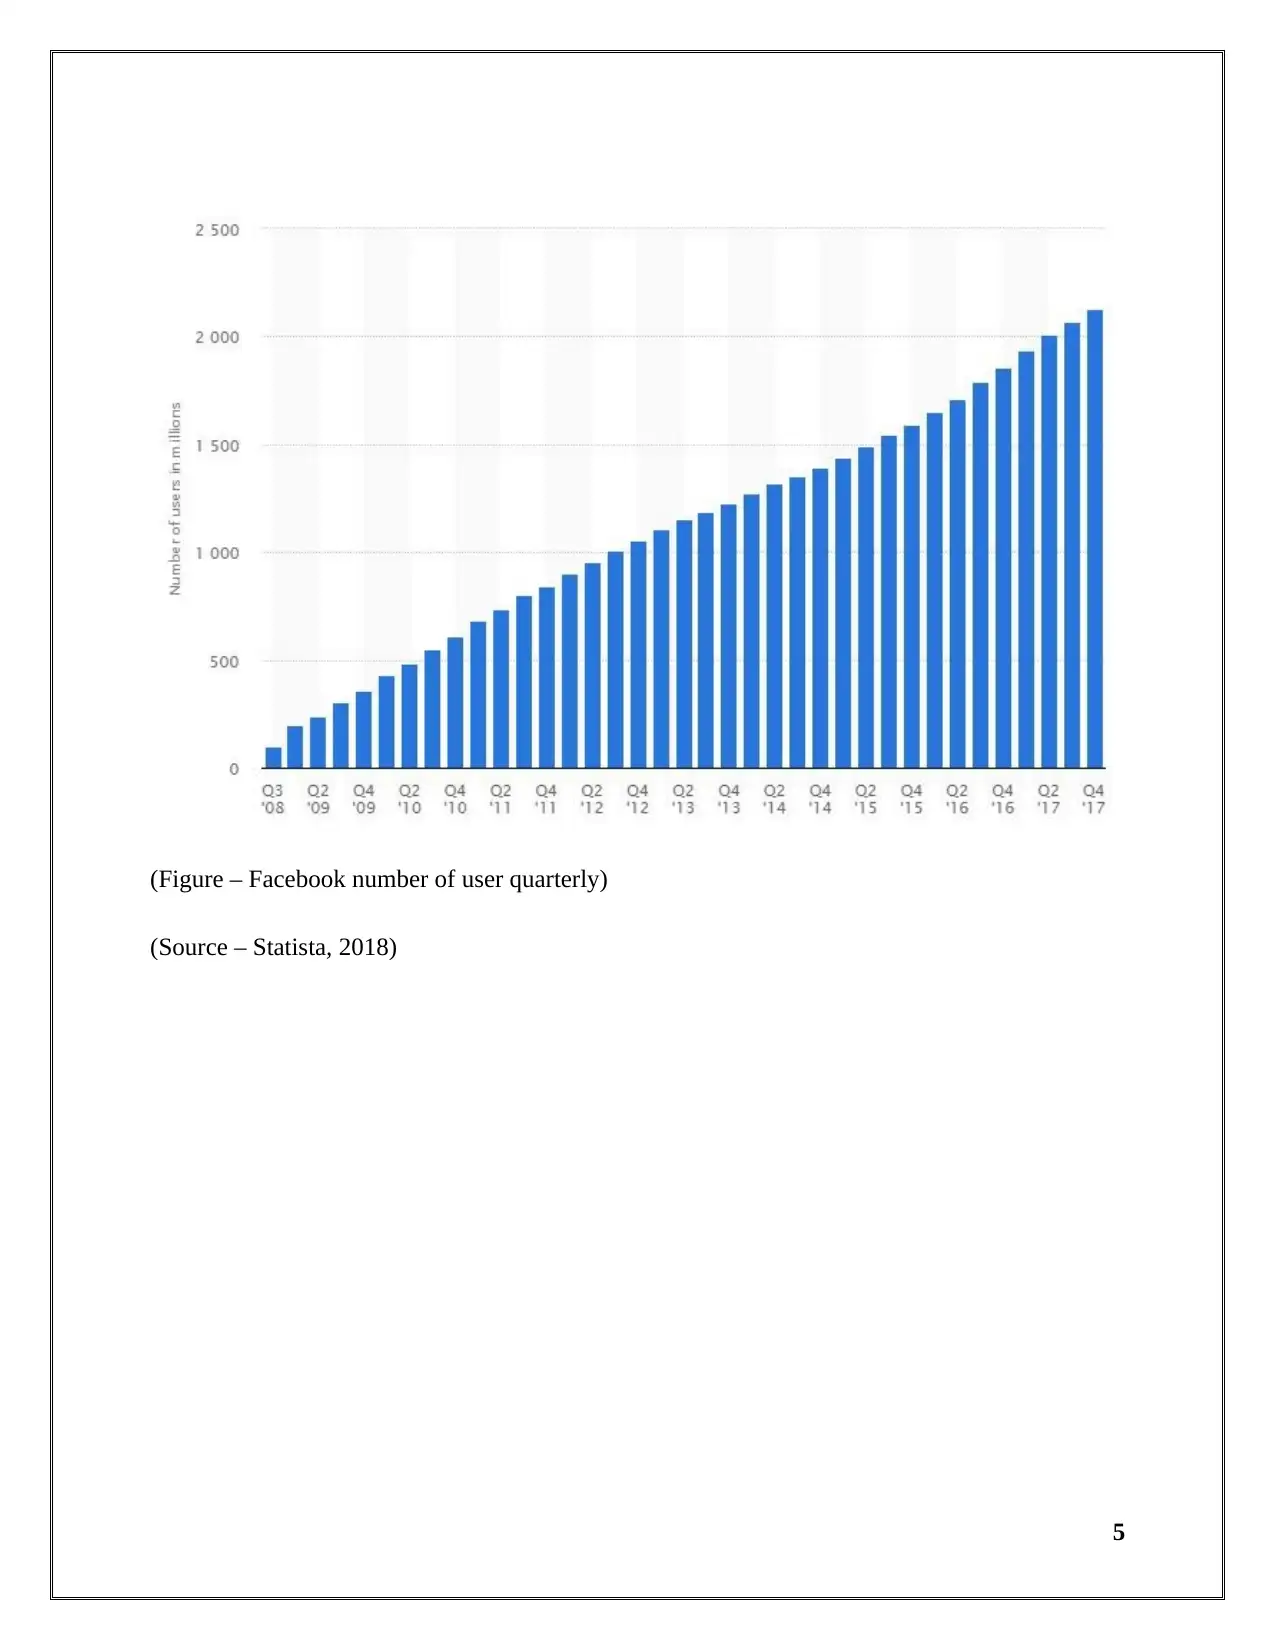
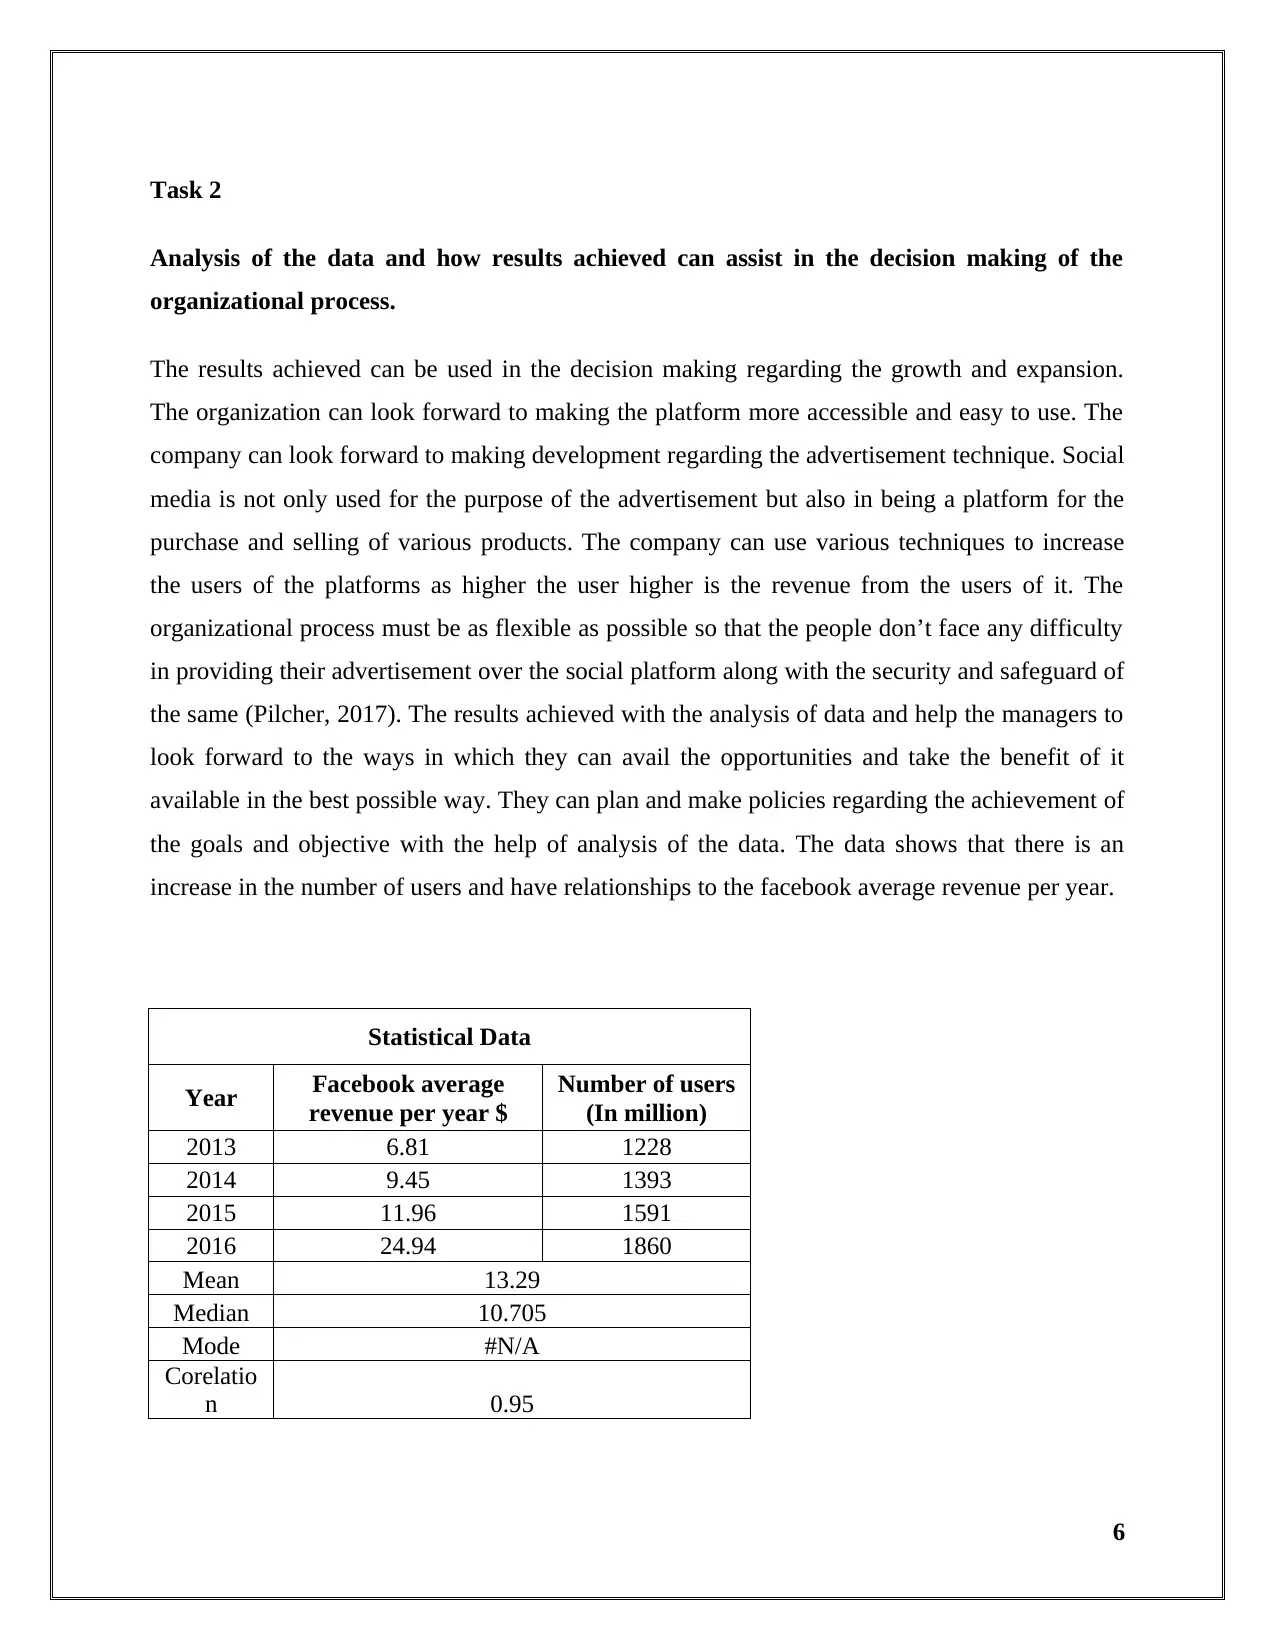
This report provides a comprehensive analysis of Facebook's market trends, focusing on revenue and user growth from 2013 to 2016. It includes a statistical analysis of the data, examining metrics such as average revenue per user and the number of users. The report also explores how these results can assist in organizational decision-making, particularly in areas like platform accessibility and advertisement techniques. Furthermore, a forecast based on historical data and trend lines is developed to predict future revenue growth. The visual representation of the data, including charts and graphs, supports the analysis and findings, highlighting the relationship between user engagement and revenue generation. The report concludes with recommendations for attracting new users and safeguarding the platform from threats, emphasizing the positive future prospects of social media advertising. Desklib offers a wide range of similar solved assignments and study resources for students.
Document Page
Market Trends
1
tabler-icon-diamond-filled.svg

Paraphrase This Document

Need a fresh take? Get an instant paraphrase of this document with our AI Paraphraser
Document Page
Table of Contents
PART A...........................................................................................................................................3
Task 1..........................................................................................................................................3
Task 2..........................................................................................................................................6
Part B..............................................................................................................................................8
Task 1..........................................................................................................................................8
Part C..............................................................................................................................................9
Task 1 (Task 2)...........................................................................................................................9
2
Document Page
PART A
Task 1
Statistical analysis of Data and it impacts on the Organisation.
The use of social marketing site has become a huge platform for the advertisement. The
increasing popularity along with the wider reach has led the companies to look for the ways to
advertise theirs on the social platforms. There is continuous growth in the visit and usage of the
social networking sites by the people. The income from the advertisement of the social sites has
also increased tremendously when compared to previous years (Redsicker, 2012). The Facebook
has also seen a growth in the revenue earned from per user along with the growth in the user. The
increase in the trend line and a positive growth in the market towards the social media
advertisement have led to increase in the revenue that is being earned by the organization. The
continuous growth in the number of users has led to a boom in the revenue also. The offline and
online sales and purchase involved facebook for about 52% in 2015 which was earlier only 36
percent (Hainla, 2018). There is an increase in the small business Facebook pages being more
than 50 million increasing the revenue. The trend line and market analysis show an increase in
the average revenue and profitability. The future looks more promising with increased usage and
viability of the social media globally.
Statistical Data
Yea
r
Facebook average
revenue per year $
Number of users
(In million)
2013 6.81 1228
2014 9.45 1393
2015 11.96 1591
2016 24.94 1860
3
Document Page
(Figure – Facebook average revenue per user)
(Source – Marketing charts, 2017)
It can be interpreted that there is continuous growth in the global revenue earned by the
company.
4
tabler-icon-diamond-filled.svg

Paraphrase This Document

Need a fresh take? Get an instant paraphrase of this document with our AI Paraphraser
Document Page
(Figure – Facebook number of user quarterly)
(Source – Statista, 2018)
5
Document Page
Task 2
Analysis of the data and how results achieved can assist in the decision making of the
organizational process.
The results achieved can be used in the decision making regarding the growth and expansion.
The organization can look forward to making the platform more accessible and easy to use. The
company can look forward to making development regarding the advertisement technique. Social
media is not only used for the purpose of the advertisement but also in being a platform for the
purchase and selling of various products. The company can use various techniques to increase
the users of the platforms as higher the user higher is the revenue from the users of it. The
organizational process must be as flexible as possible so that the people don’t face any difficulty
in providing their advertisement over the social platform along with the security and safeguard of
the same (Pilcher, 2017). The results achieved with the analysis of data and help the managers to
look forward to the ways in which they can avail the opportunities and take the benefit of it
available in the best possible way. They can plan and make policies regarding the achievement of
the goals and objective with the help of analysis of the data. The data shows that there is an
increase in the number of users and have relationships to the facebook average revenue per year.
Statistical Data
Year Facebook average
revenue per year $
Number of users
(In million)
2013 6.81 1228
2014 9.45 1393
2015 11.96 1591
2016 24.94 1860
Mean 13.29
Median 10.705
Mode #N/A
Corelatio
n 0.95
6
Document Page
Regression Statistics
Multiple R 0.95122038
R Square 0.90482021
Adjusted R Square 0.85723031
Standard Error 3.04027331
Observations 4
ANOVA
df SS MS F
Significance
F
Regression 1 175.7408764
175.7408
8 19.012864 0.048779622
Residual 2 18.48652364
9.243261
8
Total 3 194.2274
Coefficients Standard Error t Stat P-value Lower 95% Upper 95% Lower 95.0% Upper 95.0%
Intercept -29.418476 9.911942073 -2.967983 0.0972444 -72.06612042 13.22916882 -72.06612 13.22916882
X Variable 1 0.0281347 0.006452359 4.3603743 0.0487796 0.00037244 0.055896962 0.00037244 0.055896962
7
tabler-icon-diamond-filled.svg

Paraphrase This Document

Need a fresh take? Get an instant paraphrase of this document with our AI Paraphraser
Document Page
Part B
Task 1
Develop forecast for the organization.
The forecast is conducted on the basis of the historical data and trend line. The forecast is based
on the linear equation made on the basis of previous year results and data (Hohle, and Teigen,
2015).
Statistical Data
Yea
r
Facebook average
revenue per year $
2013 6.81
2014 9.45
2015 11.96
2016 24.94
2012.5 2013 2013.5 2014 2014.5 2015 2015.5 2016 2016.5
0
5
10
15
20
25
30
f(x) = 5.69 x − 11449.215
R² = 0.833458616034627
Facebook average revenue per year $
Facebook
average
revenue per
year $
Linear
(Facebook
average
revenue per
year $)
8
Document Page
It could be seen that the trend line is upward moving in the future also. There will be growth and
increase in the revenue of the organization. There is an upward slope in the revenue earned by
the organisaion.
9
Document Page
Part C
Task 1 (Task 2)
Visual representation.
Slide 1
Title Slide
Slide 2
10
tabler-icon-diamond-filled.svg

Paraphrase This Document

Need a fresh take? Get an instant paraphrase of this document with our AI Paraphraser
Document Page
The topics to be covered in the presentation
Slide 3
11
Document Page
The presentation consists of an analysis of the current trend and statistical analysis depending
upon the data. There is also forecasting of the next 2 year depending upon the historical data that
is available followed by the recommendation and findings.
Slide 4
The data is collected from the various sources. The statistical data used for analyzing the trend
related to the revenue that is being earned by the facebook per year. The number of users (in the
million) are also considered for purpose of statistical analysis.
Slide 5
12
chevron_up_icon
1 out of 19
circle_padding
hide_on_mobile
zoom_out_icon
[object Object]