Analyzing Australian Weekly Earnings: A Business Data Analysis

Verified

Added on  2023/06/14

|8
|1265
|305
Report
AI Summary
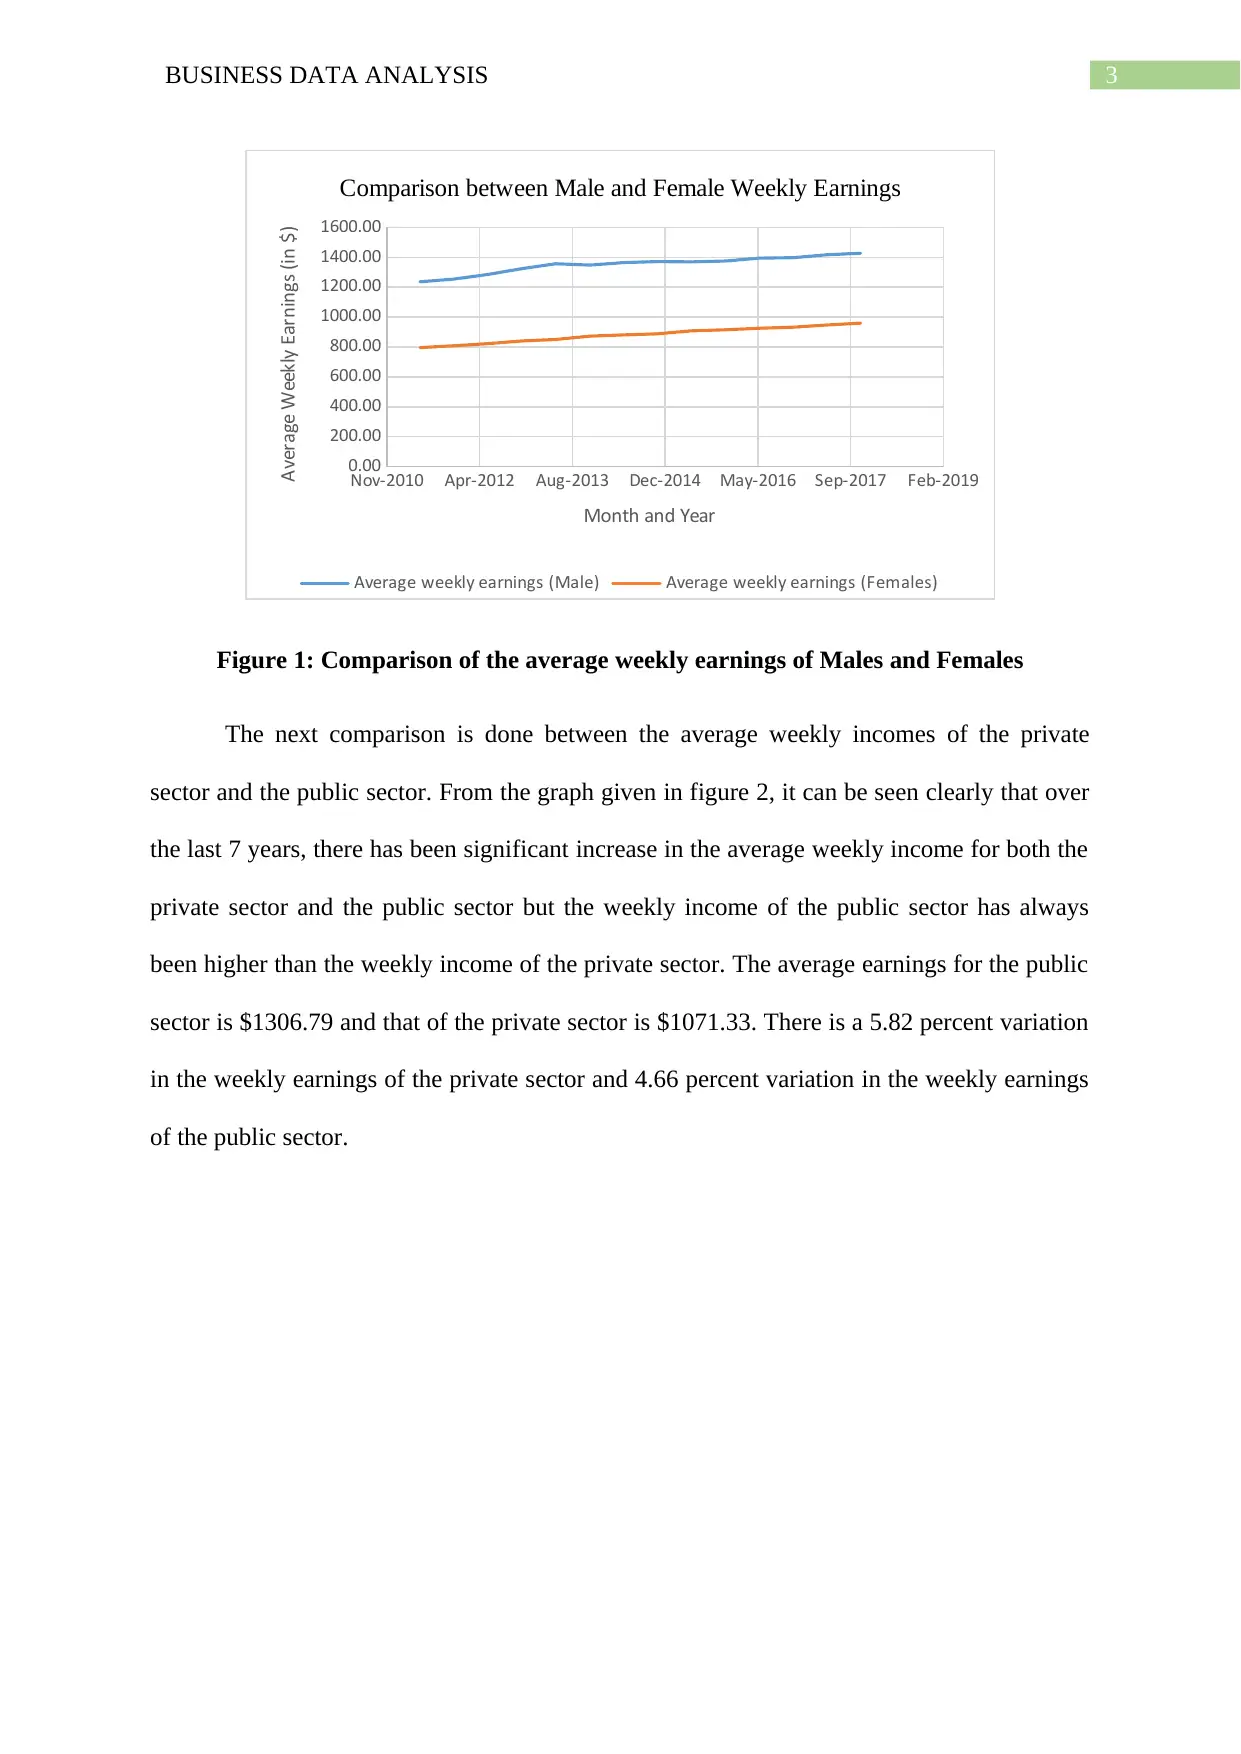
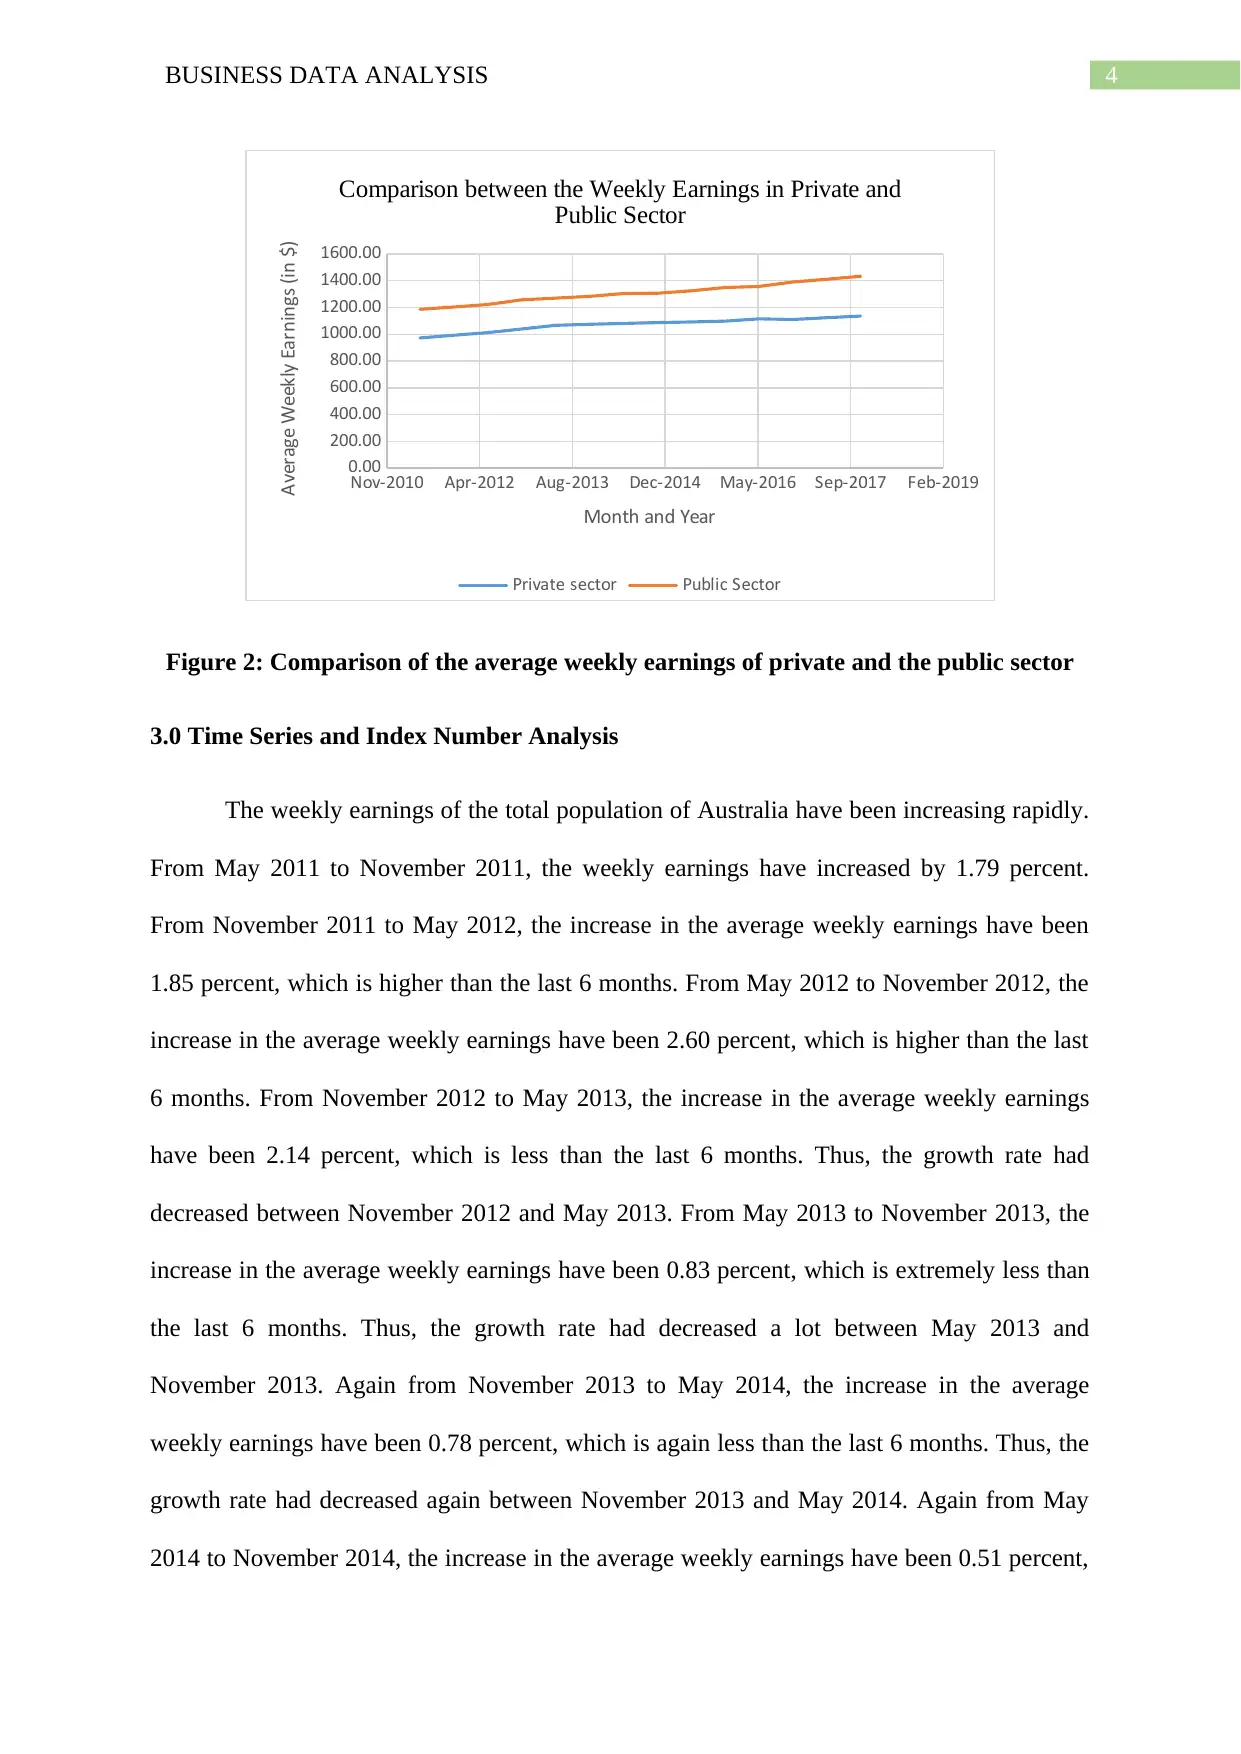
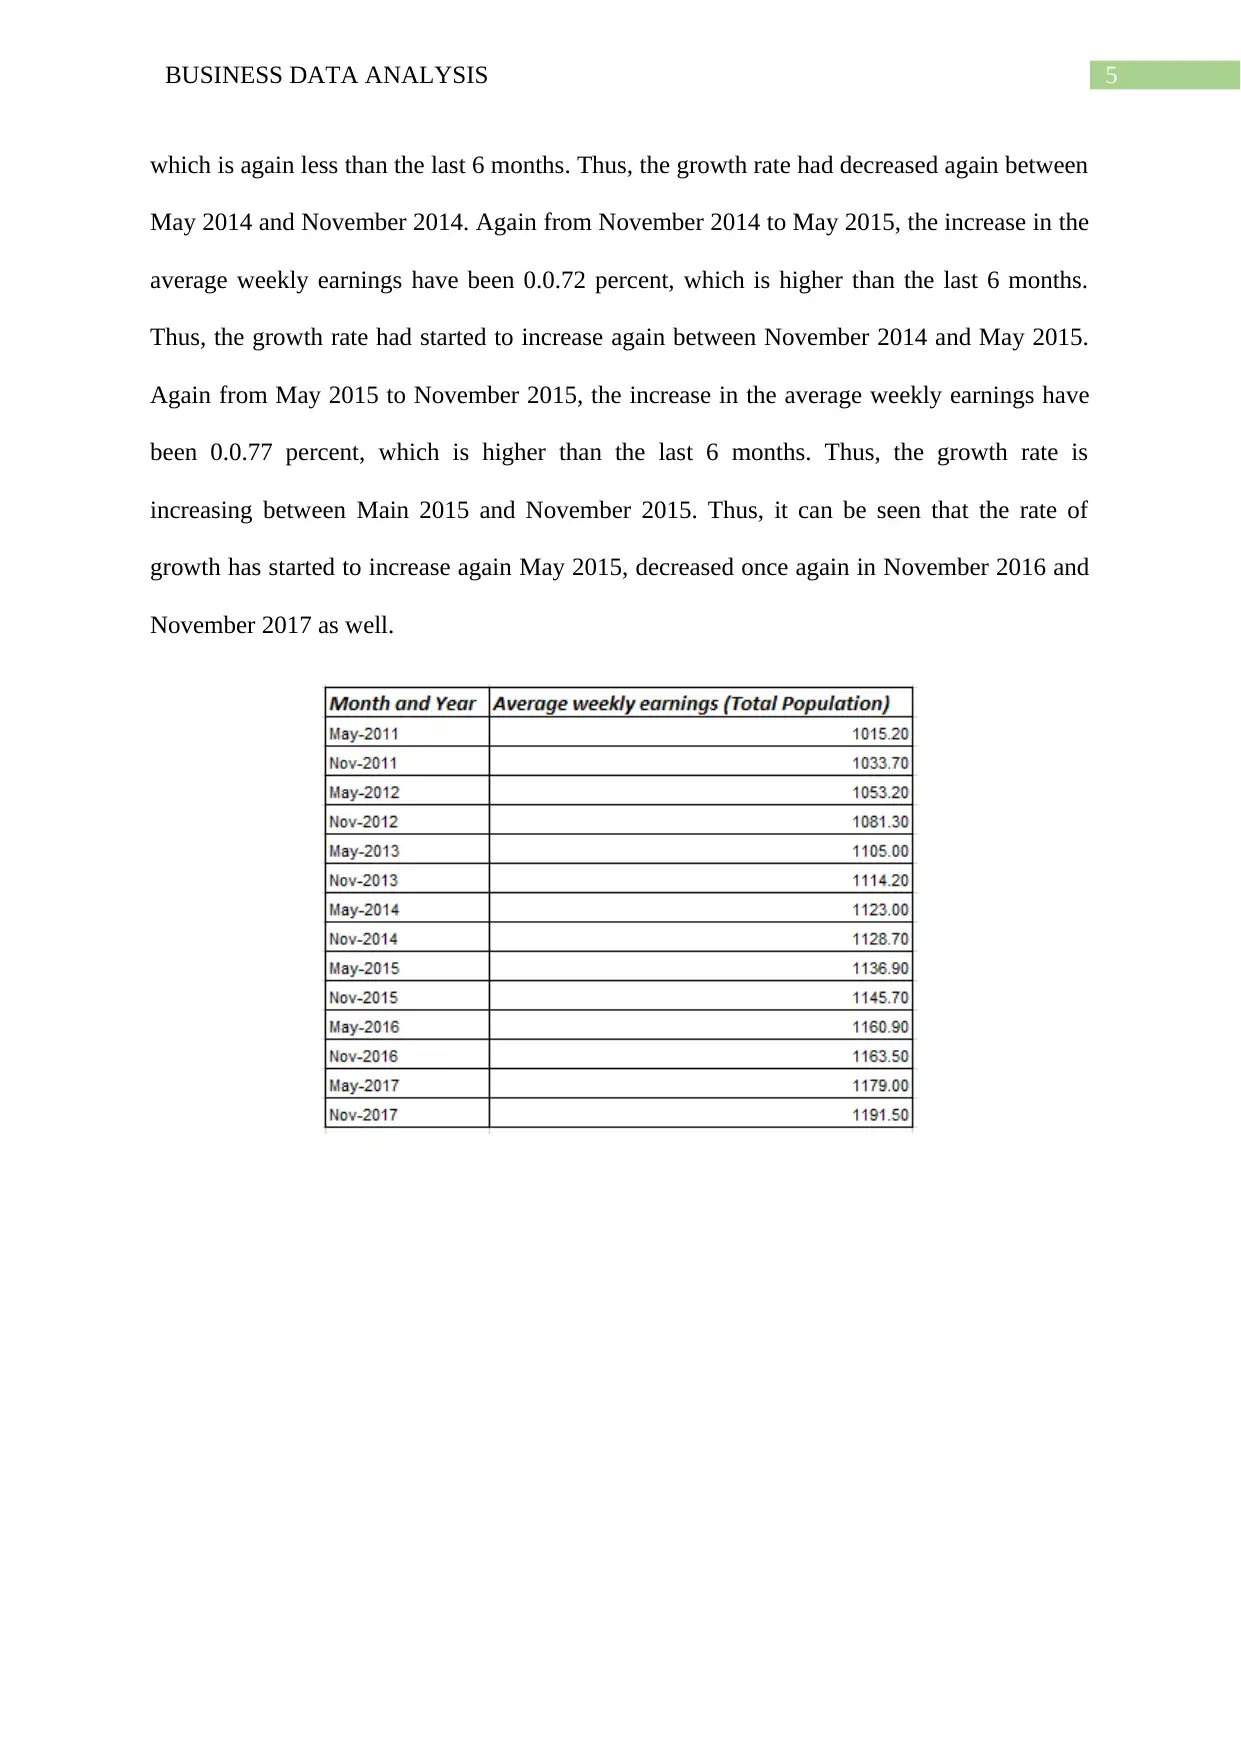
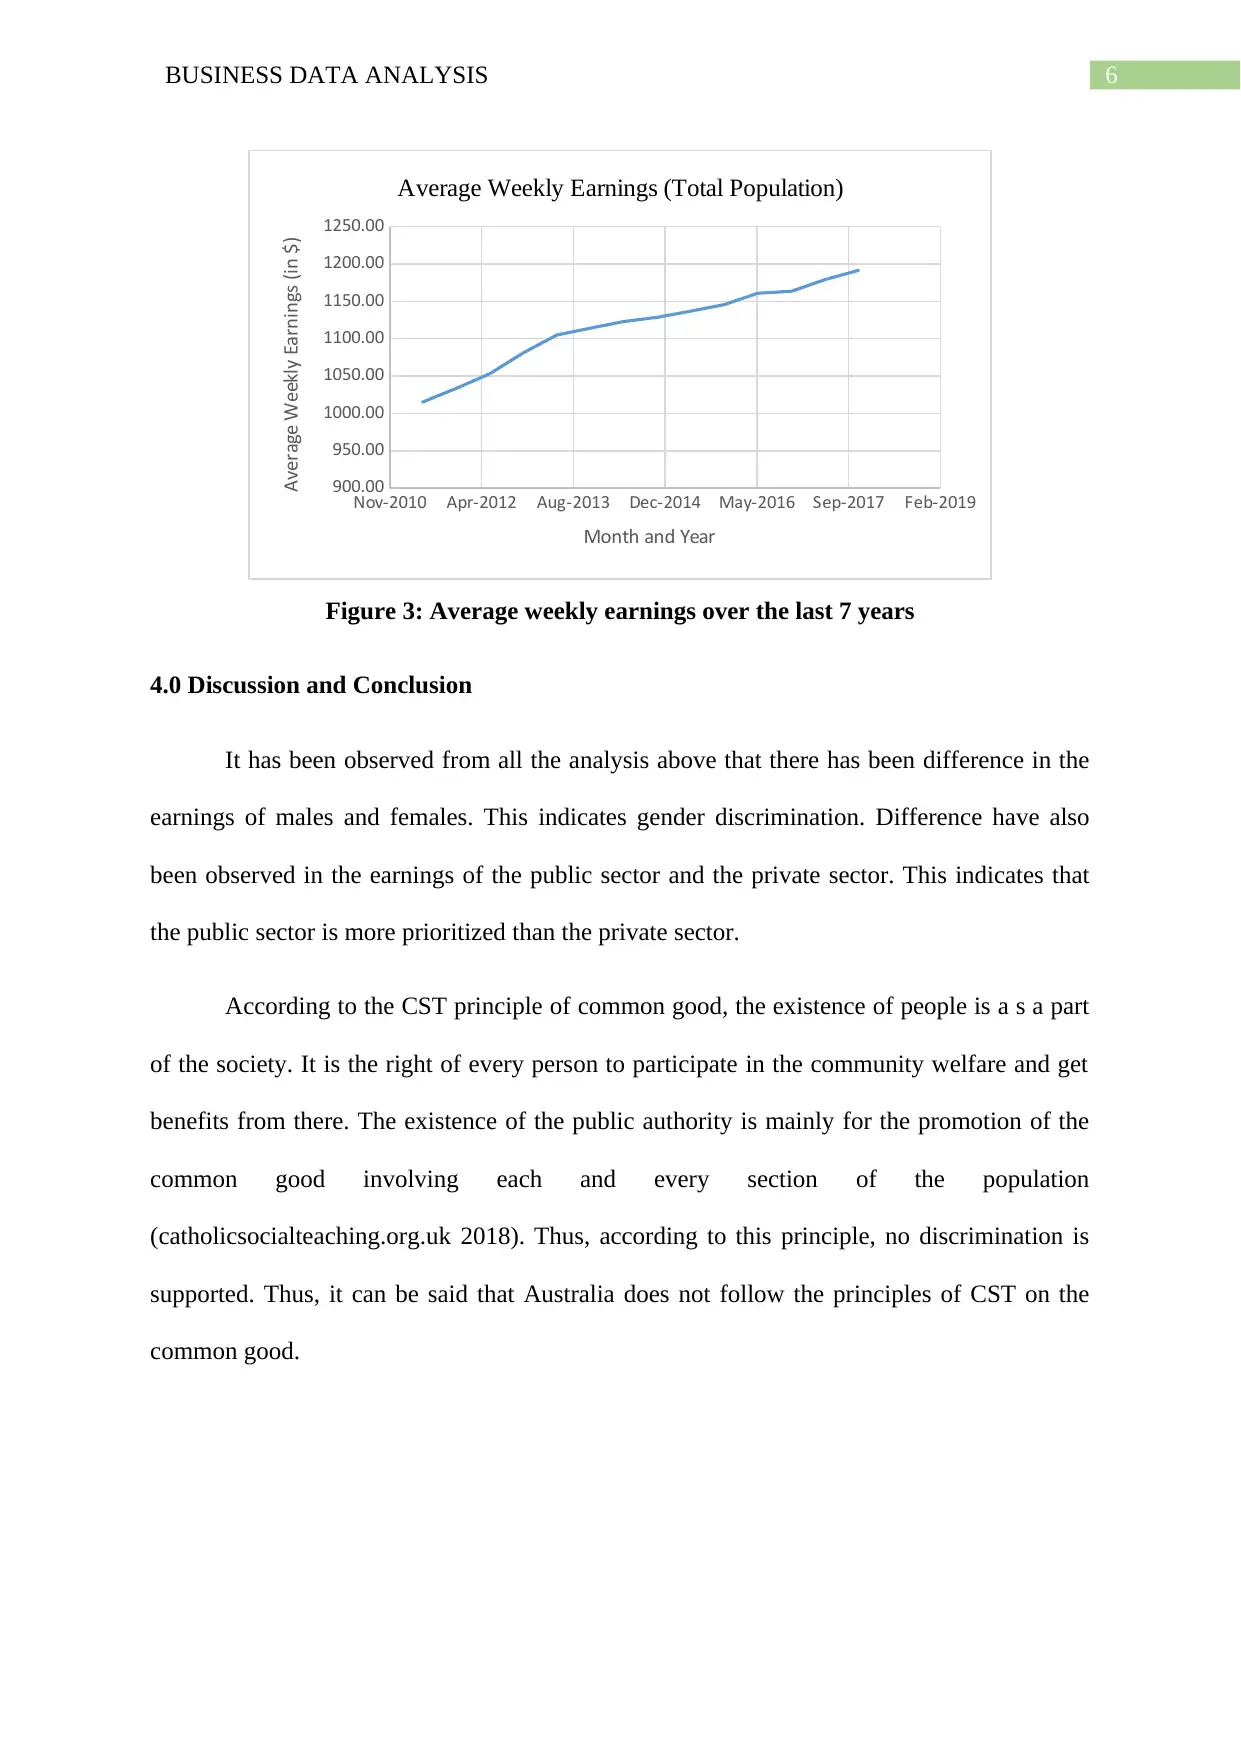
This report analyzes the trends in Australian average weekly earnings from March 2011 to November 2017 using data from the Australian Bureau of Statistics (ABS). The analysis includes descriptive statistics comparing male and female earnings, as well as private and public sector earnings. The findings indicate a consistent disparity between male and female earnings, with males earning significantly more. Similarly, public sector employees earn more on average than those in the private sector. Time series analysis reveals fluctuating growth rates in weekly earnings over the period. The report concludes by discussing the implications of these findings in the context of the CST principle of common good, suggesting that the observed disparities may indicate a lack of adherence to these principles in Australia.
Document Page
Running Head: BUSINESS DATA ANALYSIS
Business Data Analysis
Name of the Student
Name of the University
Author Note
tabler-icon-diamond-filled.svg

Secure Best Marks with AI Grader

Need help grading? Try our AI Grader for instant feedback on your assignments.
Document Page
1BUSINESS DATA ANALYSIS
Table of Contents
1.0 Introduction..........................................................................................................................2
2.0 Descriptive Statistics............................................................................................................2
3.0 Time Series and Index Number Analysis.............................................................................4
4.0 Discussion and Conclusion..................................................................................................6
References..................................................................................................................................7
Document Page
2BUSINESS DATA ANALYSIS
1.0 Introduction
The average weekly earnings of Australia have been changing over time. This report
mainly deals with the average weekly earnings in Australia. Assessing the changes in the
weekly earnings over time is the primary aim of this study. For the purpose of this research,
the data has been collected from the Australian Bureau of Statistics (ABS) website on the
average weekly income. Data on the male and female weekly income, weekly income of the
private and the public sector have been collected from the website for the last 7 years.
2.0 Descriptive Statistics
The data that has to be analysed has been obtained from the ABS website (abs.gov.au
2018). Analysis has been conducted on the average weekly income between male and female
employees. Comparison have also been conducted on the average weekly incomes of the
private and the public sector over the past 7 years. The dataset contains information about the
average weekly incomes from March 2011 to November 2017. From the graph given in
figure 1, it can be seen clearly that over the last 7 years, there has been significant increase in
the average weekly income for both the male and the female employees but the weekly
income of the male employees have always been higher than that of the female employees.
The average earnings for the male employees is $3151.71 and that of the female employees is
$881.76. There is a 4.27 percent variation in the male earnings and 5.95 percent variation in
the female earnings.
Document Page
3BUSINESS DATA ANALYSIS
Nov-2010 Apr-2012 Aug-2013 Dec-2014 May-2016 Sep-2017 Feb-2019
0.00
200.00
400.00
600.00
800.00
1000.00
1200.00
1400.00
1600.00
Comparison between Male and Female Weekly Earnings
Average weekly earnings (Male) Average weekly earnings (Females)
Month and Year
Average Weekly Earnings (in $)
Figure 1: Comparison of the average weekly earnings of Males and Females
The next comparison is done between the average weekly incomes of the private
sector and the public sector. From the graph given in figure 2, it can be seen clearly that over
the last 7 years, there has been significant increase in the average weekly income for both the
private sector and the public sector but the weekly income of the public sector has always
been higher than the weekly income of the private sector. The average earnings for the public
sector is $1306.79 and that of the private sector is $1071.33. There is a 5.82 percent variation
in the weekly earnings of the private sector and 4.66 percent variation in the weekly earnings
of the public sector.
tabler-icon-diamond-filled.svg

Secure Best Marks with AI Grader

Need help grading? Try our AI Grader for instant feedback on your assignments.
Document Page
4BUSINESS DATA ANALYSIS
Nov-2010 Apr-2012 Aug-2013 Dec-2014 May-2016 Sep-2017 Feb-2019
0.00
200.00
400.00
600.00
800.00
1000.00
1200.00
1400.00
1600.00
Comparison between the Weekly Earnings in Private and
Public Sector
Private sector Public Sector
Month and Year
Average Weekly Earnings (in $)
Figure 2: Comparison of the average weekly earnings of private and the public sector
3.0 Time Series and Index Number Analysis
The weekly earnings of the total population of Australia have been increasing rapidly.
From May 2011 to November 2011, the weekly earnings have increased by 1.79 percent.
From November 2011 to May 2012, the increase in the average weekly earnings have been
1.85 percent, which is higher than the last 6 months. From May 2012 to November 2012, the
increase in the average weekly earnings have been 2.60 percent, which is higher than the last
6 months. From November 2012 to May 2013, the increase in the average weekly earnings
have been 2.14 percent, which is less than the last 6 months. Thus, the growth rate had
decreased between November 2012 and May 2013. From May 2013 to November 2013, the
increase in the average weekly earnings have been 0.83 percent, which is extremely less than
the last 6 months. Thus, the growth rate had decreased a lot between May 2013 and
November 2013. Again from November 2013 to May 2014, the increase in the average
weekly earnings have been 0.78 percent, which is again less than the last 6 months. Thus, the
growth rate had decreased again between November 2013 and May 2014. Again from May
2014 to November 2014, the increase in the average weekly earnings have been 0.51 percent,
Document Page
5BUSINESS DATA ANALYSIS
which is again less than the last 6 months. Thus, the growth rate had decreased again between
May 2014 and November 2014. Again from November 2014 to May 2015, the increase in the
average weekly earnings have been 0.0.72 percent, which is higher than the last 6 months.
Thus, the growth rate had started to increase again between November 2014 and May 2015.
Again from May 2015 to November 2015, the increase in the average weekly earnings have
been 0.0.77 percent, which is higher than the last 6 months. Thus, the growth rate is
increasing between Main 2015 and November 2015. Thus, it can be seen that the rate of
growth has started to increase again May 2015, decreased once again in November 2016 and
November 2017 as well.
Document Page
6BUSINESS DATA ANALYSIS
Nov-2010 Apr-2012 Aug-2013 Dec-2014 May-2016 Sep-2017 Feb-2019
900.00
950.00
1000.00
1050.00
1100.00
1150.00
1200.00
1250.00
Average Weekly Earnings (Total Population)
Month and Year
Average Weekly Earnings (in $)
Figure 3: Average weekly earnings over the last 7 years
4.0 Discussion and Conclusion
It has been observed from all the analysis above that there has been difference in the
earnings of males and females. This indicates gender discrimination. Difference have also
been observed in the earnings of the public sector and the private sector. This indicates that
the public sector is more prioritized than the private sector.
According to the CST principle of common good, the existence of people is a s a part
of the society. It is the right of every person to participate in the community welfare and get
benefits from there. The existence of the public authority is mainly for the promotion of the
common good involving each and every section of the population
(catholicsocialteaching.org.uk 2018). Thus, according to this principle, no discrimination is
supported. Thus, it can be said that Australia does not follow the principles of CST on the
common good.
tabler-icon-diamond-filled.svg

Paraphrase This Document

Need a fresh take? Get an instant paraphrase of this document with our AI Paraphraser
Document Page
7BUSINESS DATA ANALYSIS
References
Abs.gov.au. (2018). 6302.0 - Average Weekly Earnings, Australia, Nov 2017. [online]
Available at: http://www.abs.gov.au/AUSSTATS/abs@.nsf/DetailsPage/6302.0Nov
%202017?OpenDocument [Accessed 12 Apr. 2018].
Catholic Social Teaching. (2018). Further Explanation. [online] Available at:
http://www.catholicsocialteaching.org.uk/principles/info/ [Accessed 12 Apr. 2018].
Croucher, J.S., 2013. Introductory mathematics and statistics.
chevron_up_icon
1 out of 8
circle_padding
hide_on_mobile
zoom_out_icon
[object Object]