Data-Driven Strategies for BIJ: Analyzing UK Bangle Industry Trends
VerifiedAdded on 2023/06/15
|12
|2944
|385
Report
AI Summary
This report delves into the trends of the bangle industry, particularly within the United Kingdom, and provides a data-driven analysis to assist Bangles International Jewellery (BIJ) in enhancing its market position. It assesses data quality issues and proposes remedies, analyzes sales data from 2018 to 2020 across Japan, the UK, and the USA, and examines sales performance across different product categories and quarters. The report identifies key performance indicators such as revenue growth, profit margins, and client retention rates, emphasizing the importance of addressing challenges like data overload, real-time data collection, and visual representation. Ultimately, the report offers strategic recommendations aimed at boosting BIJ's sales and overall business performance in the competitive global market.

Data Driven Decisions
for Business
for Business
Paraphrase This Document
Need a fresh take? Get an instant paraphrase of this document with our AI Paraphraser
Contents
MAIN BODY...................................................................................................................................3
Introduction and Project plan.................................................................................................3
Data qualities issues and their remedies.................................................................................4
Data Analysis and Commentary.............................................................................................5
Data Charting and Commentary.............................................................................................9
Conclusion and Recommendation........................................................................................10
REFERENCES..............................................................................................................................12
MAIN BODY
Introduction and Project plan.
Decision-making is amongst the most valued and also critical step for an enterprise that operates
in the present market scenario. Business leaders face many encounters in establishing and
maintaining a competitive advantage in today’s market and cross cutting industry (Huang, et.al.
2019).
The purpose of this report is to discuss the bangle industry's trends and their emergence in the
United Kingdom. Aside from this, it includes data assessment and analysis in order to assist a
BIJ in growing and prospering the industry in which it operates. In addition, this report includes
appropriate suggestions that might be useful for the firm in the long run.
Further this report also highlights the implication on sales figures of bangles international
jewellery(BIJ) due to marketing campaign conducted in the UK. In this report data analytics
have been explained that can boost the sales of the BIJ in the global market. These data analytics
can be: -
Noticing the customer behaviour and their response with respect to sales
Regular tracking of generation which helps in increasing the revenue.
Importance of social media on sales figures of the organisation.
Focus on e mail marketing strategies
Also study the competitor analysis considering their strength and weaknesses.
Identify strong and weak products
Optimise the price structure regularly and according to market needs.
In order to achieve the desired sales target, it is important for BIJ to address the above issues so
that they can achieve the goals and objectives for the organisation (Joshi, 2019).
The Key performance indicators in the bangles industry can be, growth in revenue, revenue
received by the entity on per client basis, the profit margin, client retention rate and customer
satisfaction. They can be explained as under: -
Growth in revenue: - There are variety of bangles in the market such as plastic, metal,
wood, glass etc. The organisation has to first decide what types of bangles they have to
sell so that they can control the market accordingly because they change according to
season, festivals and trends.
⊘ This is a preview!⊘
Do you want full access?
Subscribe today to unlock all pages.
Trusted by 1+ million students worldwide
Revenue received on per client basis: - This can be addressed on the basis of the through
study with respect to nature of client and their behaviour considering bangles (Kivimäki
and Meriluoto, 2018). The age group of the customer also plays the major role in
improving the sales of the organisation.
Profit margin: - The profit margin for bangles makers and seller can vary widely
particularly given the numerous categories within the industry. Labour cost as well as
market prices for variety of bangles have a significant impact of the final price of
bangles.
Client retention rate: - It plays a very crucial role in the success of any organisation.
Client retention rate depends upon what price an entity is charging and what quality of
bangles they are providing to their customer. Generally, the retention rate of 80% or more
is considered to be good.
If these above indicators are addressed properly then BIJ revenue can increased in the future run
and this will create stability in the business.
Data qualities issues and their remedies
Challenges for the data analytics are as under: -
The amount of data being collected: - With today data driver enterprise and the
introduction of big data, risk managers and other employees are stunned with the amount
of data that is collected. There is a need for a data system automatically collects and
organise the information in a structured and systematic way (Othman, Ghafar and Choon,
2021).
Collecting real time data: - With the huge amount of data available it is difficult to dig
down and access the visions that are needed most of the times. If the manually scrutinise
through data, it can be possible to gain real time understandings on what is currently
happening.
Visual representation of data: - For the data to be understood and impactful to the users of
such data, such data needs to be visually presented in graphs and charts. Taking the time
to pull the data from multiple resources and put them into a reporting method is take lots
of time which makes them frustrating and disturbing.
Paraphrase This Document
Need a fresh take? Get an instant paraphrase of this document with our AI Paraphraser
Data from multiple sources: - The next issue is trying to analyse and organize data at one
place which is gathered from different sources. Sometimes the employees of the
organisation may not understand this which leads to incomplete and inaccurate analysis
(Shelton-Davis, 2018). Manually combining the huge data is time consuming and it limits
perceptions to what is simply observed.
Pressure from the top management: - As risk management is more famous in the
organisations, the top management of the organisation demands more results from the
persons who handles risk management in the organisation. They expect from the
employee the higher and regular returns and large number of reports to be submitted on
all types of data.
These problems can be addressed by BIJ with a systematic approach by the following ways: -
Fix the data in the data in source system: - Data quality issues can be addressed by
cleaning up the original source in the regular course of interval. This is needed because
incomplete or incorrect source data will make the database corrupted and it will product
low quality results as well. Fixing the data is the source system is the best way to ensure
better customer experience.
Fix the source system to correct the data problems: - It sometimes sound like the above
method but it completely different. It signifies that the source system that is responsible
for collecting the data can be set up automatically cleanse the data before it gets enters
into the database (Stratton, 2020). It is generally preferred where source system needs to
set up properly whether it is website or otherwise.
Implement precision identity: - This is the most difficult method of fixing the qualities
issues but simultaneously the most powerful method. One of the most important issues is
that many customer database has multiple records for the single customers and further
this information are not correlated with each other in proper sequence.
Data Analysis and Commentary
Table A
Table1: It describes the sales of different product in 2018 in Japan, UK and USA.
2018 Japan UK USA
Months Sales Sales Sales Sales Sales Sales
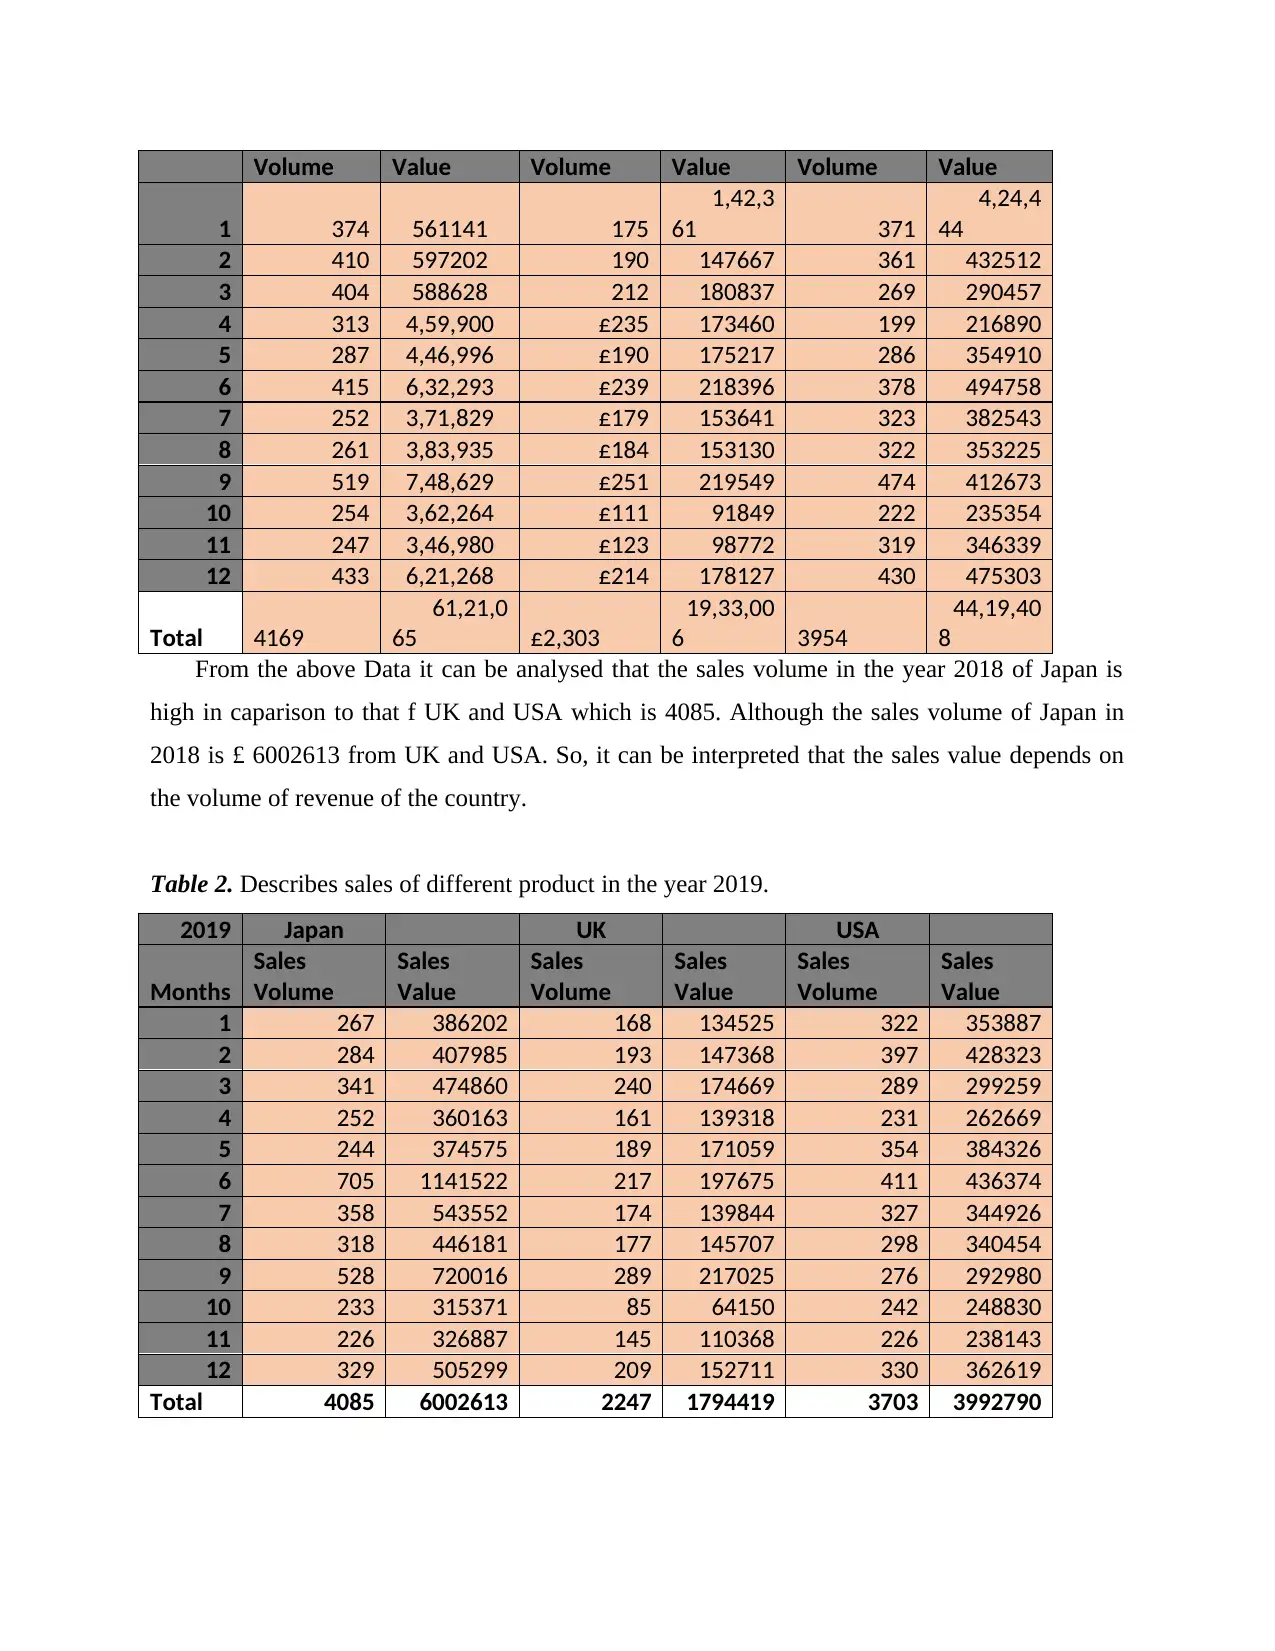
Volume Value Volume Value Volume Value
1 374 561141 175
1,42,3
61 371
4,24,4
44
2 410 597202 190 147667 361 432512
3 404 588628 212 180837 269 290457
4 313 4,59,900 £235 173460 199 216890
5 287 4,46,996 £190 175217 286 354910
6 415 6,32,293 £239 218396 378 494758
7 252 3,71,829 £179 153641 323 382543
8 261 3,83,935 £184 153130 322 353225
9 519 7,48,629 £251 219549 474 412673
10 254 3,62,264 £111 91849 222 235354
11 247 3,46,980 £123 98772 319 346339
12 433 6,21,268 £214 178127 430 475303
Total 4169
61,21,0
65 £2,303
19,33,00
6 3954
44,19,40
8
From the above Data it can be analysed that the sales volume in the year 2018 of Japan is
high in caparison to that f UK and USA which is 4085. Although the sales volume of Japan in
2018 is £ 6002613 from UK and USA. So, it can be interpreted that the sales value depends on
the volume of revenue of the country.
Table 2. Describes sales of different product in the year 2019.
2019 Japan UK USA
Months
Sales
Volume
Sales
Value
Sales
Volume
Sales
Value
Sales
Volume
Sales
Value
1 267 386202 168 134525 322 353887
2 284 407985 193 147368 397 428323
3 341 474860 240 174669 289 299259
4 252 360163 161 139318 231 262669
5 244 374575 189 171059 354 384326
6 705 1141522 217 197675 411 436374
7 358 543552 174 139844 327 344926
8 318 446181 177 145707 298 340454
9 528 720016 289 217025 276 292980
10 233 315371 85 64150 242 248830
11 226 326887 145 110368 226 238143
12 329 505299 209 152711 330 362619
Total 4085 6002613 2247 1794419 3703 3992790
⊘ This is a preview!⊘
Do you want full access?
Subscribe today to unlock all pages.
Trusted by 1+ million students worldwide
In 2019, it can have interpreted from the above table that the sale value is fluctuating every
month with the deviation in the value of sales. It can be analysed that the maximum sales value is
of Japan from UK and USA of the BIJ data sets.
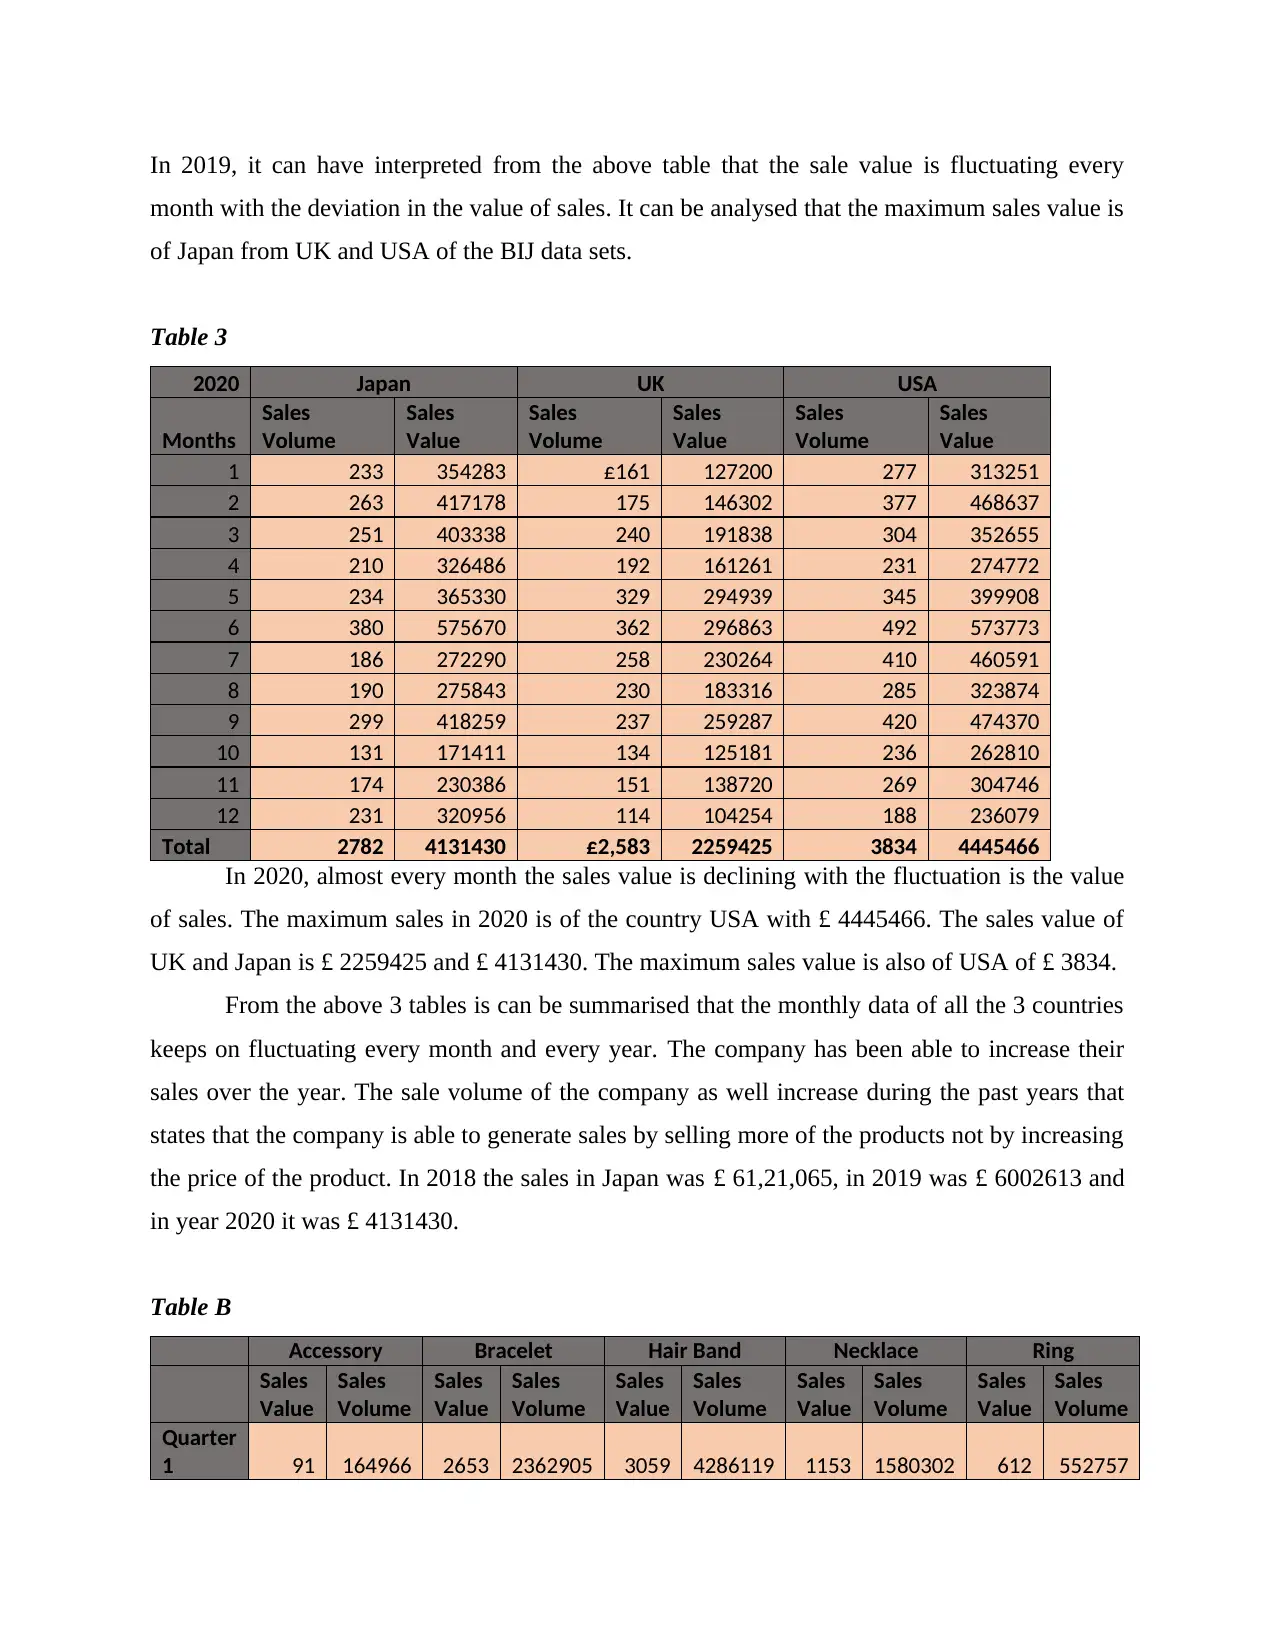
Table 3
2020 Japan UK USA
Months
Sales
Volume
Sales
Value
Sales
Volume
Sales
Value
Sales
Volume
Sales
Value
1 233 354283 £161 127200 277 313251
2 263 417178 175 146302 377 468637
3 251 403338 240 191838 304 352655
4 210 326486 192 161261 231 274772
5 234 365330 329 294939 345 399908
6 380 575670 362 296863 492 573773
7 186 272290 258 230264 410 460591
8 190 275843 230 183316 285 323874
9 299 418259 237 259287 420 474370
10 131 171411 134 125181 236 262810
11 174 230386 151 138720 269 304746
12 231 320956 114 104254 188 236079
Total 2782 4131430 £2,583 2259425 3834 4445466
In 2020, almost every month the sales value is declining with the fluctuation is the value
of sales. The maximum sales in 2020 is of the country USA with £ 4445466. The sales value of
UK and Japan is £ 2259425 and £ 4131430. The maximum sales value is also of USA of £ 3834.
From the above 3 tables is can be summarised that the monthly data of all the 3 countries
keeps on fluctuating every month and every year. The company has been able to increase their
sales over the year. The sale volume of the company as well increase during the past years that
states that the company is able to generate sales by selling more of the products not by increasing
the price of the product. In 2018 the sales in Japan was £ 61,21,065, in 2019 was £ 6002613 and
in year 2020 it was £ 4131430.
Table B
Accessory Bracelet Hair Band Necklace Ring
Sales
Value
Sales
Volume
Sales
Value
Sales
Volume
Sales
Value
Sales
Volume
Sales
Value
Sales
Volume
Sales
Value
Sales
Volume
Quarter
1 91 164966 2653 2362905 3059 4286119 1153 1580302 612 552757
month with the deviation in the value of sales. It can be analysed that the maximum sales value is
of Japan from UK and USA of the BIJ data sets.
Table 3
2020 Japan UK USA
Months
Sales
Volume
Sales
Value
Sales
Volume
Sales
Value
Sales
Volume
Sales
Value
1 233 354283 £161 127200 277 313251
2 263 417178 175 146302 377 468637
3 251 403338 240 191838 304 352655
4 210 326486 192 161261 231 274772
5 234 365330 329 294939 345 399908
6 380 575670 362 296863 492 573773
7 186 272290 258 230264 410 460591
8 190 275843 230 183316 285 323874
9 299 418259 237 259287 420 474370
10 131 171411 134 125181 236 262810
11 174 230386 151 138720 269 304746
12 231 320956 114 104254 188 236079
Total 2782 4131430 £2,583 2259425 3834 4445466
In 2020, almost every month the sales value is declining with the fluctuation is the value
of sales. The maximum sales in 2020 is of the country USA with £ 4445466. The sales value of
UK and Japan is £ 2259425 and £ 4131430. The maximum sales value is also of USA of £ 3834.
From the above 3 tables is can be summarised that the monthly data of all the 3 countries
keeps on fluctuating every month and every year. The company has been able to increase their
sales over the year. The sale volume of the company as well increase during the past years that
states that the company is able to generate sales by selling more of the products not by increasing
the price of the product. In 2018 the sales in Japan was £ 61,21,065, in 2019 was £ 6002613 and
in year 2020 it was £ 4131430.
Table B
Accessory Bracelet Hair Band Necklace Ring
Sales
Value
Sales
Volume
Sales
Value
Sales
Volume
Sales
Value
Sales
Volume
Sales
Value
Sales
Volume
Sales
Value
Sales
Volume
Quarter
1 91 164966 2653 2362905 3059 4286119 1153 1580302 612 552757
Paraphrase This Document
Need a fresh take? Get an instant paraphrase of this document with our AI Paraphraser
Quarter
2 150 275420 3080 2823257 3149 4614890 1146 1652064 555 543872
Quarter
3 206 364073 3096 2913346 2088 3927840 1031 1402469 704 660206
Quarter
4 127 235340 2220 1999015 2490 3316036 696 989647 473 436134
From the table B it can be evaluated that the sales value of accessory, necklace, bracelet,
hairband and ring is 91, 1153, 2653, 3059, and 612 of quarter 1. It can be analysed that ye
maximum sakes value is of necklace in the BIJ jewellery but can be interpreted that in quarter 3
it shows a major downfall of only 2088 sales value.
Japan UK USA
Year
Sales
Volume
Sales
Value
Sales
Volume
Sales
Value
Sales
Volume
Sales
Value
2018 4169 6121065 2303 1933006 3954 4413408
2019 4085 6002613 £2,247 1794419 3703 3992790
2020 2782 4131430 2583 2259425 3834 4445466
Analysis: The above chart explains total sales of the year 2018, 2019 and 2020
respectively. It states that the overall sales of the company increased over the year and there is a
continuous increase in the sales in respective years. In Japan in year 2018 sales was £ 6121065 in
year 2019 sales was £ 2124772 and in 2020 it was £ 12249286.
Table C
Japan UK USA
Year
Sales
Volume
Sales
Value
Sales
Volume
Sales
Value
Sales
Volume
Sales
Value
Quarter
1
2018 1188 1746971 570 470865 1001 1147413
2019 892 1269047 601 456562 1008 1081469
2020 747 1174799 576 465340 958 1134543
Quarter
2
2018 1015 1539189 664 567073 863 1066558
2019 1201 1876260 567 508052 996 1083369
2020 824 1267486 883 753063 1068 1248453
Quarter
3
2018 1032 1504393 614 526320 1119 1148441
2019 1204 1709749 551 426882 816 882264
2020 675 966392 725 672867 1115 1258835
Quarter
4
2018 934 1330512 448 368748 971 1056996
2019 788 1147557 439 327229 798 849592
2020 536 722753 399 368155 693 803635
The above table gives an analysis about the sales volume of quarter 3 is more of Japan of
all the years. It can be interpreted that the different quarter of the year has been compared to
analyse the different products on the basis of their quarterly data. The data shows positive change
in the figures over the period of time. The data shows that the sales of the different has increased
over the period of time and shows an incremental growth.
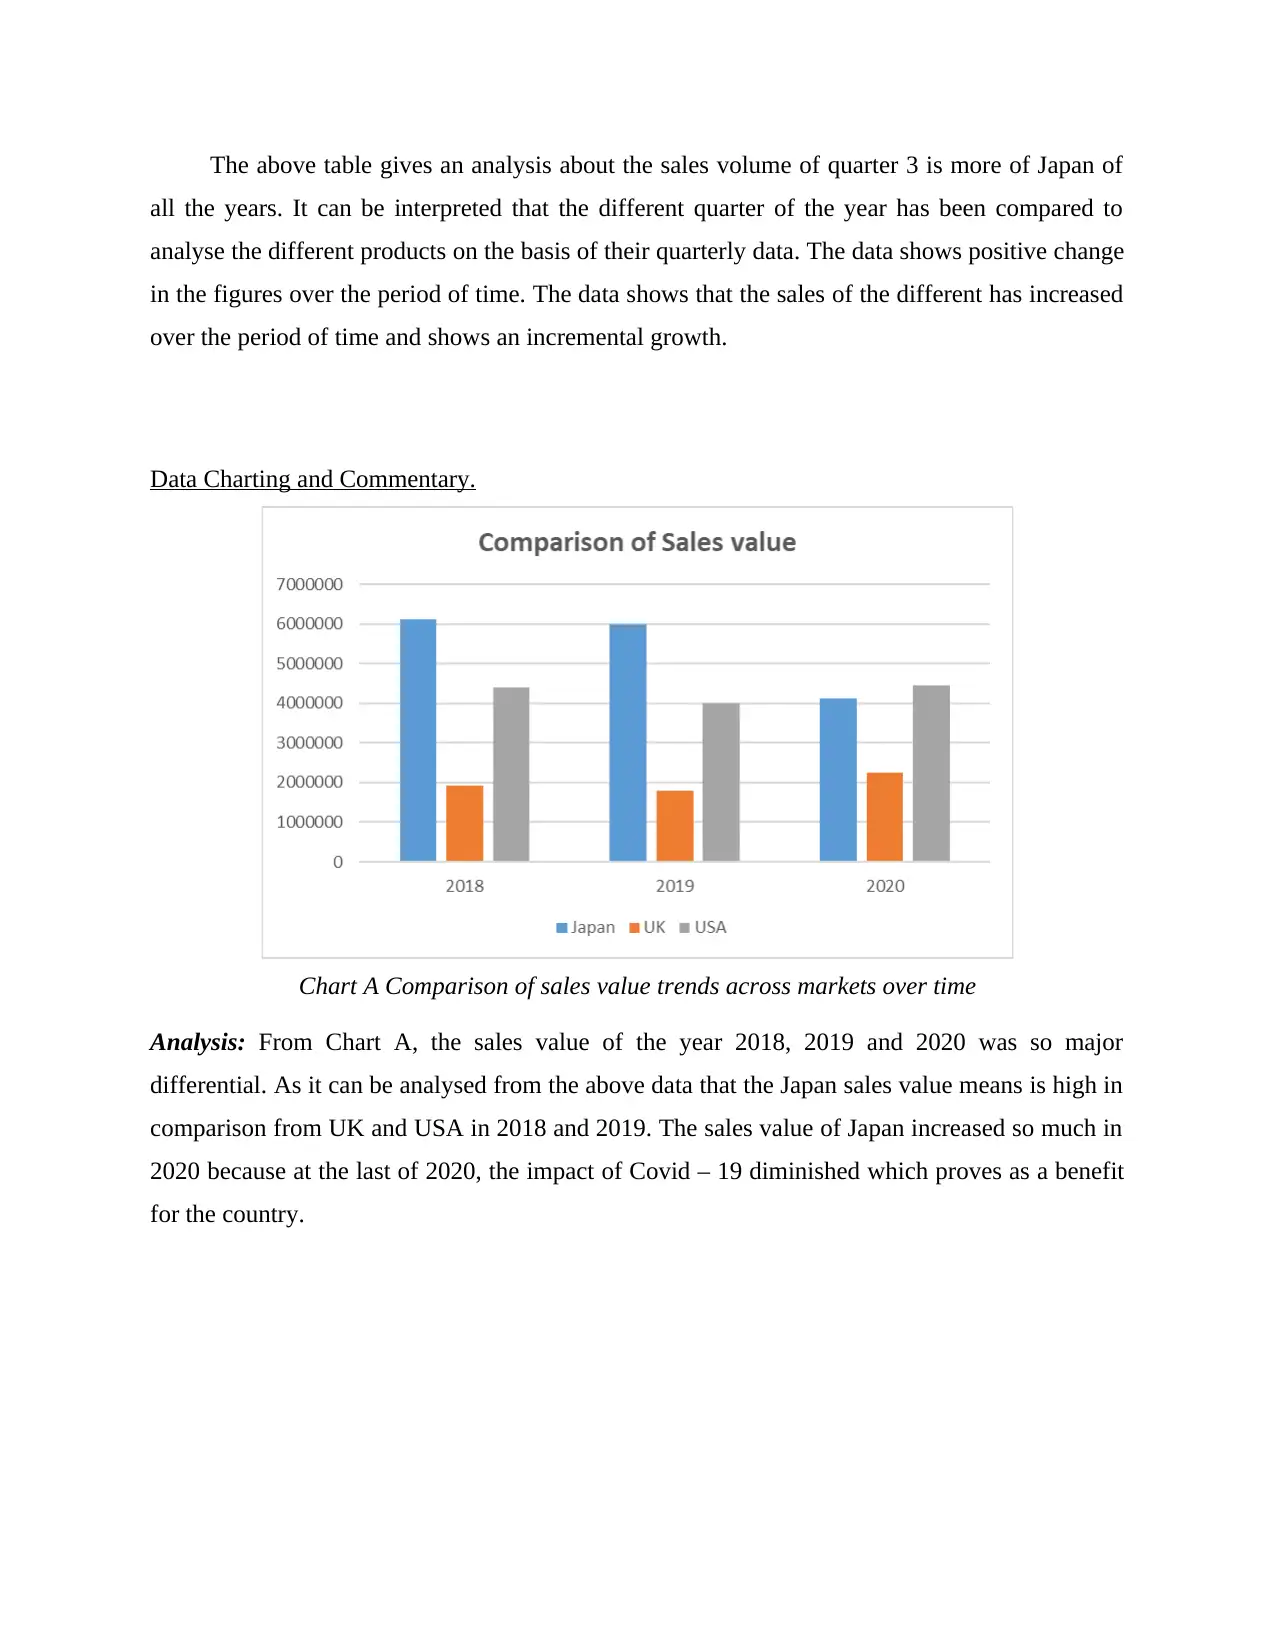
Data Charting and Commentary.
Chart A Comparison of sales value trends across markets over time
Analysis: From Chart A, the sales value of the year 2018, 2019 and 2020 was so major
differential. As it can be analysed from the above data that the Japan sales value means is high in
comparison from UK and USA in 2018 and 2019. The sales value of Japan increased so much in
2020 because at the last of 2020, the impact of Covid – 19 diminished which proves as a benefit
for the country.
all the years. It can be interpreted that the different quarter of the year has been compared to
analyse the different products on the basis of their quarterly data. The data shows positive change
in the figures over the period of time. The data shows that the sales of the different has increased
over the period of time and shows an incremental growth.
Data Charting and Commentary.
Chart A Comparison of sales value trends across markets over time
Analysis: From Chart A, the sales value of the year 2018, 2019 and 2020 was so major
differential. As it can be analysed from the above data that the Japan sales value means is high in
comparison from UK and USA in 2018 and 2019. The sales value of Japan increased so much in
2020 because at the last of 2020, the impact of Covid – 19 diminished which proves as a benefit
for the country.
⊘ This is a preview!⊘
Do you want full access?
Subscribe today to unlock all pages.
Trusted by 1+ million students worldwide
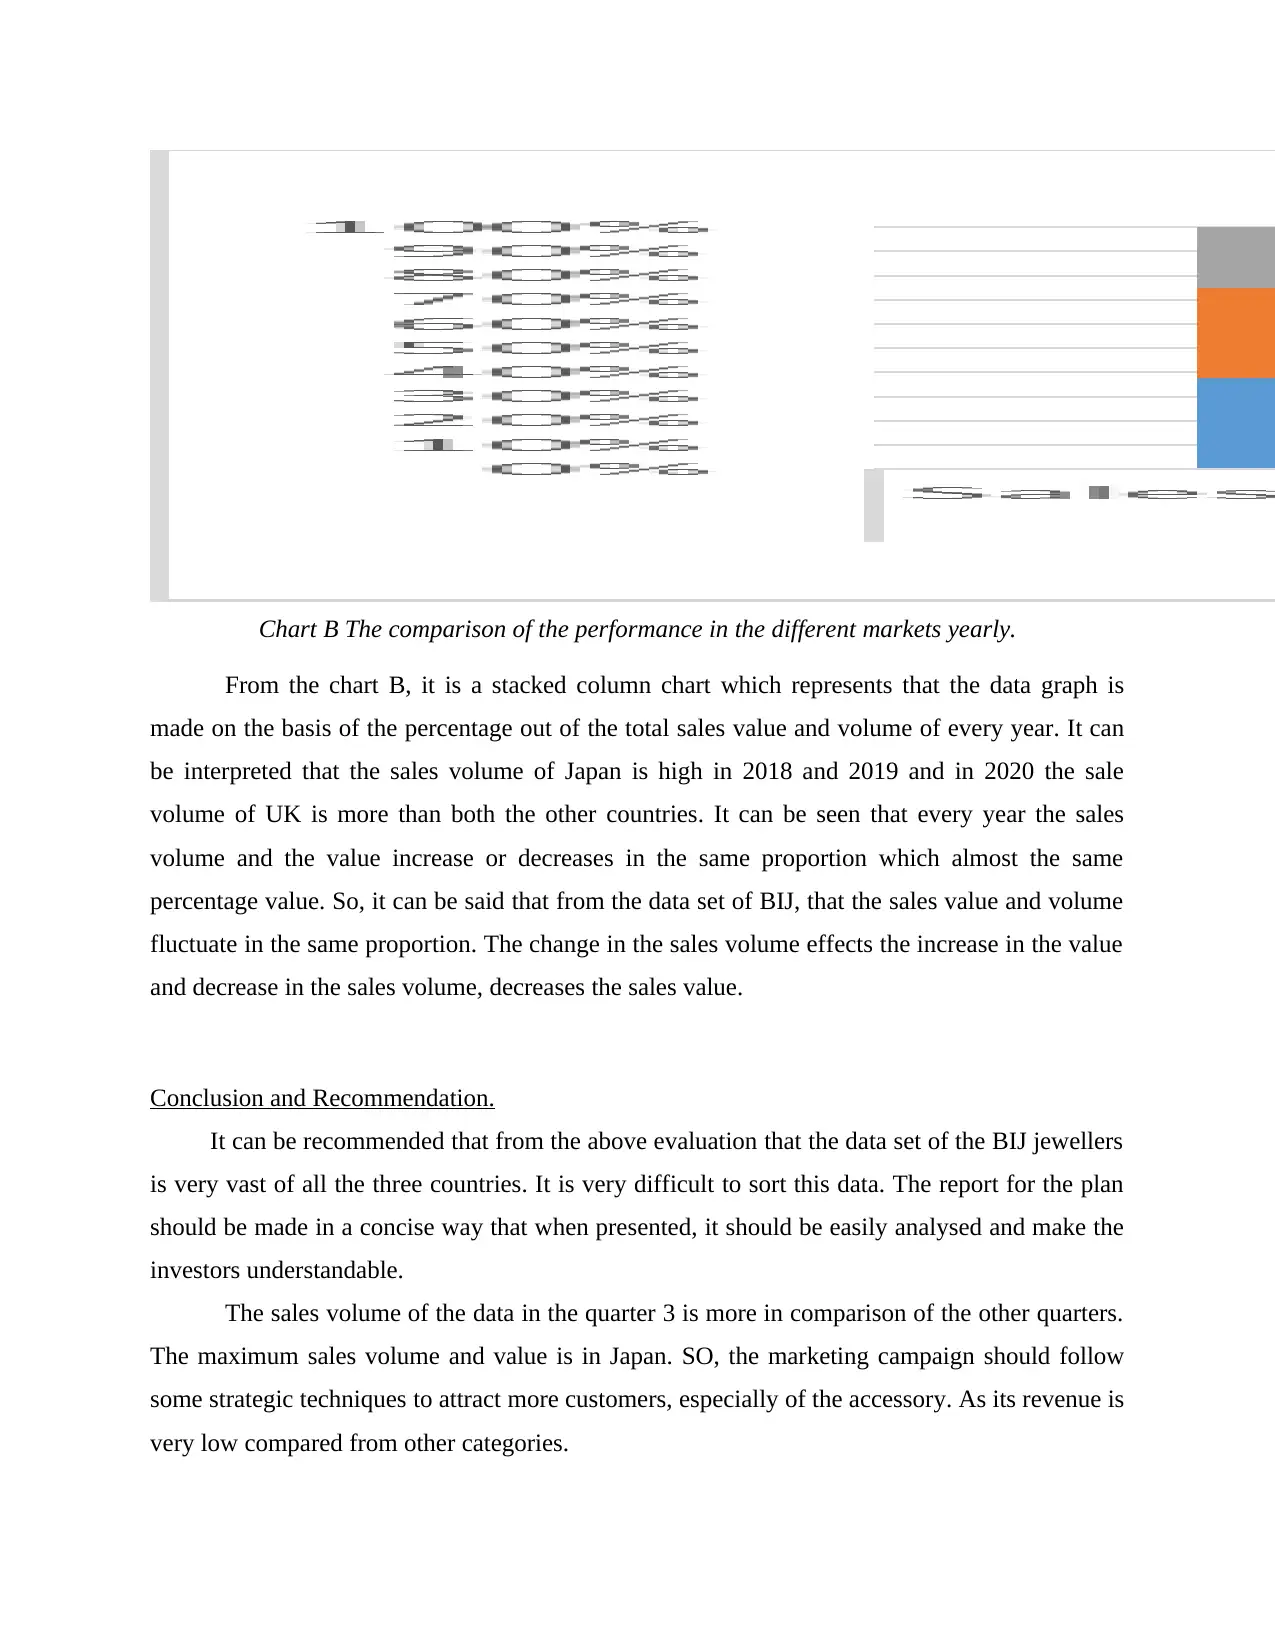
Chart B The comparison of the performance in the different markets yearly.
From the chart B, it is a stacked column chart which represents that the data graph is
made on the basis of the percentage out of the total sales value and volume of every year. It can
be interpreted that the sales volume of Japan is high in 2018 and 2019 and in 2020 the sale
volume of UK is more than both the other countries. It can be seen that every year the sales
volume and the value increase or decreases in the same proportion which almost the same
percentage value. So, it can be said that from the data set of BIJ, that the sales value and volume
fluctuate in the same proportion. The change in the sales volume effects the increase in the value
and decrease in the sales volume, decreases the sales value.
Conclusion and Recommendation.
It can be recommended that from the above evaluation that the data set of the BIJ jewellers
is very vast of all the three countries. It is very difficult to sort this data. The report for the plan
should be made in a concise way that when presented, it should be easily analysed and make the
investors understandable.
The sales volume of the data in the quarter 3 is more in comparison of the other quarters.
The maximum sales volume and value is in Japan. SO, the marketing campaign should follow
some strategic techniques to attract more customers, especially of the accessory. As its revenue is
very low compared from other categories.
Paraphrase This Document
Need a fresh take? Get an instant paraphrase of this document with our AI Paraphraser

The USA is also doing well and better than UK. It means that somehow in UK, there is a
lack of the marketing activities which needs to be sorted fast.
lack of the marketing activities which needs to be sorted fast.

REFERENCES
Huang, et.al. 2019. 100MW class vanadium flow battery project plan in China. ECS
Transactions. 89(1). p.15.
Joshi, J.A., 2019. Generic Project Plan for a Mobile Robotics System.
Kivimäki, V. and Meriluoto, S., 2018. Holistic perspective to individual study plan: Personal
Development Project Plan. In Transforming our world through design, diversity and
education. (pp. 514-526). IOS Press.
Othman, I., Ghafar, N.H.A. and Choon, S.W., 2021, June. The Effectiveness Implementation of
Project Risk Management Plan in Property Development in Malaysia. In Proceedings of the
International Conference on Civil, Offshore and Environmental Engineering. (pp. 663-668).
Springer, Singapore.
Shelton-Davis, C.V., 2018. Preliminary Project Execution Plan for the TREAT LEU Fuel
Conversion Project (No. INL/MIS-18-32556-Rev001). Idaho National Lab.(INL), Idaho
Falls, ID (United States).
Stratton, S.R., 2020. Preconstruction Plan for a Pedestrian Pathway Rehabilitation Project.
van de Kamer, M., 2021. A Training Plan and Manual for an SAP Migration Project at Airbus
Defence and Space.
Wang, H. and Huo, A., 2021. The Design Path of the Project Income Dividend Plan of the State-
owned Technology Enterprise. In E3S Web of Conferences (Vol. 235, p. 03066). EDP
Sciences.
⊘ This is a preview!⊘
Do you want full access?
Subscribe today to unlock all pages.
Trusted by 1+ million students worldwide
1 out of 12
Related Documents


Your All-in-One AI-Powered Toolkit for Academic Success.
+13062052269
info@desklib.com
Available 24*7 on WhatsApp / Email
![[object Object]](/_next/static/media/star-bottom.7253800d.svg)
Unlock your academic potential
Copyright © 2020–2026 A2Z Services. All Rights Reserved. Developed and managed by ZUCOL.