Accounting and Finance: Analyzing Financial Performance of Companies
VerifiedAdded on 2023/06/10
|15
|4187
|393
Report
AI Summary
This report provides a comprehensive analysis of the financial performance, sustainability, and growth of three companies: NWF Group Plc, Fuller Foods International Plc, and Peaty Mills Plc. The analysis includes an evaluation of their financial figures through ratio analysis, comparing their profitability, operational efficiency, and structure ratios. The report assesses both internal and external long-term sources of finance and identifies the best-performing company based on the analysis. Fullers Foods International Plc is identified as the best-performing company due to its higher profit per employee and potential investment opportunities. The report also highlights the importance of maintaining a sound liquidity position and managing capital structure effectively for sustained financial health. Desklib offers similar solved assignments and past papers for students.

Accounting and
Finance for Managers
Finance for Managers
Paraphrase This Document
Need a fresh take? Get an instant paraphrase of this document with our AI Paraphraser
Contents
INTRODUCTION...........................................................................................................................3
SECTION A.....................................................................................................................................3
Question 1........................................................................................................................................3
1 a. Analysis of the financial performance, sustainability, and growth of the company.............3
1 b. Analyse the performance of the companies by evaluating the fiscal ratios through the help
of the charts for supporting the evaluation..................................................................................4
1 c. Justify the reason that how the company is termed as the best performing company..........7
QUESTION 2..................................................................................................................................7
2 a. Evaluate the internal and external long – term sources of finance.......................................7
2 b. Select one – long term finance which will be best suitable for the company.......................8
CONCLUSION................................................................................................................................9
REFERENCES..............................................................................................................................10
APPENDIX....................................................................................................................................12
INTRODUCTION
Accounting plays the significant role for the business enterprise as it shows the profits or
losses that has been earned by the business throughout the year. Therefore, it is important for
every business to carry out their accounts in the smooth manner so that adequate results for the
performance of the business could be judged accordingly. In this report the financial
performance of three different company is being evaluated on the basis of their financial figures.
These companies are being NWF Group Plc, Fuller foods international Plc, and Peaty mills Plc.
Their performance is being judged by conducting ratio analysis of all the company performance
for the respective years and ranking will be given from the worst to the best amongst them.
SECTION A
Question 1
1 a. Analysis of the financial performance, sustainability, and growth of the company.
NWF Group Plc
Revenue from operations has increased by USD 2746, profit has significantly increased in the
year 2020 but declined in 2019 organizational capacity indicated by stock turnover ratio
increased by 27% while the net asset turnover ratio has declined. Overall assets of the company
have increased. The Balance Sheet data is of 10 years which shows the ups and downs of the
company. In those number of years, it can be seen that the company has grown at a pace but have
also gone down. There has been many ups and downs in the financial position of the business.
Company has also increased its Fixed asset of the company; liabilities of the company has also
increased which suggests that the company’s profits will be lowered over the period of time.
Sales of the company have remained approximately the same which was before 10 years which
means that the growth of the company has not been remarkable. Tax liability of the company has
also increased during last few years. Company has shown a significant change in the profits of
the company and is in profit from last 10 years. Profit margin of the company has increased
which was 1.64 in 2011 and which has increased to 1.75 in the preceding years. Market Capital
by Cash flow from operation is a ratio which measure the valuation of stock related to the price
of the operating cash flow. This ratio considers the non-cash expenses of the firm such as
depreciation and amortization of the net income. It is mainly where the organisations are in
⊘ This is a preview!⊘
Do you want full access?
Subscribe today to unlock all pages.
Trusted by 1+ million students worldwide
positive cash flows. It suggests that the company has maximum amount of stock in year 2020
which has reduced to more than 1/3 in the next year.
Fullers Foods International Plc
By looking at the revenue from operations we can see that the revenue has been continuously
falling since 2018 by 7.038%. The per employee revenue has fallen from 8625 to 7110 which
shows that the productivity of the company has been falling. In the case of the following
company the Fixed Asset of the company has decreased from 1686258 in the year 2011 which
has decreased to 489118 in the year 2011. The overall assets of the company have also decreased
in the long run which can be seen from the total assets of the company. Revenue of the company
has increased to almost double which was 224906243 in the year 2011 which has increased to
376839244 in the year 2021 which shows that company has performed exceptionally well in the
following time period. It can be seen that the per person profit of the company has increased
from 54 in the year 2011 to 243 in the year 2021 which shows that the performance of the
organisation have improved in the recent time.
Peaty Mills Plc.
Fixed Assets of the company has reduced of the company which shows the company has sold its
most of the fixed assets. Cash and Cash equivalent of the company has increased to 815919
which is almost double of the total cash and cash equivalent of the company in the year 2021.
Operating turnover of the company has reduced which was in the year 2011 which means the
efficiency of the company has reduced which has declined the sales of the company. The
organisation has earned a significant number of profits but per employee expense is less as
compared with the earning of the company. Average cost per employee of the company has also
increased in the company.
1 b. Analyse the performance of the companies by evaluating the fiscal ratios through the help of
the charts for supporting the evaluation.
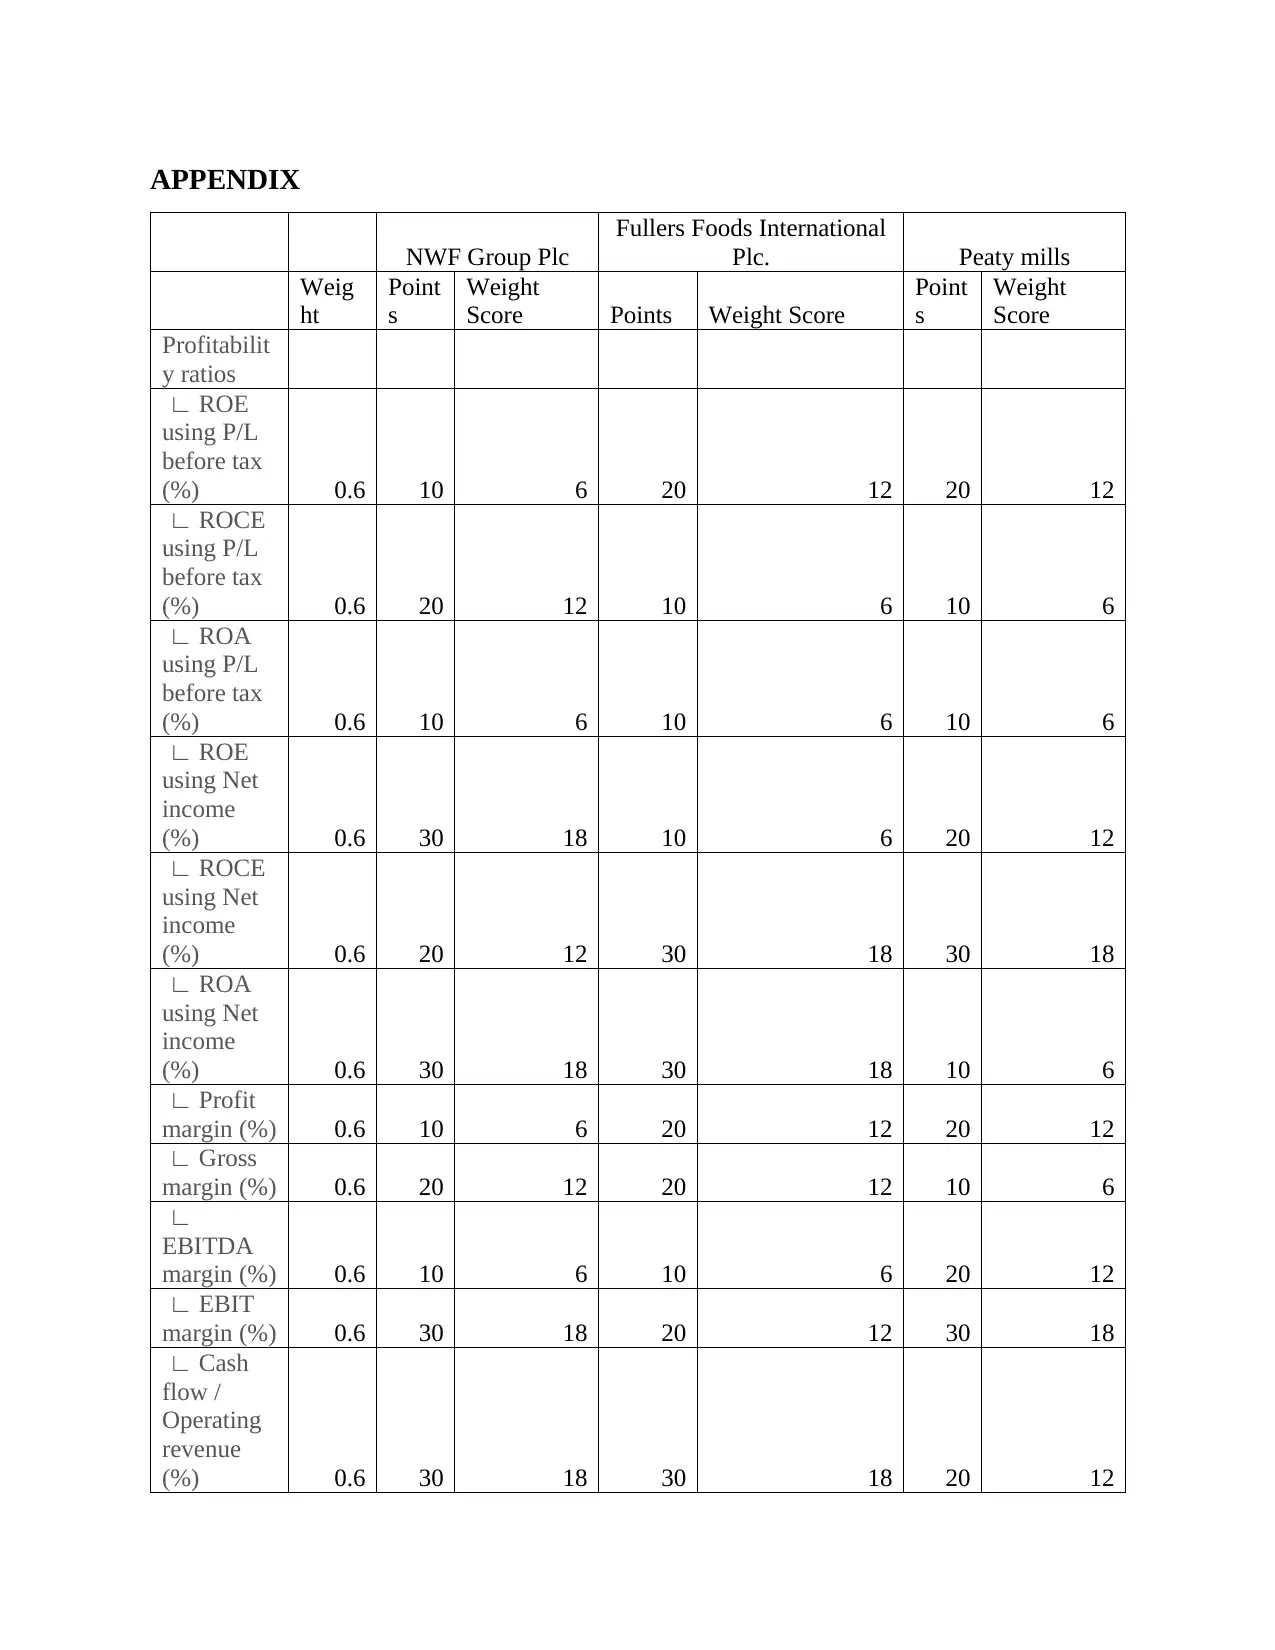
Profitability Ratio: The profitability position of the company NWF is that shows that the overall
the company’s profit has been inclined if compared from the year 2018 and 2019 in the year
2020. The ROCE before tax has been declined by approximately 1.5 from the year 2018 in 2020.
which has reduced to more than 1/3 in the next year.
Fullers Foods International Plc
By looking at the revenue from operations we can see that the revenue has been continuously
falling since 2018 by 7.038%. The per employee revenue has fallen from 8625 to 7110 which
shows that the productivity of the company has been falling. In the case of the following
company the Fixed Asset of the company has decreased from 1686258 in the year 2011 which
has decreased to 489118 in the year 2011. The overall assets of the company have also decreased
in the long run which can be seen from the total assets of the company. Revenue of the company
has increased to almost double which was 224906243 in the year 2011 which has increased to
376839244 in the year 2021 which shows that company has performed exceptionally well in the
following time period. It can be seen that the per person profit of the company has increased
from 54 in the year 2011 to 243 in the year 2021 which shows that the performance of the
organisation have improved in the recent time.
Peaty Mills Plc.
Fixed Assets of the company has reduced of the company which shows the company has sold its
most of the fixed assets. Cash and Cash equivalent of the company has increased to 815919
which is almost double of the total cash and cash equivalent of the company in the year 2021.
Operating turnover of the company has reduced which was in the year 2011 which means the
efficiency of the company has reduced which has declined the sales of the company. The
organisation has earned a significant number of profits but per employee expense is less as
compared with the earning of the company. Average cost per employee of the company has also
increased in the company.
1 b. Analyse the performance of the companies by evaluating the fiscal ratios through the help of
the charts for supporting the evaluation.
Profitability Ratio: The profitability position of the company NWF is that shows that the overall
the company’s profit has been inclined if compared from the year 2018 and 2019 in the year
2020. The ROCE before tax has been declined by approximately 1.5 from the year 2018 in 2020.
Paraphrase This Document
Need a fresh take? Get an instant paraphrase of this document with our AI Paraphraser
The profit margin of it has also been inclined from 1.59 in 2018 to 1.75 in 2020. The EBIDTA
margin % has also inclined by around 1% in 2020 from 2018.
Moreover, the organisation Fullers Food has been also good. It ROCE is over 100%
which is extremely good in terms of the performance and productivity of the business entity. The
profit margin incurs only 3.42% in 2020 and in 2018 it was 2.86% only. The EBIDTA margin %
is also less which is only 3.43 in the year 2020. The cash flow or the operating revenue % of the
company has been increased to 2.67 in 2020, in 2019 it was only 1.43 and in 2018 it was 2.27.
The profitability ratios of the company Peaty Mills is on an average. The ROCE before
tax is 14.43 in 2020 and in 2018 it was 17.63. So from comparing, it can have been declined and
the reason behind it can be that the position of Covid has impacted widely from the financial
perspective as well. The profit margin, EBIDTA and the operating revenue % all have been
declining which means that overall, the business entity’s financial position has been diminished
and it should be recovered for sustaining in the marketplace.
Operational ratios
NWF Group Plc Company’s net asset turnover ratio has decreased over the period of last
3 years it can be seen that the company is not able to generate enough number of profits from the
assets of the company. Credit period of the company has also reduced to 24 days which means
that the company now have to pay the sum more quickly than before. Collection period of the
company has decreased which suggests the company is performing well in the recovering the
amount from its creditors. There is no data available of the Research and development of the
company.
Fullers Foods International Plc’s Net Assets turnover ratio of the company has reduced
over the period of last 3 years which shows that the company is not able to generate enough
amount of money from the asset thar are being employed by them in the business. It is necessary
for Fullers foods to effectively and efficiently utilise their resources so that revenue could be
jumped accordingly.
Peaty Mills Plc’s It has been observed from the operational ratio that the debtor collation
period will be arrived to 36 days in current year as compare to previous years which is around 50
days approx. from 2011. This shows that company is working on maintaining their liquidity
position and try to contribute their working capital as well. Their interest coverage ratio has
improved in the current year when compare to past year that shows that they are providing
sufficient security to the debt holders that their funds are being safe in the company and they can
easily invest in them. Other ratio such as stock turnover, export revenue is significantly
maintained at the constant level over the period of all the years that are being mentioned.
Structure Ratio: NWF Group Plc’s current ratio of the company has been 1 times on an average
from 2011 to 2020 which indicates that the liquidity is not sound enough that needs to be for
NWF group. The ideal current ratio for most of the organisation are being 2:1 and it is important
for them to reach at least to the ideal. The gearing ratio has been 124.07% in 2020 as compare to
2019 which is 72.61% that shows that company has been financed more through debt as compare
to equity. The higher the amount of debt the higher an entity will get risky and fixed interest cost
will become the fixed cost for them. Therefore, it is necessary for NWF group to revise their
capital structure by incorporating more equity on it. There is a reduction in solvency ratio which
is based on the assets that is 3% less then the previous year that needs to be highly monitor so
that sound solvency could be maintained by the entity.
Fullers Foods International Plc’s current ratio is 1.25 times on an average for the fullers’
foods which is quite better as they are not in the PAR position and capable enough to repay their
current liability as and when needed from the assets they hold in their business. By seeing the
gearing ratio, it has been observed that the company has mostly financed by the equity therefore
they do not have much risk in their capital structure and fixed interest cost will be lower as well.
Peaty Mills Plc’s current ratio, the position of Peaty Mills is being better as they are holding the
average current ratio around 1.50 times which is better as compare to both the companies and it
simply shows that their liquidity position is sound enough to meet out their short term
commitments occurred in the financial year.
Non – financial Ratio: Per employee ratios
NWF Group Plc:
The profit per employee has been improved for the company in the current year compare to
previous year and it shows that company is focussing on contributing more and more profit
distribution to each of its workers.
Fullers Foods International Plc:
⊘ This is a preview!⊘
Do you want full access?
Subscribe today to unlock all pages.
Trusted by 1+ million students worldwide
The fullers’ profits per employee is higher as compare to NWF Group which is on an average
220 per employee that shows their working style and dedication towards their staff and
management.
Peaty Mills Plc:
The Peaty Mills has similar contribution that has been seen by NWF group and therefore both of
them needs to improve in terms of welfare for their employees.
Ranking:
On the basis of above analysis, it has been concluded that when ranking has been made from first
to worst the following order are being comes in order as mentioned below:
1. Foolers Foods
2. NWF
3. Peaty Mills
1 c. Justify the reason that how the company is termed as the best performing company.
Based on the consequences of the ratio analysis, it has seen that Fullers Food is a best-
performing organization when contrasted with NWF Plc and Peaty Mills as this multitude of
three organizations are of food industry organizations. Fullers Food is considered as certain
venture open doors in the future because of different reasons are given underneath:
Higher profit per portion of the organization open up the way for expanding the stock
profits from the London stock trade to benefit the market unpredictability.
Expanding net gain is used in putting resources into various wellsprings of ventures.
QUESTION 2
2 a. Evaluate the internal and external long – term sources of finance.
To perform the different types of business activities and to keep the business going, it needs
certain amount of money that fulfils all the needs and requirements of the business. If the finance
with the business is not enough it can either lose out on new opportunities or can fail to crate the
desired output. Sometimes the capital in the business is not enough and hence it needs to
generate finances from different sources. The sources can either be internal or external
Paraphrase This Document
Need a fresh take? Get an instant paraphrase of this document with our AI Paraphraser
depending upon the needs of the business. The internal sources include those that are generated
within the business and external are the ones that are brought in from the outside sources.
Internal sources of finance: It refer to those sources that are generated within the business from
its already established activities, occupied assets or from the day to day activities of the business.
It comprises of sale of stocks, fixed assets, debts collected and retained earnings. The cost of
acquiring internal finances is low as it doesn't include any collateral or cost of acquisition hence
these can be very economical for the business. But the amount raised with this source is
comparatively lower than that which is acquired through the external sources and that is the
reason why the use of the funds through internal sources are limited to only few uses.
External sources of finance: These are those sources that are outside the reach and capacity of
the business. The cash flows generated through the sources outside the organisation are termed
as external sources. It includes loans from financial institutions, public deposits, trade credits,
lease financing. The cost of acquiring funds through external sources is quite high and expensive
as the sources are outside the capacity of the business. The amount raised through the external
funds can be used in various ways as the amount generated is more than that in internal sourcing
hence it can be put to various uses. In external sources, there is a collateral that is required from
the business raising the finances as the amount generated is huge and hence it requires some
amount of security and assurance.
Justification: According to the ratios and the sustainability position of the company Fullers
Food, it can be assessed that in all the three company’s the monetary position and the growth
opportunity is more to this best ranked organisation.
2 b. Select one – long term finance which will be best suitable for the company.
They are called as internal source of finance because they are the profits that were kept
aside. This happening is also called as 'ploughing back of profits'. They are the left-over amount
after paying dividends and drawings done by the owner.
It affects the interests of existing stakeholders by:
Retained earnings is a long-term source of finance as there is no maturity period involved
unlike loans.
There is no additive equity to be issued so there is no weakening of ownership and
control of the enterprise.
There are no fixed obligations like interest payment or instalments to be paid. Hence, it
may increase your future earnings.
They are cost effective as there is no issue cost involved which is around 2-3%.
When funded through retained earnings, IRR is better than ROI of the business, it will
have an optimistic impact on shareholder's wealth thus accomplishing the objective of
management.
As the funds are yielded internally, there is more operational immunity and adaptability.
It heightens the ability of the company to take care of the unexpected expenses like
lawsuit or losses.
It may increase the market price of the shares.
Retained earnings is fast and flexible. There are no restrictions on the use of the money.
The money can be used for mergers and acquisition which upgrades business potency.
They are cheap, the effective 'cost of capital' is the opportunity cost for shareholders.
CONCLUSION
Accounting performs the substantial function for the commercial enterprise agency because
it indicates the income or losses that has been earned via way of means of the commercial
enterprise at some stage in the year. Therefore, it's far vital for each commercial enterprise to
perform their money owed withinside the easy way in order that ok effects for the overall
performance of the commercial enterprise will be judged accordingly. In this file the economic
overall performance of 3 special employers is being evaluated on the premise in their economic
figures. These corporations are being NWF Group Plc, Fuller ingredients worldwide Plc, and
Peaty Mills Plc. Their overall performance is being judged via way of means of accomplishing
ratio evaluation of all of the employer overall performance for the respective years and rating
may be given from the worst to the pleasant among them.
⊘ This is a preview!⊘
Do you want full access?
Subscribe today to unlock all pages.
Trusted by 1+ million students worldwide
REFERENCES
Books and Journals
Li, R., Li, N., Li, J. and Wu, C., 2018. Short selling, margin buying and stock return in China
market.Accounting & Finance,58(2). pp.477-501.
Moon, J.S. and Wood, D.A., 2020. Research initiatives in accounting education: Research
relevance and research productivity.Issues in Accounting Education,35(4).pp.111-124
Petratos, P. and Faccia, A., 2019, August. Accounting information systems and system of
systems: Assessing security with attack surface methodology. In Proceedings of the
2019 3rd International Conference on Cloud and Big Data Computing(pp. 100-105).
Prescott, G.L. and Vann, C.E., 2018. Implications of clawback adoption in executive
compensation contracts: a survey of recent research.Journal of Corporate Accounting &
Finance.29(1).pp.59-68.
Suprunova, E., 2018. Transformation of new types accounting in the context of globalization and
digitalization of the economy.nternational Accounting.21(8). pp.870-886.
Taschner, A. and Charifzadeh, M., 2020. Management accounting in supply chains–what we
know and what we teach. Journal of Accounting & Organizational Change.
Wells, K., 2020. Who manages the firm matters: The incremental effect of individual managers
on accounting quality.The Accounting Review.95(2). pp.365-384.
Ziegler, T.,and et.al., 2021. The global alternative finance market benchmarking report.Available
at SSRN 3771509.
Angel, K., Menéndez-Plans, C. and Orgaz-Guerrero, N., 2018. Risk management: Comparative
analysis of systematic risk and effect of the financial crisis on US tourism industry:
Panel data research. International Journal of Contemporary Hospitality Management.
Campisi, D and et.al., 2019. Efficiency assessment of knowledge intensive business services
industry in Italy: Data envelopment analysis (DEA) and financial ratio
analysis. Measuring Business Excellence.
Chang, H.Y. and Ma, C.A., 2018. Financial flexibility, managerial efficiency and firm life cycle
on firm performance: An empirical analysis of Chinese listed firms. Journal of
Advances in Management Research.
de Oliveira, I.S., 2018. The governance of the financial action task force: an analysis of power
and influence throughout the years. Crime, Law and Social Change. 69(2). pp.153-172.
Paraphrase This Document
Need a fresh take? Get an instant paraphrase of this document with our AI Paraphraser
He, J., Shang, P. and Xiong, H., 2018. Multidimensional scaling analysis of financial time series
based on modified cross-sample entropy methods. Physica A: Statistical Mechanics and
its Applications. 500. pp.210-221.
Krystalli, R., Hawkins, A. and Wilson, K., 2018. ‘I followed the flood’: A gender analysis of the
moral and financial economies of forced migration. Disasters. 42. pp.S17-S39.
Lewinson, E., 2020. Python for Finance Cookbook: Over 50 recipes for applying modern Python
libraries to financial data analysis. Packt Publishing Ltd.
(Li and et.al., 2018) (Moon, and Wood, 2020) (Petratos, P. and Faccia, 2019) (Prescott, and
Vann, 2018) (Suprunova, 2018) (Taschner, and Charifzadeh, 2020) (Wells, 2020)
(Ziegler and et.al., 2021) (Wu, Shang and Li, 2018) (Tang, Pan and Yao, 2018) (Shijia
and et.al., 2018) (Shartava and et.al., 2019) (Rani and Kumar, 2018) (Navarro and et.al.,
2018) (Mmari and Thinyane, 2019)
APPENDIX
NWF Group Plc
Fullers Foods International
Plc. Peaty mills
Weig
ht
Point
s
Weight
Score Points Weight Score
Point
s
Weight
Score
Profitabilit
y ratios
∟ ROE
using P/L
before tax
(%) 0.6 10 6 20 12 20 12
∟ ROCE
using P/L
before tax
(%) 0.6 20 12 10 6 10 6
∟ ROA
using P/L
before tax
(%) 0.6 10 6 10 6 10 6
∟ ROE
using Net
income
(%) 0.6 30 18 10 6 20 12
∟ ROCE
using Net
income
(%) 0.6 20 12 30 18 30 18
∟ ROA
using Net
income
(%) 0.6 30 18 30 18 10 6
∟ Profit
margin (%) 0.6 10 6 20 12 20 12
∟ Gross
margin (%) 0.6 20 12 20 12 10 6
∟
EBITDA
margin (%) 0.6 10 6 10 6 20 12
∟ EBIT
margin (%) 0.6 30 18 20 12 30 18
∟ Cash
flow /
Operating
revenue
(%) 0.6 30 18 30 18 20 12
⊘ This is a preview!⊘
Do you want full access?
Subscribe today to unlock all pages.
Trusted by 1+ million students worldwide
1 out of 15
Related Documents


Your All-in-One AI-Powered Toolkit for Academic Success.
+13062052269
info@desklib.com
Available 24*7 on WhatsApp / Email
![[object Object]](/_next/static/media/star-bottom.7253800d.svg)
Unlock your academic potential
Copyright © 2020–2026 A2Z Services. All Rights Reserved. Developed and managed by ZUCOL.