Quantitative and Qualitative Data Analysis Report in Healthcare Field

Verified

Added on  2020/11/23

|9
|1004
|343
Report
AI Summary
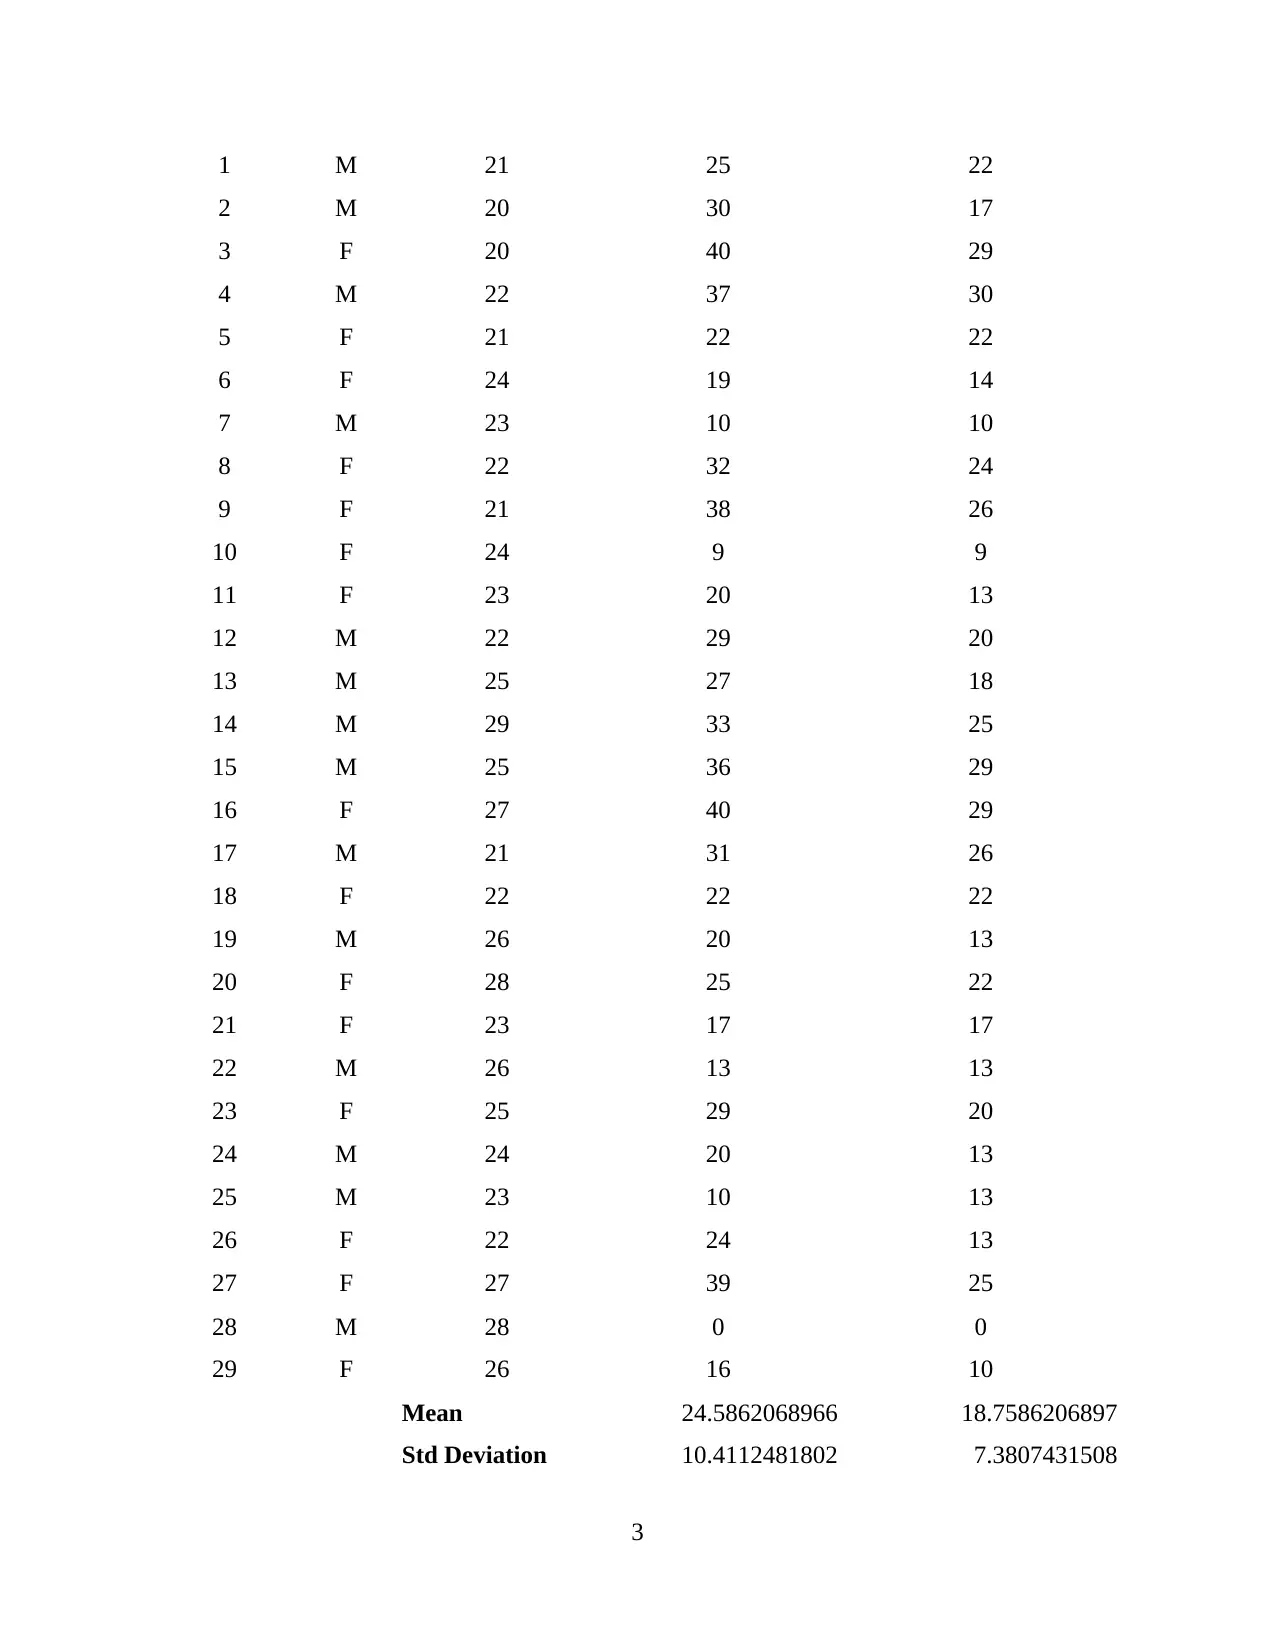
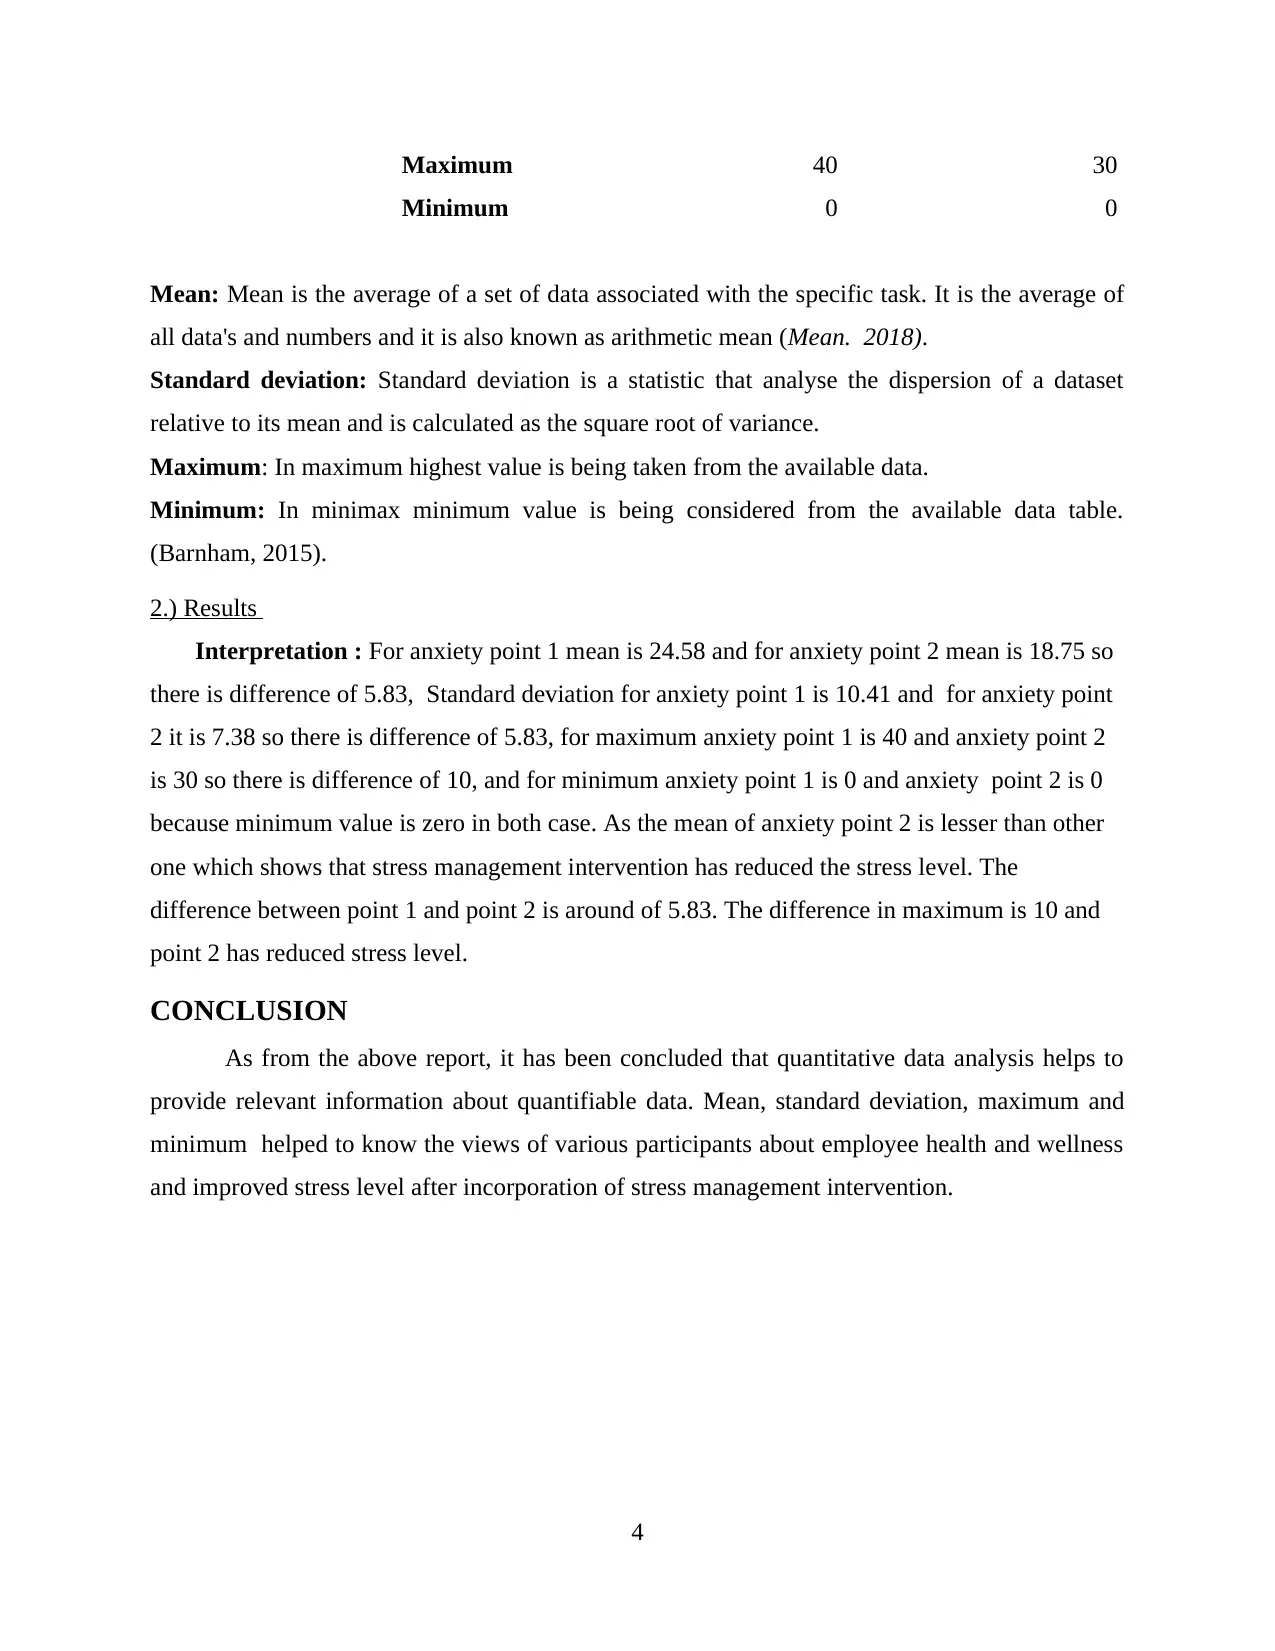
This report presents an analysis of quantitative and qualitative data, focusing on the impact of stress management interventions on employee health and wellness. The report begins with an introduction that highlights the importance of data analysis in research and outlines the objectives of the study. The main body of the report delves into the application of quantitative methods, including the calculation of mean, standard deviation, maximum, and minimum scores related to stress levels before and after the intervention. The report utilizes a dataset of 29 participants, examining their anxiety levels at two different points in time. The results section interprets the statistical findings, demonstrating a reduction in stress levels after the intervention. The report concludes by summarizing the key findings and emphasizing the value of quantitative data analysis in providing insights into employee well-being. References to relevant literature are also provided.
Document Page
Analysing Quantitative and Qualitative
Data
tabler-icon-diamond-filled.svg

Paraphrase This Document

Need a fresh take? Get an instant paraphrase of this document with our AI Paraphraser
Document Page
Table of Contents
INTRODUCTION...........................................................................................................................1
MAIN BODY..................................................................................................................................1
1) Mean and standard deviation, maximum and minimum scores for stress...............................1
2.) Results ...................................................................................................................................3
CONCLUSION................................................................................................................................3
REFERENCES................................................................................................................................4
Document Page
Document Page
INTRODUCTION
Analysing quantitative and qualitative data are important because it suggest interpretation
which helps in outlining findings a research outcome.. It provides help in research investigation
associated with specific objectives. The main aim of this report is to analyse the application of
quantitative method on the basis of collected data.. This report covers the following topics such
as: mean and standard deviation for stress and maximum and minimum scores for stress before
and after stress management intervention. Apart from this it will also discuss about mean stress
scores on the basis of which SMI reduced stress levels will be determined and analysed.
MAIN BODY
1) Mean and standard deviation, maximum and minimum scores for stress
Quantitative data: Quantitative data deal with values, numbers and quantities, making
them measurable. These are generally expressed in numerical form, such as: amount, price,
length, size, etc. It is used in data collection method and provide help in research. It is rely on
random sampling and structured data collection elements. The final result which is produced by
it, can be compare, summarised and analysed. There are various quantitative data collection
strategies such as:
ï‚· Telephonic and face to face interviews, mail questionnaires etc.
ï‚· Observation of events.
ï‚· Experiments
ï‚· Acquire appropriate data from MIS that is management information system.
Quantitative data collection method helps the researcher to provide relevant and valuable
result which develop insight into the mind of researcher (Punch, 2013). There are various
methods of quantitative data collection such as: correlation, close – ended questionnaires and
regression analysis. There are mainly two types of quantitative data: discrete data and continuous
data. Descriptive statistics in this study is associated with the employee health and wellness.
Researcher suggests that occupational stress is a major risk factor for a wide range of health
outcomes which is related with the staff turnover, poor morale, absenteeism. The aim of this task
is outlining statistical output with the help of formulas and calculations . Stress can be analysed
with the perceived stress scale, before and end of the 23 weeks intervention period.
1
tabler-icon-diamond-filled.svg

Paraphrase This Document

Need a fresh take? Get an instant paraphrase of this document with our AI Paraphraser
Document Page
Participant Gender Age Anxiety_Point1 Anxiety_Point2
2
Document Page
1 M 21 25 22
2 M 20 30 17
3 F 20 40 29
4 M 22 37 30
5 F 21 22 22
6 F 24 19 14
7 M 23 10 10
8 F 22 32 24
9 F 21 38 26
10 F 24 9 9
11 F 23 20 13
12 M 22 29 20
13 M 25 27 18
14 M 29 33 25
15 M 25 36 29
16 F 27 40 29
17 M 21 31 26
18 F 22 22 22
19 M 26 20 13
20 F 28 25 22
21 F 23 17 17
22 M 26 13 13
23 F 25 29 20
24 M 24 20 13
25 M 23 10 13
26 F 22 24 13
27 F 27 39 25
28 M 28 0 0
29 F 26 16 10
Mean 24.5862068966 18.7586206897
Std Deviation 10.4112481802 7.3807431508
3
Document Page
Maximum 40 30
Minimum 0 0
Mean: Mean is the average of a set of data associated with the specific task. It is the average of
all data's and numbers and it is also known as arithmetic mean (Mean. 2018).
Standard deviation: Standard deviation is a statistic that analyse the dispersion of a dataset
relative to its mean and is calculated as the square root of variance.
Maximum: In maximum highest value is being taken from the available data.
Minimum: In minimax minimum value is being considered from the available data table.
(Barnham, 2015).
2.) Results
Interpretation : For anxiety point 1 mean is 24.58 and for anxiety point 2 mean is 18.75 so
there is difference of 5.83, Standard deviation for anxiety point 1 is 10.41 and for anxiety point
2 it is 7.38 so there is difference of 5.83, for maximum anxiety point 1 is 40 and anxiety point 2
is 30 so there is difference of 10, and for minimum anxiety point 1 is 0 and anxiety point 2 is 0
because minimum value is zero in both case. As the mean of anxiety point 2 is lesser than other
one which shows that stress management intervention has reduced the stress level. The
difference between point 1 and point 2 is around of 5.83. The difference in maximum is 10 and
point 2 has reduced stress level.
CONCLUSION
As from the above report, it has been concluded that quantitative data analysis helps to
provide relevant information about quantifiable data. Mean, standard deviation, maximum and
minimum helped to know the views of various participants about employee health and wellness
and improved stress level after incorporation of stress management intervention.
4
tabler-icon-diamond-filled.svg

Paraphrase This Document

Need a fresh take? Get an instant paraphrase of this document with our AI Paraphraser
Document Page
5
Document Page
REFERENCES
Books and Journals
Barnham, C., 2015. Quantitative and qualitative research: Perceptual foundations. International
Journal of Market Research. 57(6). pp.837-854.
Punch, K.F., 2013. Introduction to social research: Quantitative and qualitative approaches. Sage.
Online
Mean. 2018. [Online]. Available Through: <https://www.khanacademy.org/math/statistics-
probability/summarizing-quantitative-data/mean-median-basics/a/mean-median-and-
mode-review>
6
chevron_up_icon
1 out of 9
circle_padding
hide_on_mobile
zoom_out_icon
[object Object]