Epidemiology: Analyzing Depression and Heart Disease Prevalence & Risk
VerifiedAdded on 2023/05/29
|7
|1482
|226
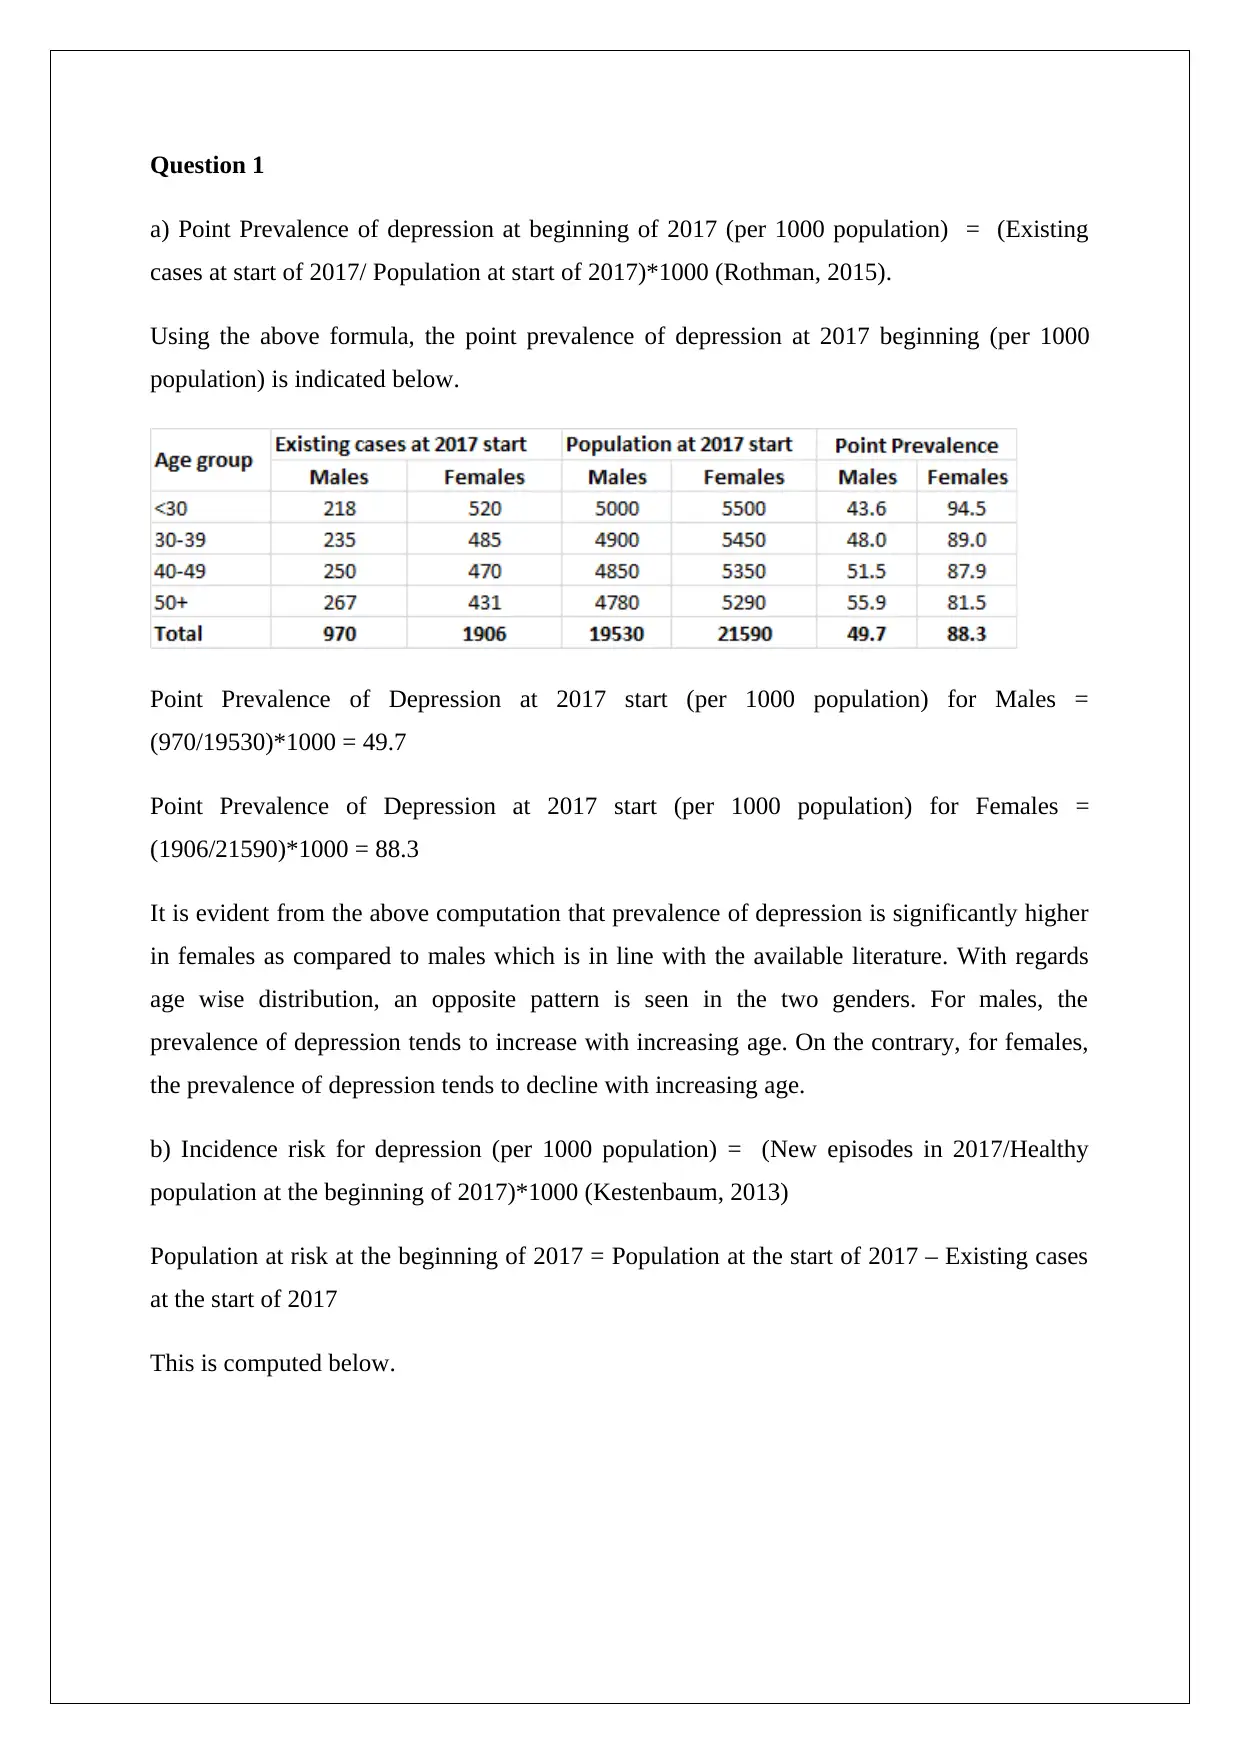
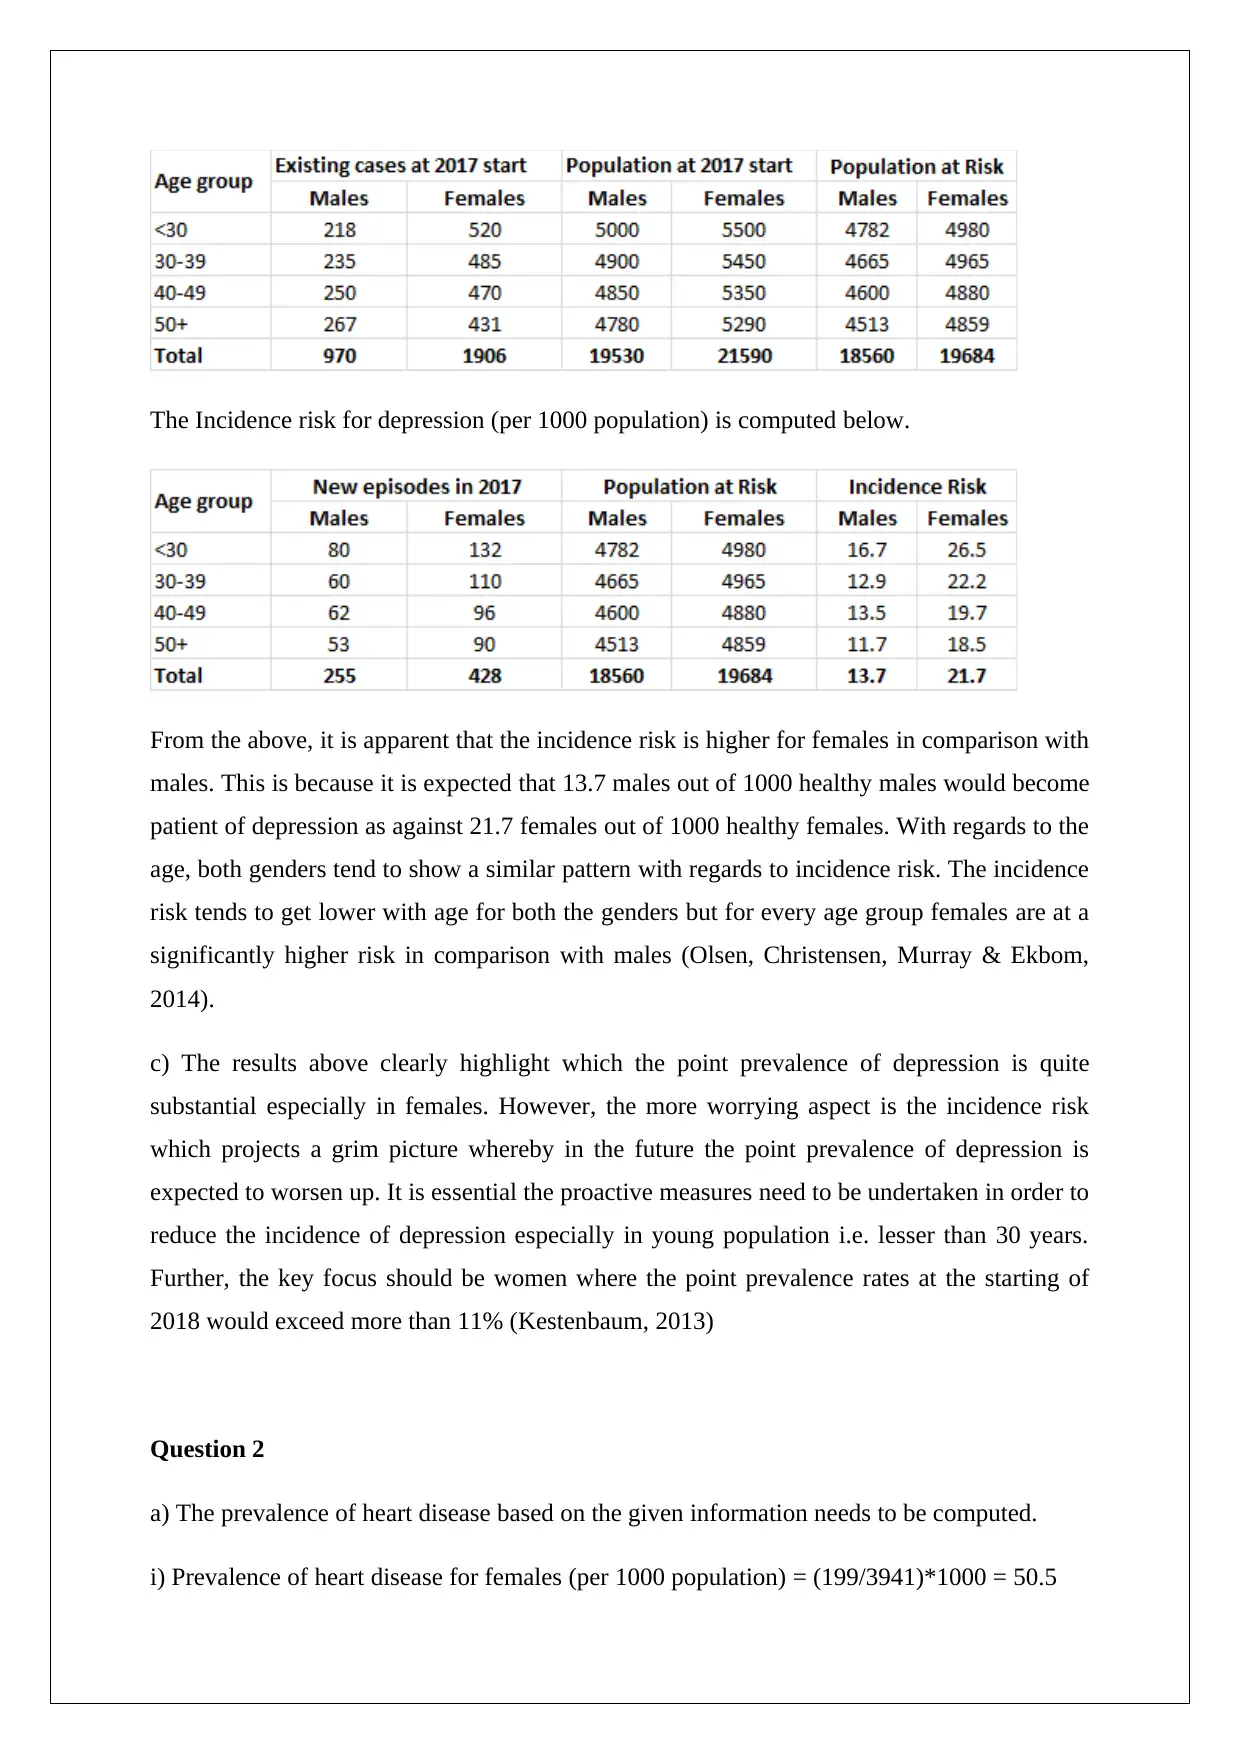
Homework Assignment
AI Summary
This assignment delves into the epidemiology of depression and heart disease, calculating point prevalence and incidence risk for depression based on provided data, highlighting differences between genders and age groups. It further examines the prevalence of heart disease in males and females, computes odds ratios for different levels of physical activity, and evaluates the study design used to assess the association between heart disease and physical activity. The assignment identifies potential sources of bias in the study, discusses the impact of confounding variables, and suggests improvements to the methodology. The analysis reveals significant differences in disease prevalence and risk factors, emphasizing the importance of targeted public health interventions. Desklib offers a range of similar solved assignments and study resources for students.

1 out of 7
Related Documents


Your All-in-One AI-Powered Toolkit for Academic Success.
+13062052269
info@desklib.com
Available 24*7 on WhatsApp / Email
![[object Object]](/_next/static/media/star-bottom.7253800d.svg)
Copyright © 2020–2025 A2Z Services. All Rights Reserved. Developed and managed by ZUCOL.