Exploring Nurse Commitment: Statistical Analysis and Key Influences
VerifiedAdded on 2023/06/05
|25
|4924
|448
Report
AI Summary
This report uses inferential statistics, including t-tests, ANOVA, and regression analysis, to evaluate the intention to leave among nurses. It examines how work commitment varies across gender and ethnicity, finding no significant differences. The study explores the relationship between work-related stress and work commitment, revealing a negative correlation where increased stress is associated with decreased commitment. Furthermore, the impact of work competency level on intention to leave is assessed, along with the roles of developmental opportunities and professional support. The regression analysis formulates equations to predict work commitment based on work-related stress and competency levels, providing insights into factors influencing nurse retention.
0
Running head: WORK COMMITMENT NURSES
WORK COMMITMENT NURSES – Assessment 2
Name of the Student
Name of the University
Author’s Note
Running head: WORK COMMITMENT NURSES
WORK COMMITMENT NURSES – Assessment 2
Name of the Student
Name of the University
Author’s Note
Paraphrase This Document
Need a fresh take? Get an instant paraphrase of this document with our AI Paraphraser
1
WORK COMMITMENT NURSES
Table of Contents
Introduction......................................................................................................................................2
Work Commitment Varies across Gender.......................................................................................2
Work Commitment Varies across Ethnicity....................................................................................3
Relation of Work Related Stress and Work Commitment...............................................................4
Work Competency Level.................................................................................................................7
Opportunities for Development.....................................................................................................12
Professional Support Received......................................................................................................15
Interpretation..................................................................................................................................19
Final Interpretation........................................................................................................................19
Conclusion.....................................................................................................................................22
References......................................................................................................................................24
2
WORK COMMITMENT NURSES
Introduction
In the present assignment we use inferential statistics to evaluate the intention to leave of
the nurses. For the inferential statistics we use t-test, ANOVA and regression analysis.
Work Commitment Varies across Gender
Null Hypothesis: There is no difference in work commitment of nurses across Gender
H0 : μMale =μFemale
Alternate Hypothesis: There are differences in work commitment of nurses across Gender
H0 : μMale ≠ μFemale
Decision Rule: The decision rule at the alpha level of 0.05 level of significance that is beyond 95
% confidence interval is to accept the null hypothesis if p value < 0.05 or equal to 0.05.
However, if the test statistic value falls within the 95 % confidence interval then null hypothesis
should be rejected and alternate hypothesis should be accepted. It will be interpreted that there
exists enough statistical evidence regarding the fact that work related stress has statistically
significant impact upon the intention to leave off the nurses (Black, 2016).
t-test: To test the hypothesis independent sample t-test is used.
⊘ This is a preview!⊘
Do you want full access?
Subscribe today to unlock all pages.
Trusted by 1+ million students worldwide
3
WORK COMMITMENT NURSES
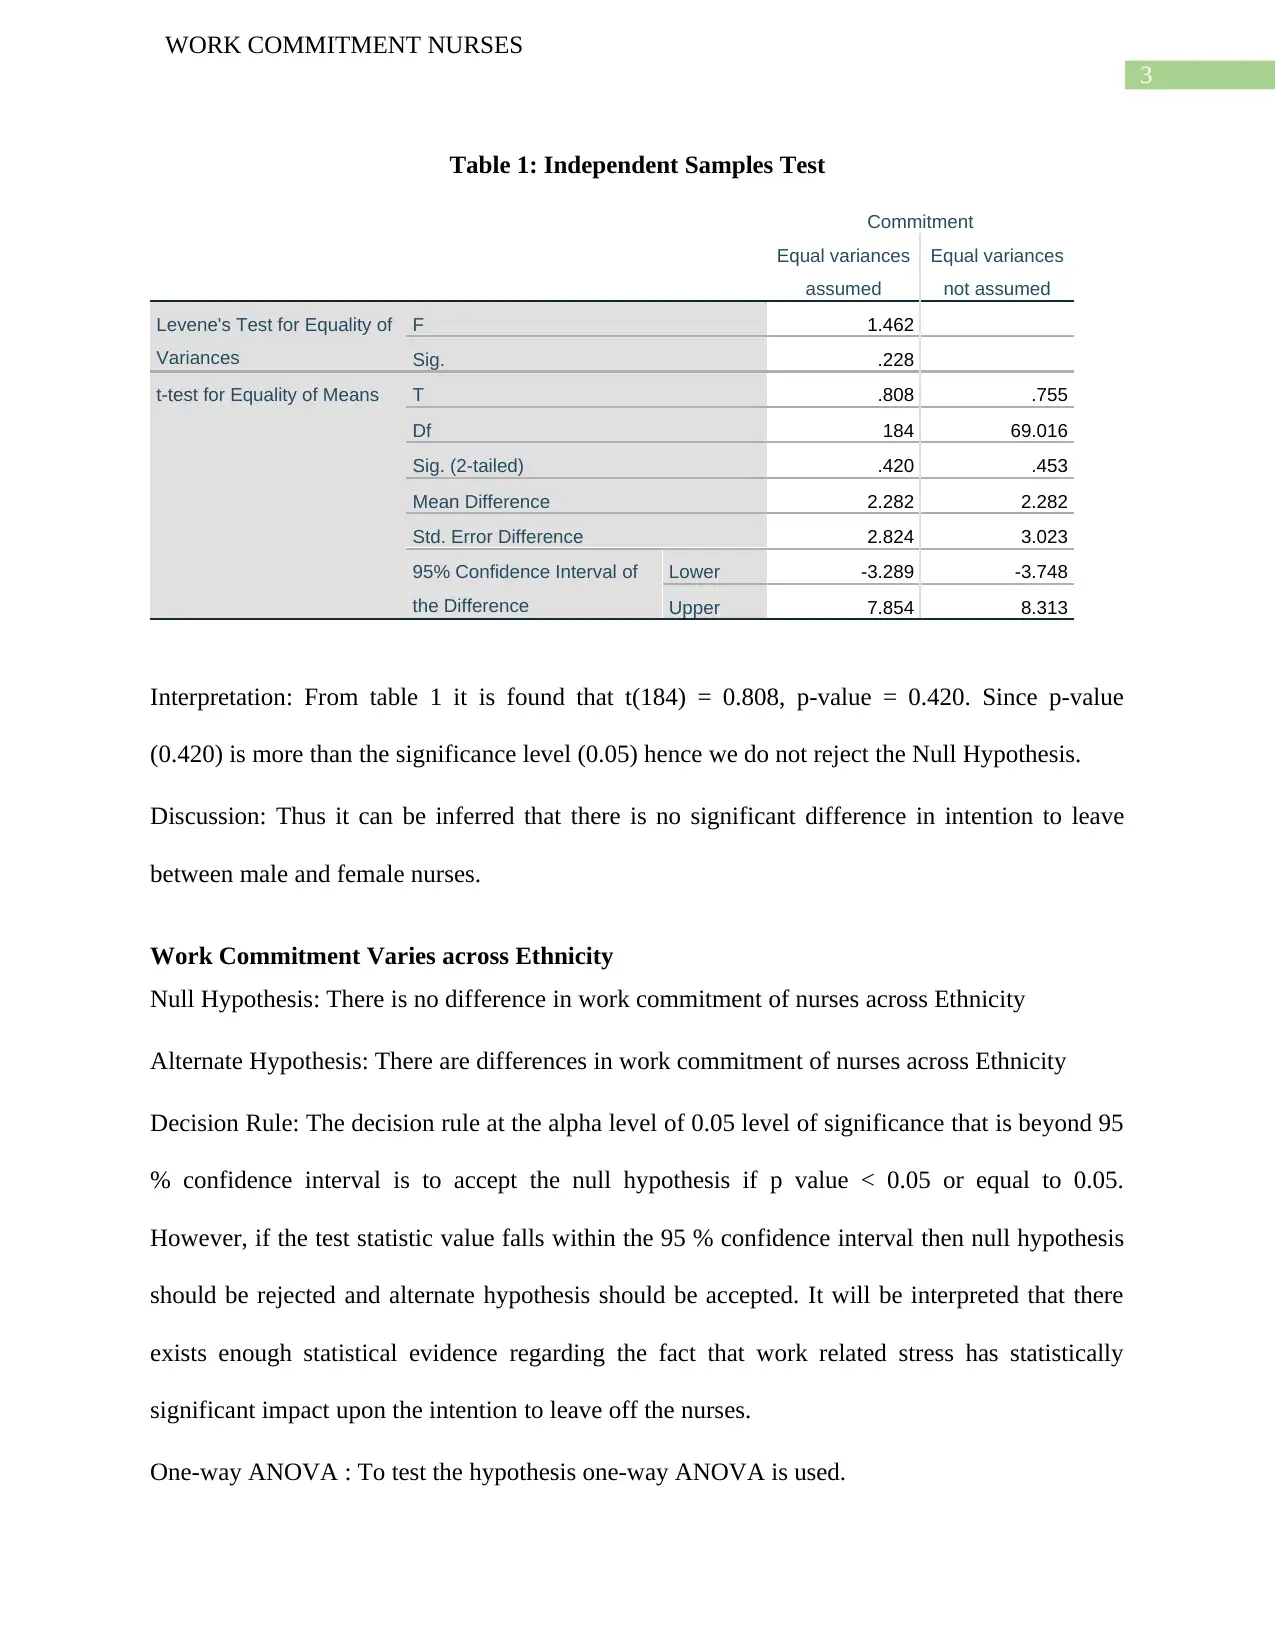
Table 1: Independent Samples Test
Commitment
Equal variances
assumed
Equal variances
not assumed
Levene's Test for Equality of
Variances
F 1.462
Sig. .228
t-test for Equality of Means T .808 .755
Df 184 69.016
Sig. (2-tailed) .420 .453
Mean Difference 2.282 2.282
Std. Error Difference 2.824 3.023
95% Confidence Interval of
the Difference
Lower -3.289 -3.748
Upper 7.854 8.313
Interpretation: From table 1 it is found that t(184) = 0.808, p-value = 0.420. Since p-value
(0.420) is more than the significance level (0.05) hence we do not reject the Null Hypothesis.
Discussion: Thus it can be inferred that there is no significant difference in intention to leave
between male and female nurses.
Work Commitment Varies across Ethnicity
Null Hypothesis: There is no difference in work commitment of nurses across Ethnicity
Alternate Hypothesis: There are differences in work commitment of nurses across Ethnicity
Decision Rule: The decision rule at the alpha level of 0.05 level of significance that is beyond 95
% confidence interval is to accept the null hypothesis if p value < 0.05 or equal to 0.05.
However, if the test statistic value falls within the 95 % confidence interval then null hypothesis
should be rejected and alternate hypothesis should be accepted. It will be interpreted that there
exists enough statistical evidence regarding the fact that work related stress has statistically
significant impact upon the intention to leave off the nurses.
One-way ANOVA : To test the hypothesis one-way ANOVA is used.
WORK COMMITMENT NURSES
Table 1: Independent Samples Test
Commitment
Equal variances
assumed
Equal variances
not assumed
Levene's Test for Equality of
Variances
F 1.462
Sig. .228
t-test for Equality of Means T .808 .755
Df 184 69.016
Sig. (2-tailed) .420 .453
Mean Difference 2.282 2.282
Std. Error Difference 2.824 3.023
95% Confidence Interval of
the Difference
Lower -3.289 -3.748
Upper 7.854 8.313
Interpretation: From table 1 it is found that t(184) = 0.808, p-value = 0.420. Since p-value
(0.420) is more than the significance level (0.05) hence we do not reject the Null Hypothesis.
Discussion: Thus it can be inferred that there is no significant difference in intention to leave
between male and female nurses.
Work Commitment Varies across Ethnicity
Null Hypothesis: There is no difference in work commitment of nurses across Ethnicity
Alternate Hypothesis: There are differences in work commitment of nurses across Ethnicity
Decision Rule: The decision rule at the alpha level of 0.05 level of significance that is beyond 95
% confidence interval is to accept the null hypothesis if p value < 0.05 or equal to 0.05.
However, if the test statistic value falls within the 95 % confidence interval then null hypothesis
should be rejected and alternate hypothesis should be accepted. It will be interpreted that there
exists enough statistical evidence regarding the fact that work related stress has statistically
significant impact upon the intention to leave off the nurses.
One-way ANOVA : To test the hypothesis one-way ANOVA is used.
Paraphrase This Document
Need a fresh take? Get an instant paraphrase of this document with our AI Paraphraser
4
WORK COMMITMENT NURSES
Table 2: ANOVA
Commitment
Sum of Squares df Mean Square F Sig.
Between Groups 354.463 3 118.154 .425 .735
Within Groups 50626.276 182 278.166
Total 50980.739 185
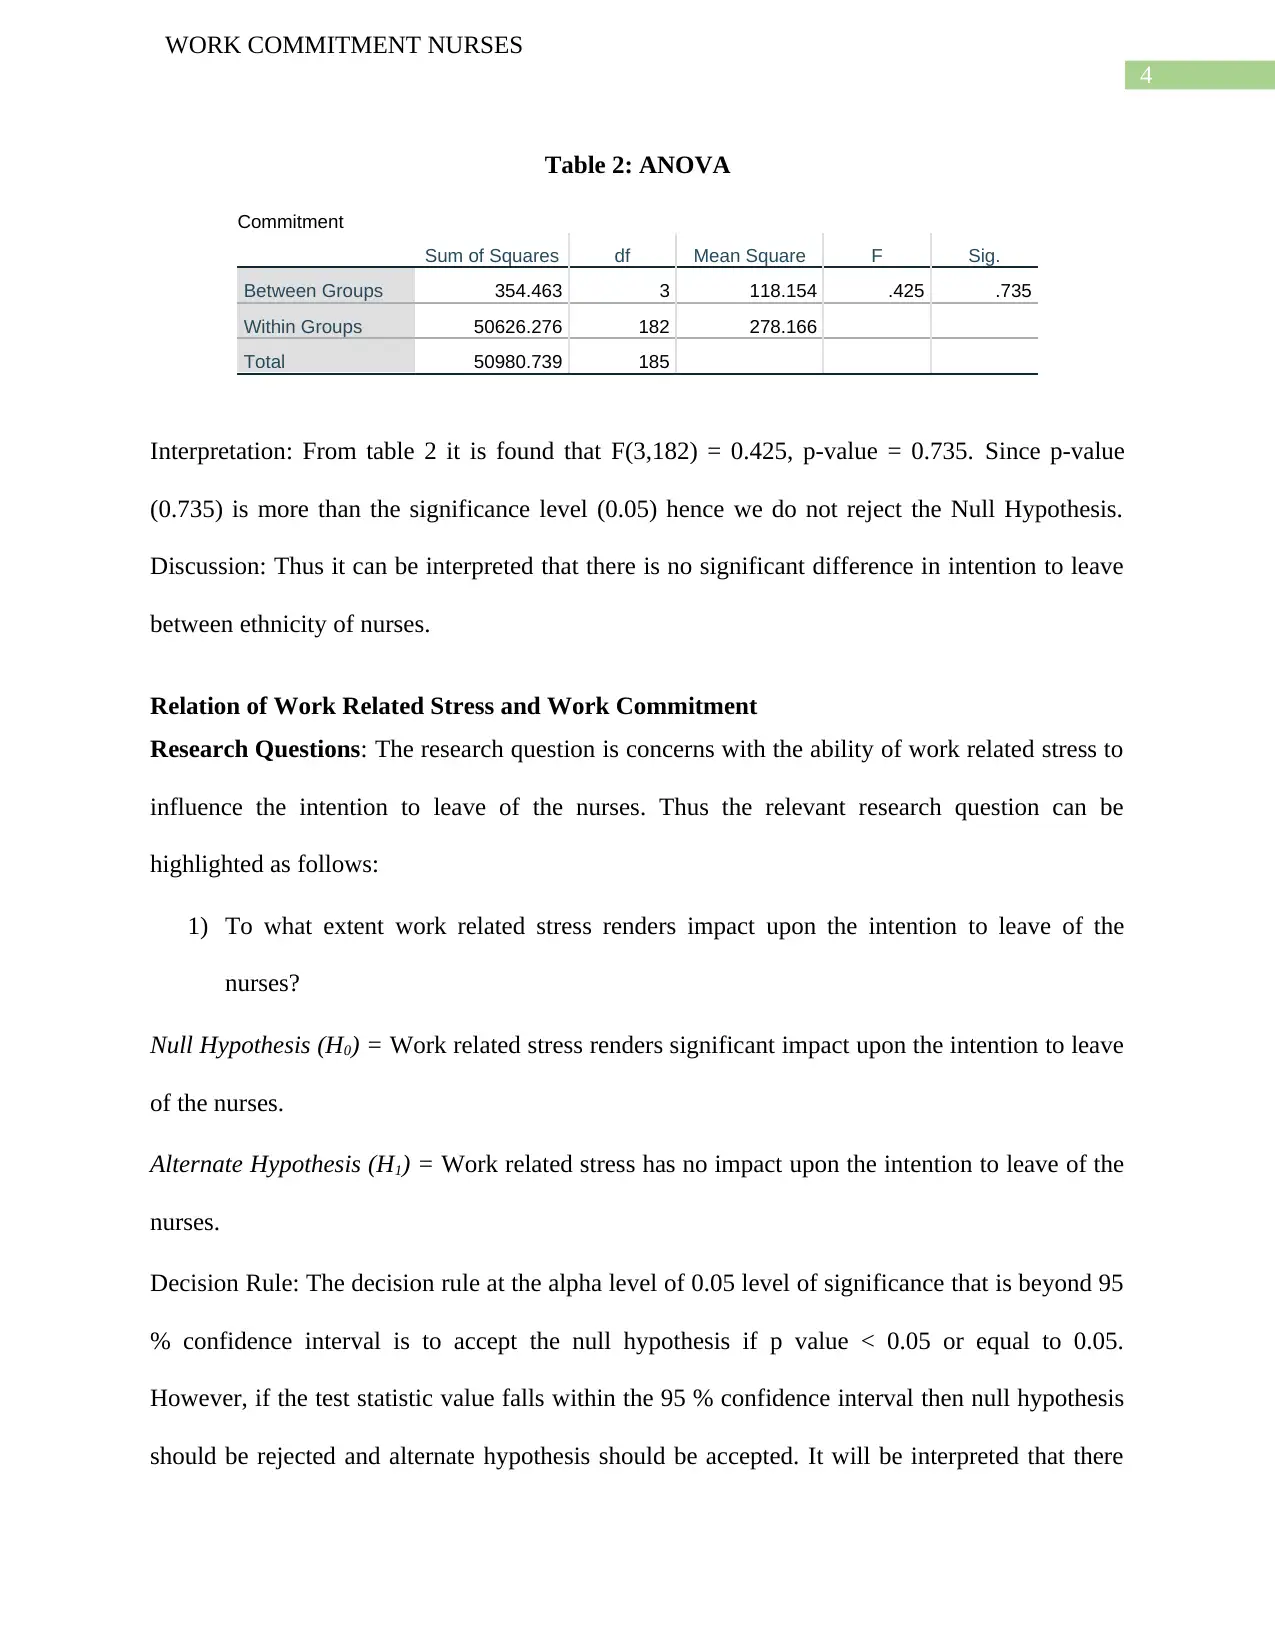
Interpretation: From table 2 it is found that F(3,182) = 0.425, p-value = 0.735. Since p-value
(0.735) is more than the significance level (0.05) hence we do not reject the Null Hypothesis.
Discussion: Thus it can be interpreted that there is no significant difference in intention to leave
between ethnicity of nurses.
Relation of Work Related Stress and Work Commitment
Research Questions: The research question is concerns with the ability of work related stress to
influence the intention to leave of the nurses. Thus the relevant research question can be
highlighted as follows:
1) To what extent work related stress renders impact upon the intention to leave of the
nurses?
Null Hypothesis (H0) = Work related stress renders significant impact upon the intention to leave
of the nurses.
Alternate Hypothesis (H1) = Work related stress has no impact upon the intention to leave of the
nurses.
Decision Rule: The decision rule at the alpha level of 0.05 level of significance that is beyond 95
% confidence interval is to accept the null hypothesis if p value < 0.05 or equal to 0.05.
However, if the test statistic value falls within the 95 % confidence interval then null hypothesis
should be rejected and alternate hypothesis should be accepted. It will be interpreted that there
WORK COMMITMENT NURSES
Table 2: ANOVA
Commitment
Sum of Squares df Mean Square F Sig.
Between Groups 354.463 3 118.154 .425 .735
Within Groups 50626.276 182 278.166
Total 50980.739 185
Interpretation: From table 2 it is found that F(3,182) = 0.425, p-value = 0.735. Since p-value
(0.735) is more than the significance level (0.05) hence we do not reject the Null Hypothesis.
Discussion: Thus it can be interpreted that there is no significant difference in intention to leave
between ethnicity of nurses.
Relation of Work Related Stress and Work Commitment
Research Questions: The research question is concerns with the ability of work related stress to
influence the intention to leave of the nurses. Thus the relevant research question can be
highlighted as follows:
1) To what extent work related stress renders impact upon the intention to leave of the
nurses?
Null Hypothesis (H0) = Work related stress renders significant impact upon the intention to leave
of the nurses.
Alternate Hypothesis (H1) = Work related stress has no impact upon the intention to leave of the
nurses.
Decision Rule: The decision rule at the alpha level of 0.05 level of significance that is beyond 95
% confidence interval is to accept the null hypothesis if p value < 0.05 or equal to 0.05.
However, if the test statistic value falls within the 95 % confidence interval then null hypothesis
should be rejected and alternate hypothesis should be accepted. It will be interpreted that there
5
WORK COMMITMENT NURSES
exists enough statistical evidence regarding the fact that work related stress has statistically
significant impact upon the intention to leave off the nurses (Anderson et al., 2017).
Analysis:
Table 3: Descriptive Statistics
Mean Std. Deviation N
Commitment 66.07 16.600 186
Work Related
Stress
15.92 4.363 186
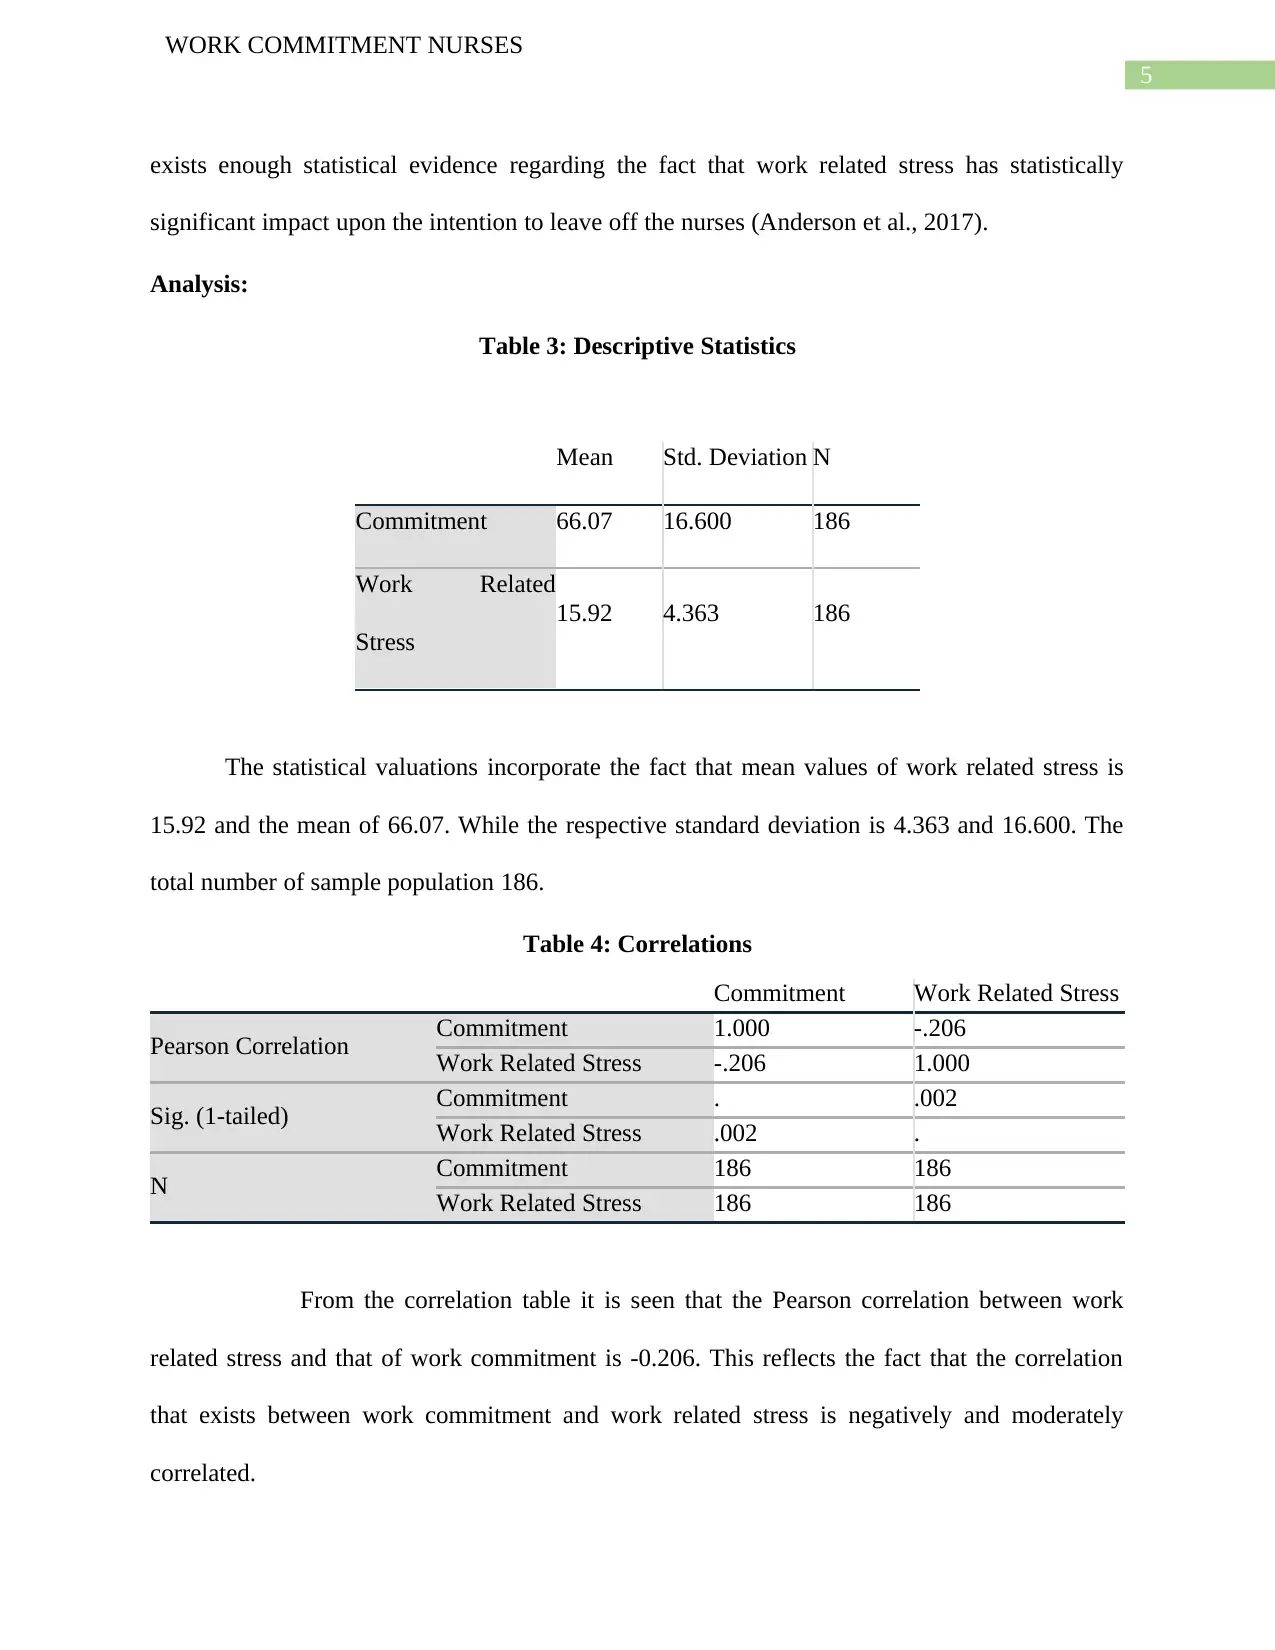
The statistical valuations incorporate the fact that mean values of work related stress is
15.92 and the mean of 66.07. While the respective standard deviation is 4.363 and 16.600. The
total number of sample population 186.
Table 4: Correlations
Commitment Work Related Stress
Pearson Correlation Commitment 1.000 -.206
Work Related Stress -.206 1.000
Sig. (1-tailed) Commitment . .002
Work Related Stress .002 .
N Commitment 186 186
Work Related Stress 186 186
From the correlation table it is seen that the Pearson correlation between work
related stress and that of work commitment is -0.206. This reflects the fact that the correlation
that exists between work commitment and work related stress is negatively and moderately
correlated.
WORK COMMITMENT NURSES
exists enough statistical evidence regarding the fact that work related stress has statistically
significant impact upon the intention to leave off the nurses (Anderson et al., 2017).
Analysis:
Table 3: Descriptive Statistics
Mean Std. Deviation N
Commitment 66.07 16.600 186
Work Related
Stress
15.92 4.363 186
The statistical valuations incorporate the fact that mean values of work related stress is
15.92 and the mean of 66.07. While the respective standard deviation is 4.363 and 16.600. The
total number of sample population 186.
Table 4: Correlations
Commitment Work Related Stress
Pearson Correlation Commitment 1.000 -.206
Work Related Stress -.206 1.000
Sig. (1-tailed) Commitment . .002
Work Related Stress .002 .
N Commitment 186 186
Work Related Stress 186 186
From the correlation table it is seen that the Pearson correlation between work
related stress and that of work commitment is -0.206. This reflects the fact that the correlation
that exists between work commitment and work related stress is negatively and moderately
correlated.
⊘ This is a preview!⊘
Do you want full access?
Subscribe today to unlock all pages.
Trusted by 1+ million students worldwide
6
WORK COMMITMENT NURSES
Based on the sample population there is statistically significant evidence that shows that
the 1 tailed significance is 0.002 which is lower than the alpha level of the p value taken under
consideration which is 0.05. Due to the reason that 0.002 < 0.05 hence, the correlation between
work commitment and that of work related stress is - 0.206 which shows that the correlation is
negative and the correlation is statistically significant as there exists enough evidence that
supports the fact that there is prevalence of significant correlation between work related stress
and work commitment within the nurses.
Table 5: Model Summary
Model R R Square Adjusted R
Square
Std. Error of
the Estimate
1 .206a .042 .037 16.289
a. Predictors: (Constant), Work Related Stress
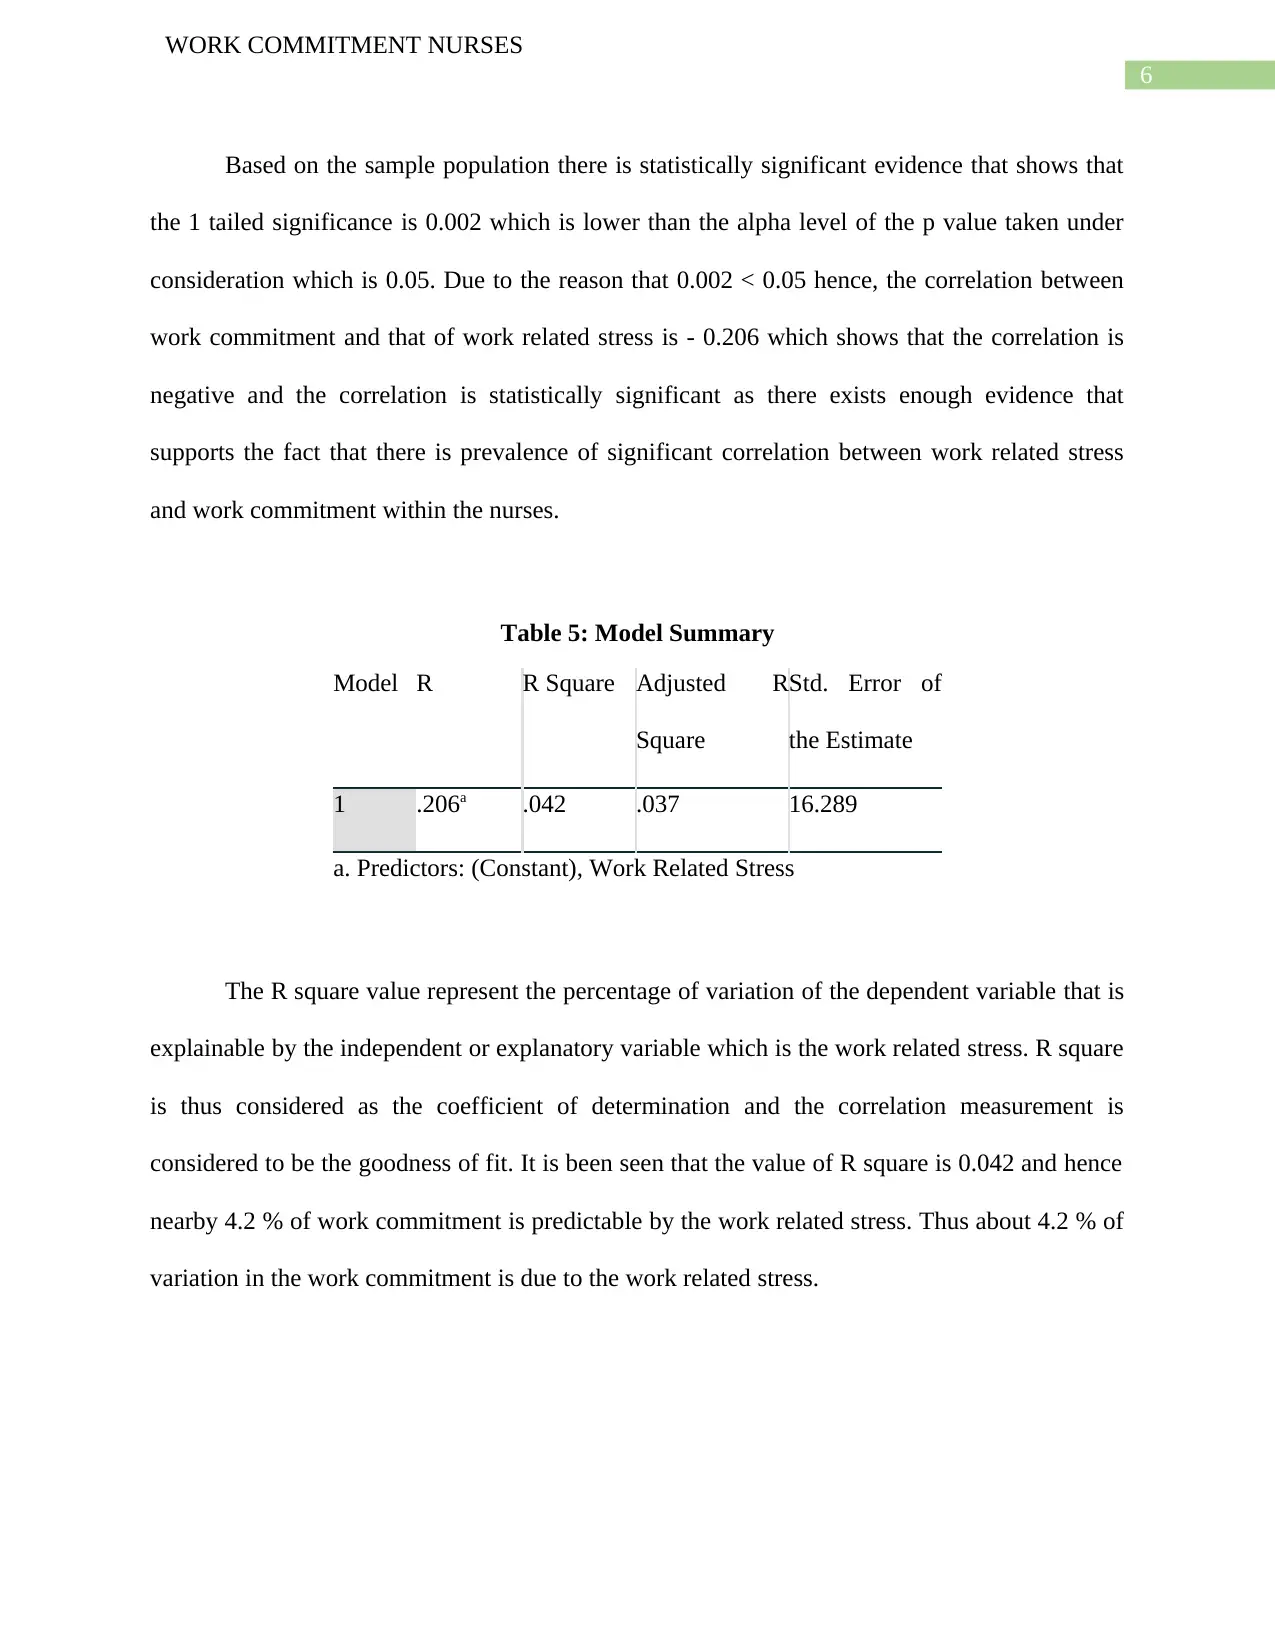
The R square value represent the percentage of variation of the dependent variable that is
explainable by the independent or explanatory variable which is the work related stress. R square
is thus considered as the coefficient of determination and the correlation measurement is
considered to be the goodness of fit. It is been seen that the value of R square is 0.042 and hence
nearby 4.2 % of work commitment is predictable by the work related stress. Thus about 4.2 % of
variation in the work commitment is due to the work related stress.
WORK COMMITMENT NURSES
Based on the sample population there is statistically significant evidence that shows that
the 1 tailed significance is 0.002 which is lower than the alpha level of the p value taken under
consideration which is 0.05. Due to the reason that 0.002 < 0.05 hence, the correlation between
work commitment and that of work related stress is - 0.206 which shows that the correlation is
negative and the correlation is statistically significant as there exists enough evidence that
supports the fact that there is prevalence of significant correlation between work related stress
and work commitment within the nurses.
Table 5: Model Summary
Model R R Square Adjusted R
Square
Std. Error of
the Estimate
1 .206a .042 .037 16.289
a. Predictors: (Constant), Work Related Stress
The R square value represent the percentage of variation of the dependent variable that is
explainable by the independent or explanatory variable which is the work related stress. R square
is thus considered as the coefficient of determination and the correlation measurement is
considered to be the goodness of fit. It is been seen that the value of R square is 0.042 and hence
nearby 4.2 % of work commitment is predictable by the work related stress. Thus about 4.2 % of
variation in the work commitment is due to the work related stress.
Paraphrase This Document
Need a fresh take? Get an instant paraphrase of this document with our AI Paraphraser
7
WORK COMMITMENT NURSES
Table 6: ANOVA
Model Sum of Squares df Mean Square F Sig.
1
Regression 2160.626 1 2160.626 8.143 .005b
Residual 48820.113 184 265.327
Total 50980.739 185
a. Dependent Variable: Commitment
Table 7: Coefficients
Model
Unstandardized Coefficients
Standardized
Coefficients
t Sig.B Std. Error Beta
1 (Constant) 78.538 4.530 17.338 .000
WorkRelatedStress -.783 .274 -.206 -2.854 .005
a. Dependent Variable: Commitment
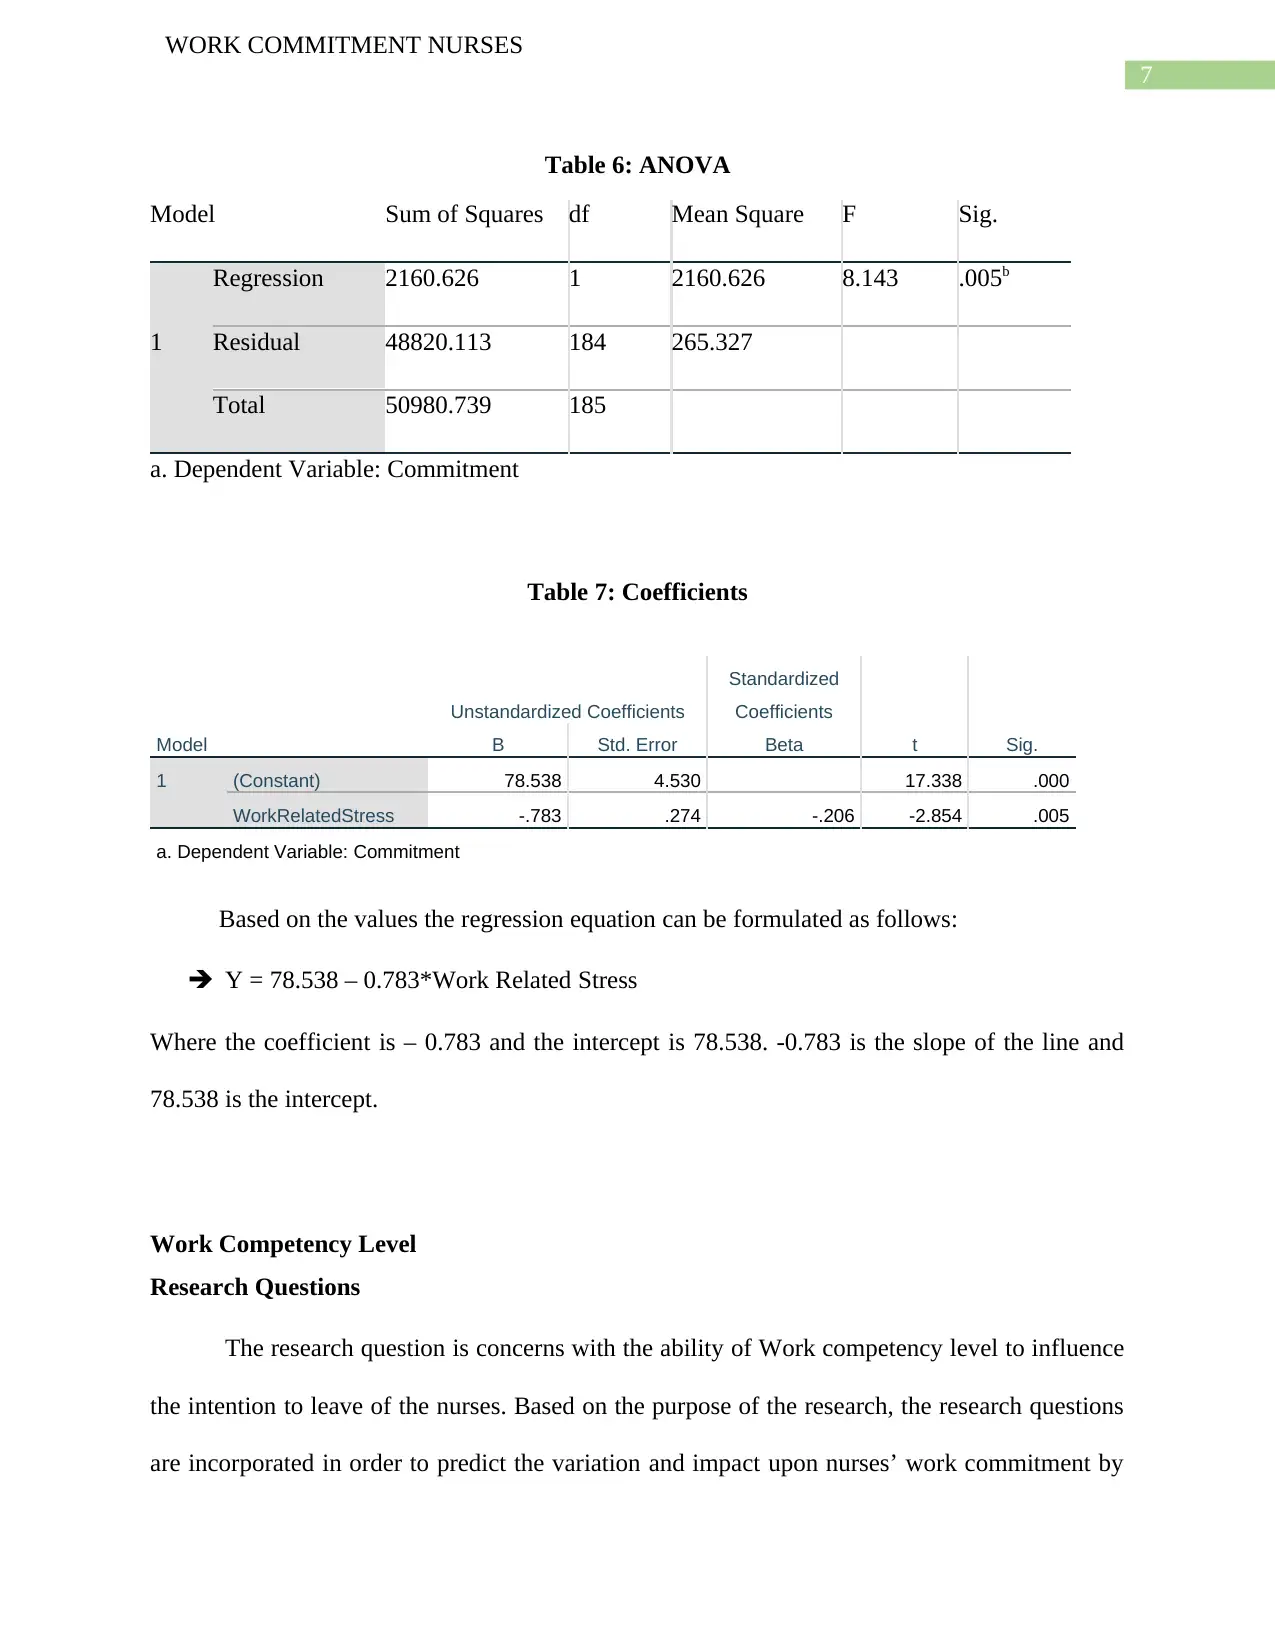
Based on the values the regression equation can be formulated as follows:
Y = 78.538 – 0.783*Work Related Stress
Where the coefficient is – 0.783 and the intercept is 78.538. -0.783 is the slope of the line and
78.538 is the intercept.
Work Competency Level
Research Questions
The research question is concerns with the ability of Work competency level to influence
the intention to leave of the nurses. Based on the purpose of the research, the research questions
are incorporated in order to predict the variation and impact upon nurses’ work commitment by
WORK COMMITMENT NURSES
Table 6: ANOVA
Model Sum of Squares df Mean Square F Sig.
1
Regression 2160.626 1 2160.626 8.143 .005b
Residual 48820.113 184 265.327
Total 50980.739 185
a. Dependent Variable: Commitment
Table 7: Coefficients
Model
Unstandardized Coefficients
Standardized
Coefficients
t Sig.B Std. Error Beta
1 (Constant) 78.538 4.530 17.338 .000
WorkRelatedStress -.783 .274 -.206 -2.854 .005
a. Dependent Variable: Commitment
Based on the values the regression equation can be formulated as follows:
Y = 78.538 – 0.783*Work Related Stress
Where the coefficient is – 0.783 and the intercept is 78.538. -0.783 is the slope of the line and
78.538 is the intercept.
Work Competency Level
Research Questions
The research question is concerns with the ability of Work competency level to influence
the intention to leave of the nurses. Based on the purpose of the research, the research questions
are incorporated in order to predict the variation and impact upon nurses’ work commitment by
8
WORK COMMITMENT NURSES
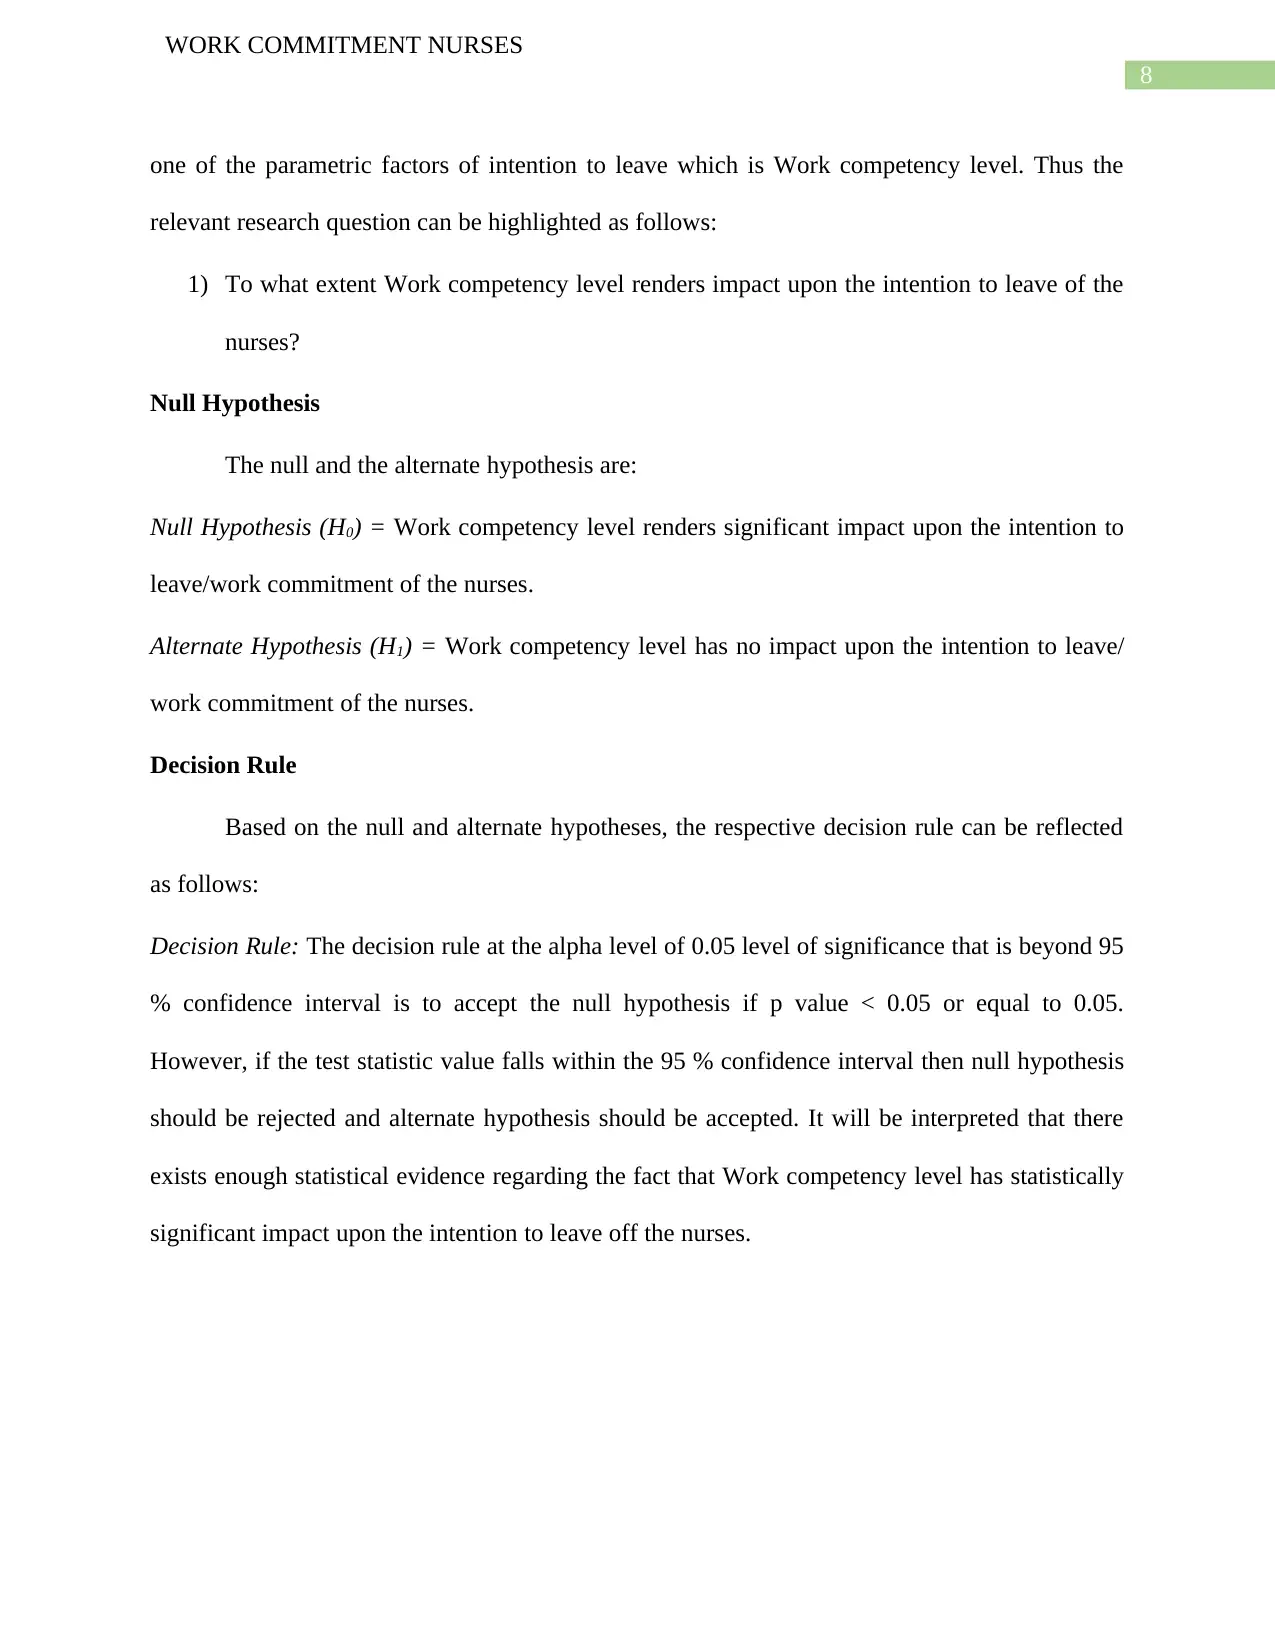
one of the parametric factors of intention to leave which is Work competency level. Thus the
relevant research question can be highlighted as follows:
1) To what extent Work competency level renders impact upon the intention to leave of the
nurses?
Null Hypothesis
The null and the alternate hypothesis are:
Null Hypothesis (H0) = Work competency level renders significant impact upon the intention to
leave/work commitment of the nurses.
Alternate Hypothesis (H1) = Work competency level has no impact upon the intention to leave/
work commitment of the nurses.
Decision Rule
Based on the null and alternate hypotheses, the respective decision rule can be reflected
as follows:
Decision Rule: The decision rule at the alpha level of 0.05 level of significance that is beyond 95
% confidence interval is to accept the null hypothesis if p value < 0.05 or equal to 0.05.
However, if the test statistic value falls within the 95 % confidence interval then null hypothesis
should be rejected and alternate hypothesis should be accepted. It will be interpreted that there
exists enough statistical evidence regarding the fact that Work competency level has statistically
significant impact upon the intention to leave off the nurses.
WORK COMMITMENT NURSES
one of the parametric factors of intention to leave which is Work competency level. Thus the
relevant research question can be highlighted as follows:
1) To what extent Work competency level renders impact upon the intention to leave of the
nurses?
Null Hypothesis
The null and the alternate hypothesis are:
Null Hypothesis (H0) = Work competency level renders significant impact upon the intention to
leave/work commitment of the nurses.
Alternate Hypothesis (H1) = Work competency level has no impact upon the intention to leave/
work commitment of the nurses.
Decision Rule
Based on the null and alternate hypotheses, the respective decision rule can be reflected
as follows:
Decision Rule: The decision rule at the alpha level of 0.05 level of significance that is beyond 95
% confidence interval is to accept the null hypothesis if p value < 0.05 or equal to 0.05.
However, if the test statistic value falls within the 95 % confidence interval then null hypothesis
should be rejected and alternate hypothesis should be accepted. It will be interpreted that there
exists enough statistical evidence regarding the fact that Work competency level has statistically
significant impact upon the intention to leave off the nurses.
⊘ This is a preview!⊘
Do you want full access?
Subscribe today to unlock all pages.
Trusted by 1+ million students worldwide
9
WORK COMMITMENT NURSES
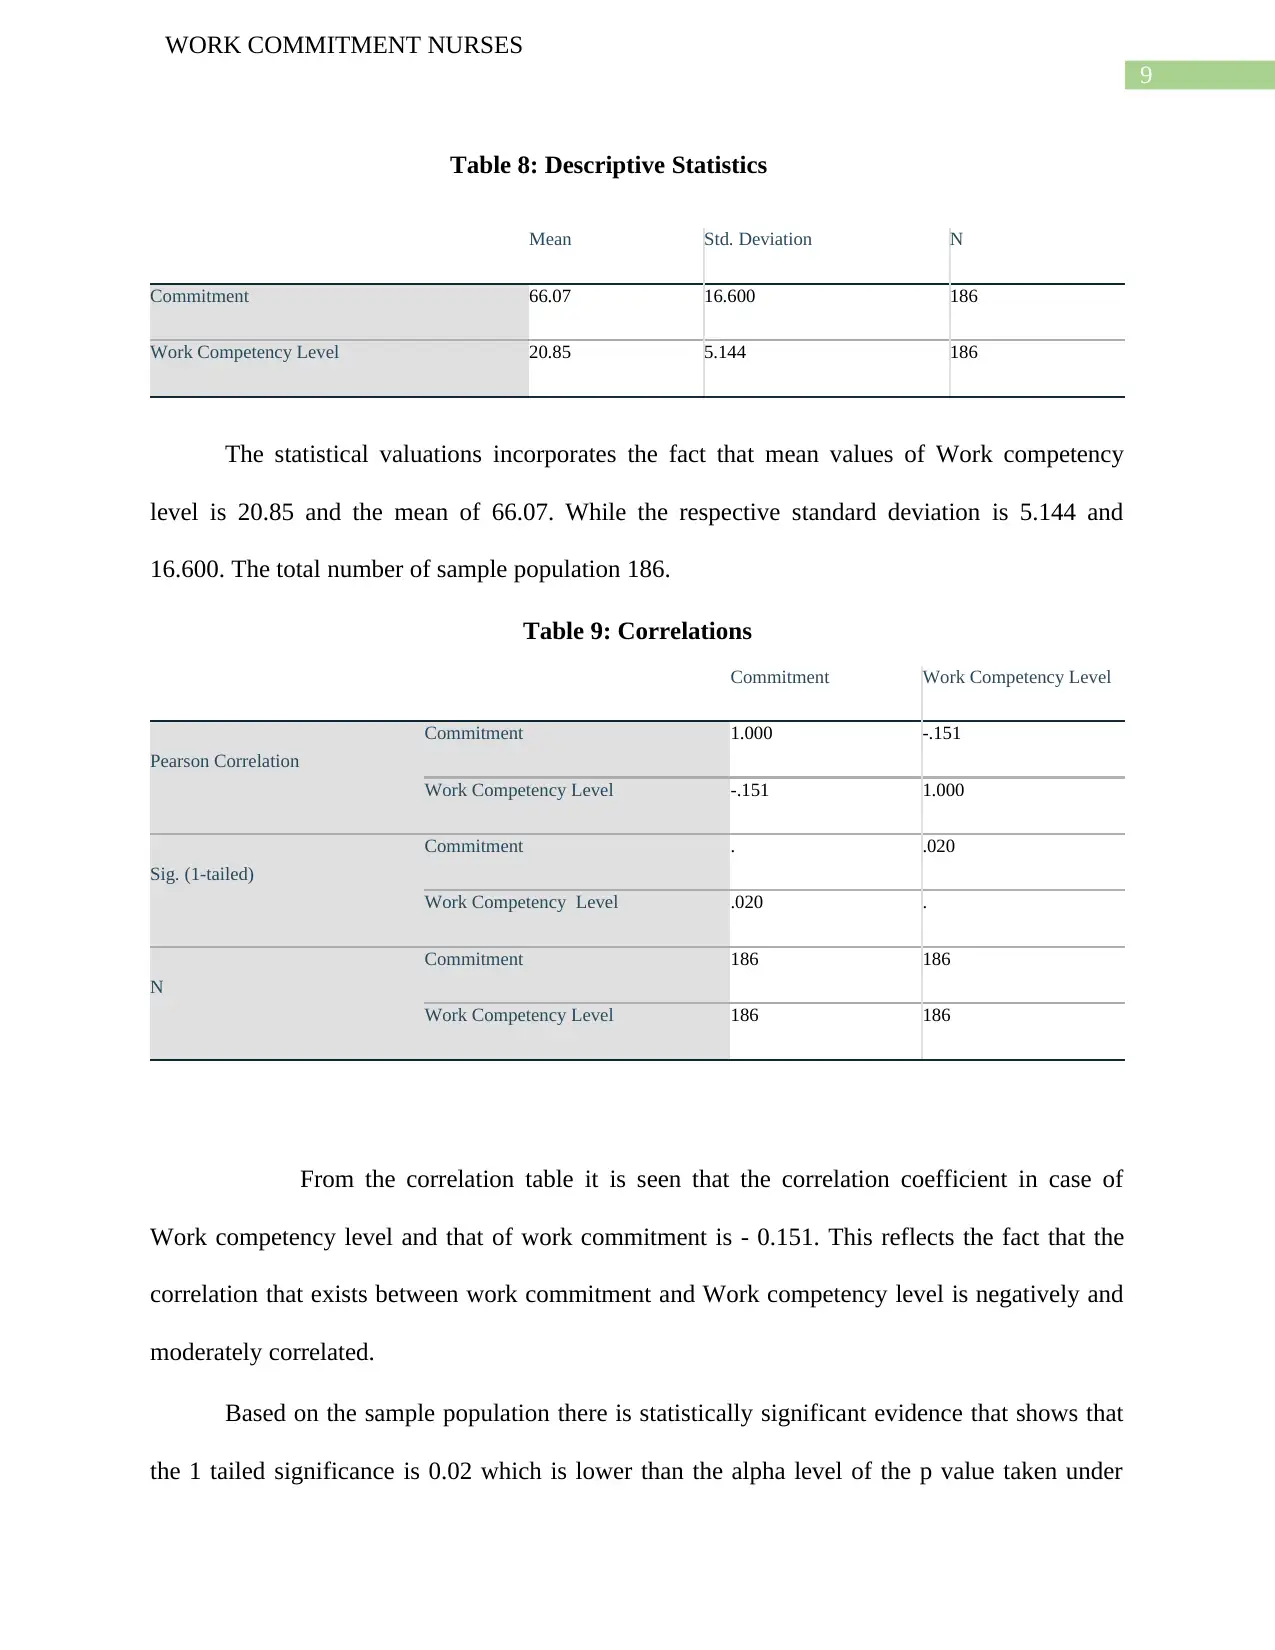
Table 8: Descriptive Statistics
Mean Std. Deviation N
Commitment 66.07 16.600 186
Work Competency Level 20.85 5.144 186
The statistical valuations incorporates the fact that mean values of Work competency
level is 20.85 and the mean of 66.07. While the respective standard deviation is 5.144 and
16.600. The total number of sample population 186.
Table 9: Correlations
Commitment Work Competency Level
Pearson Correlation
Commitment 1.000 -.151
Work Competency Level -.151 1.000
Sig. (1-tailed)
Commitment . .020
Work Competency Level .020 .
N
Commitment 186 186
Work Competency Level 186 186
From the correlation table it is seen that the correlation coefficient in case of
Work competency level and that of work commitment is - 0.151. This reflects the fact that the
correlation that exists between work commitment and Work competency level is negatively and
moderately correlated.
Based on the sample population there is statistically significant evidence that shows that
the 1 tailed significance is 0.02 which is lower than the alpha level of the p value taken under
WORK COMMITMENT NURSES
Table 8: Descriptive Statistics
Mean Std. Deviation N
Commitment 66.07 16.600 186
Work Competency Level 20.85 5.144 186
The statistical valuations incorporates the fact that mean values of Work competency
level is 20.85 and the mean of 66.07. While the respective standard deviation is 5.144 and
16.600. The total number of sample population 186.
Table 9: Correlations
Commitment Work Competency Level
Pearson Correlation
Commitment 1.000 -.151
Work Competency Level -.151 1.000
Sig. (1-tailed)
Commitment . .020
Work Competency Level .020 .
N
Commitment 186 186
Work Competency Level 186 186
From the correlation table it is seen that the correlation coefficient in case of
Work competency level and that of work commitment is - 0.151. This reflects the fact that the
correlation that exists between work commitment and Work competency level is negatively and
moderately correlated.
Based on the sample population there is statistically significant evidence that shows that
the 1 tailed significance is 0.02 which is lower than the alpha level of the p value taken under
Paraphrase This Document
Need a fresh take? Get an instant paraphrase of this document with our AI Paraphraser
10
WORK COMMITMENT NURSES
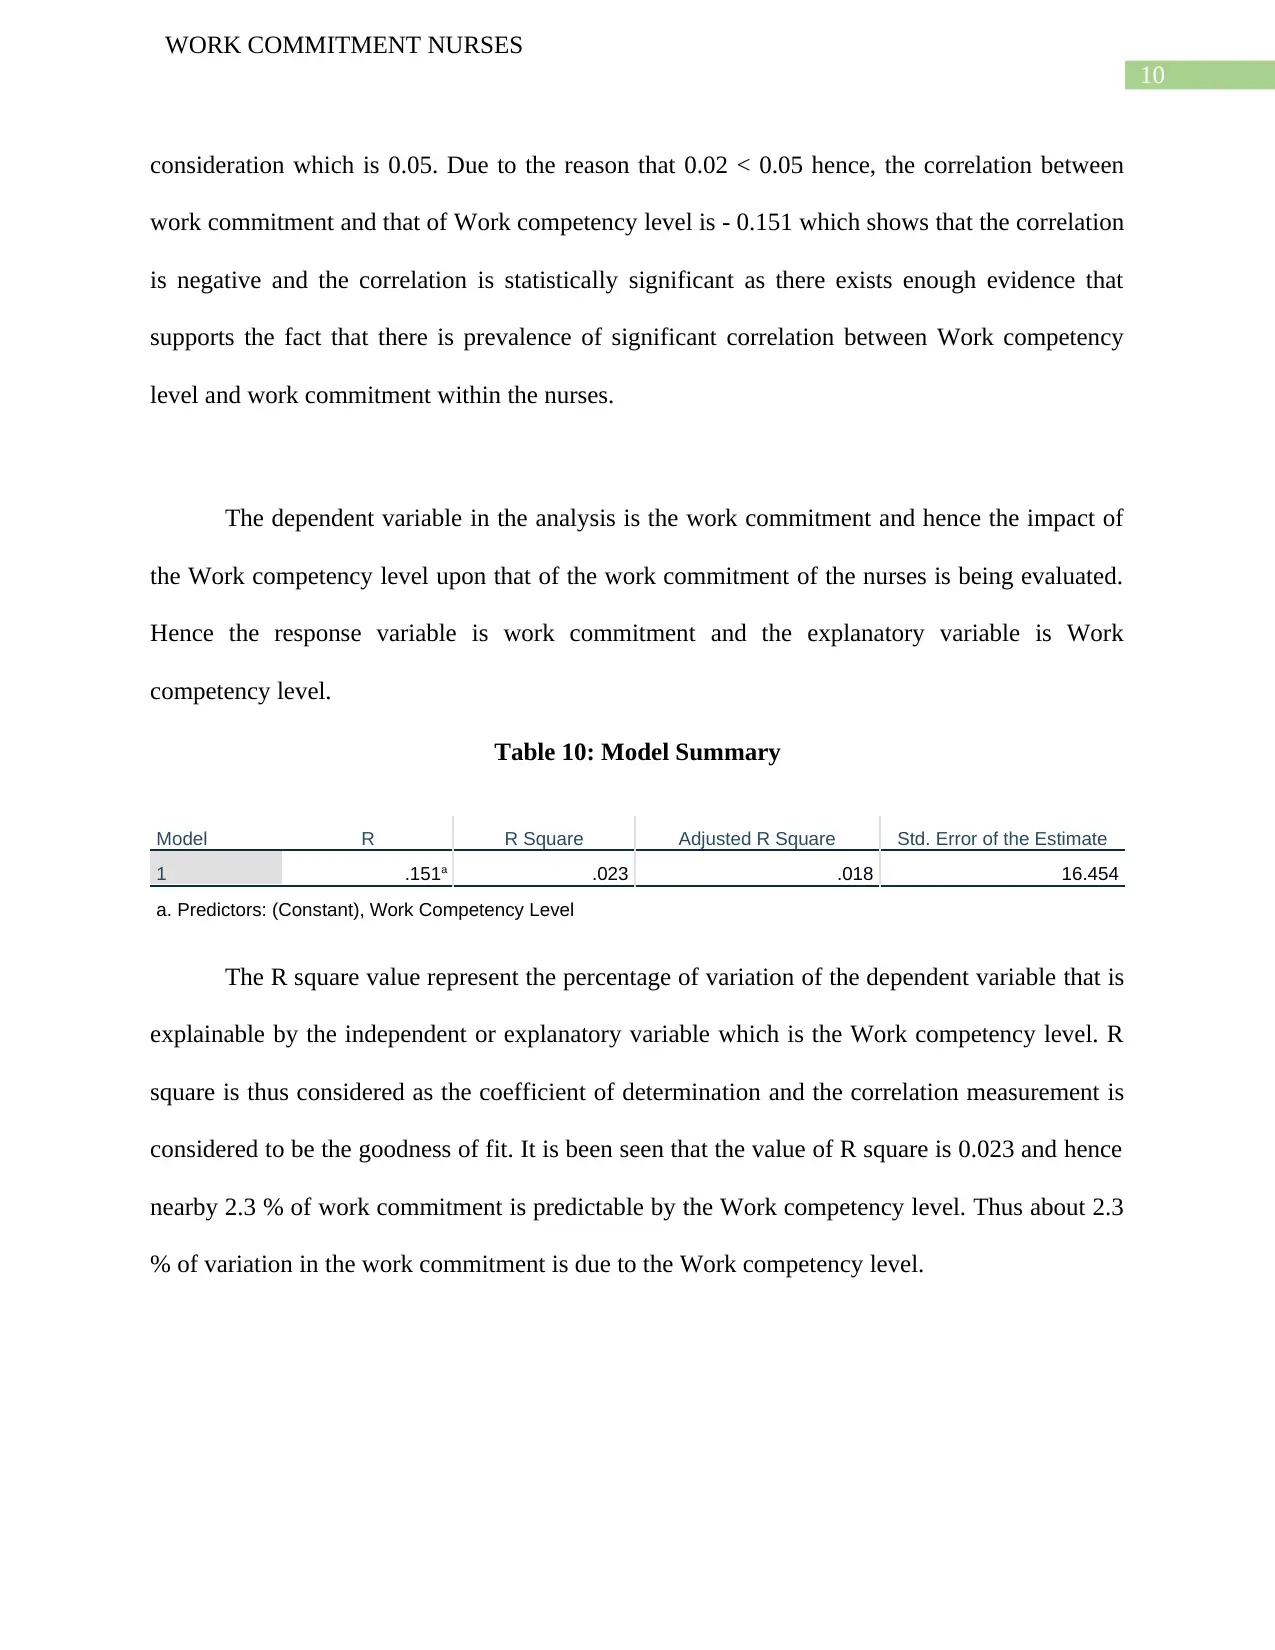
consideration which is 0.05. Due to the reason that 0.02 < 0.05 hence, the correlation between
work commitment and that of Work competency level is - 0.151 which shows that the correlation
is negative and the correlation is statistically significant as there exists enough evidence that
supports the fact that there is prevalence of significant correlation between Work competency
level and work commitment within the nurses.
The dependent variable in the analysis is the work commitment and hence the impact of
the Work competency level upon that of the work commitment of the nurses is being evaluated.
Hence the response variable is work commitment and the explanatory variable is Work
competency level.
Table 10: Model Summary
Model R R Square Adjusted R Square Std. Error of the Estimate
1 .151a .023 .018 16.454
a. Predictors: (Constant), Work Competency Level
The R square value represent the percentage of variation of the dependent variable that is
explainable by the independent or explanatory variable which is the Work competency level. R
square is thus considered as the coefficient of determination and the correlation measurement is
considered to be the goodness of fit. It is been seen that the value of R square is 0.023 and hence
nearby 2.3 % of work commitment is predictable by the Work competency level. Thus about 2.3
% of variation in the work commitment is due to the Work competency level.
WORK COMMITMENT NURSES
consideration which is 0.05. Due to the reason that 0.02 < 0.05 hence, the correlation between
work commitment and that of Work competency level is - 0.151 which shows that the correlation
is negative and the correlation is statistically significant as there exists enough evidence that
supports the fact that there is prevalence of significant correlation between Work competency
level and work commitment within the nurses.
The dependent variable in the analysis is the work commitment and hence the impact of
the Work competency level upon that of the work commitment of the nurses is being evaluated.
Hence the response variable is work commitment and the explanatory variable is Work
competency level.
Table 10: Model Summary
Model R R Square Adjusted R Square Std. Error of the Estimate
1 .151a .023 .018 16.454
a. Predictors: (Constant), Work Competency Level
The R square value represent the percentage of variation of the dependent variable that is
explainable by the independent or explanatory variable which is the Work competency level. R
square is thus considered as the coefficient of determination and the correlation measurement is
considered to be the goodness of fit. It is been seen that the value of R square is 0.023 and hence
nearby 2.3 % of work commitment is predictable by the Work competency level. Thus about 2.3
% of variation in the work commitment is due to the Work competency level.
11
WORK COMMITMENT NURSES
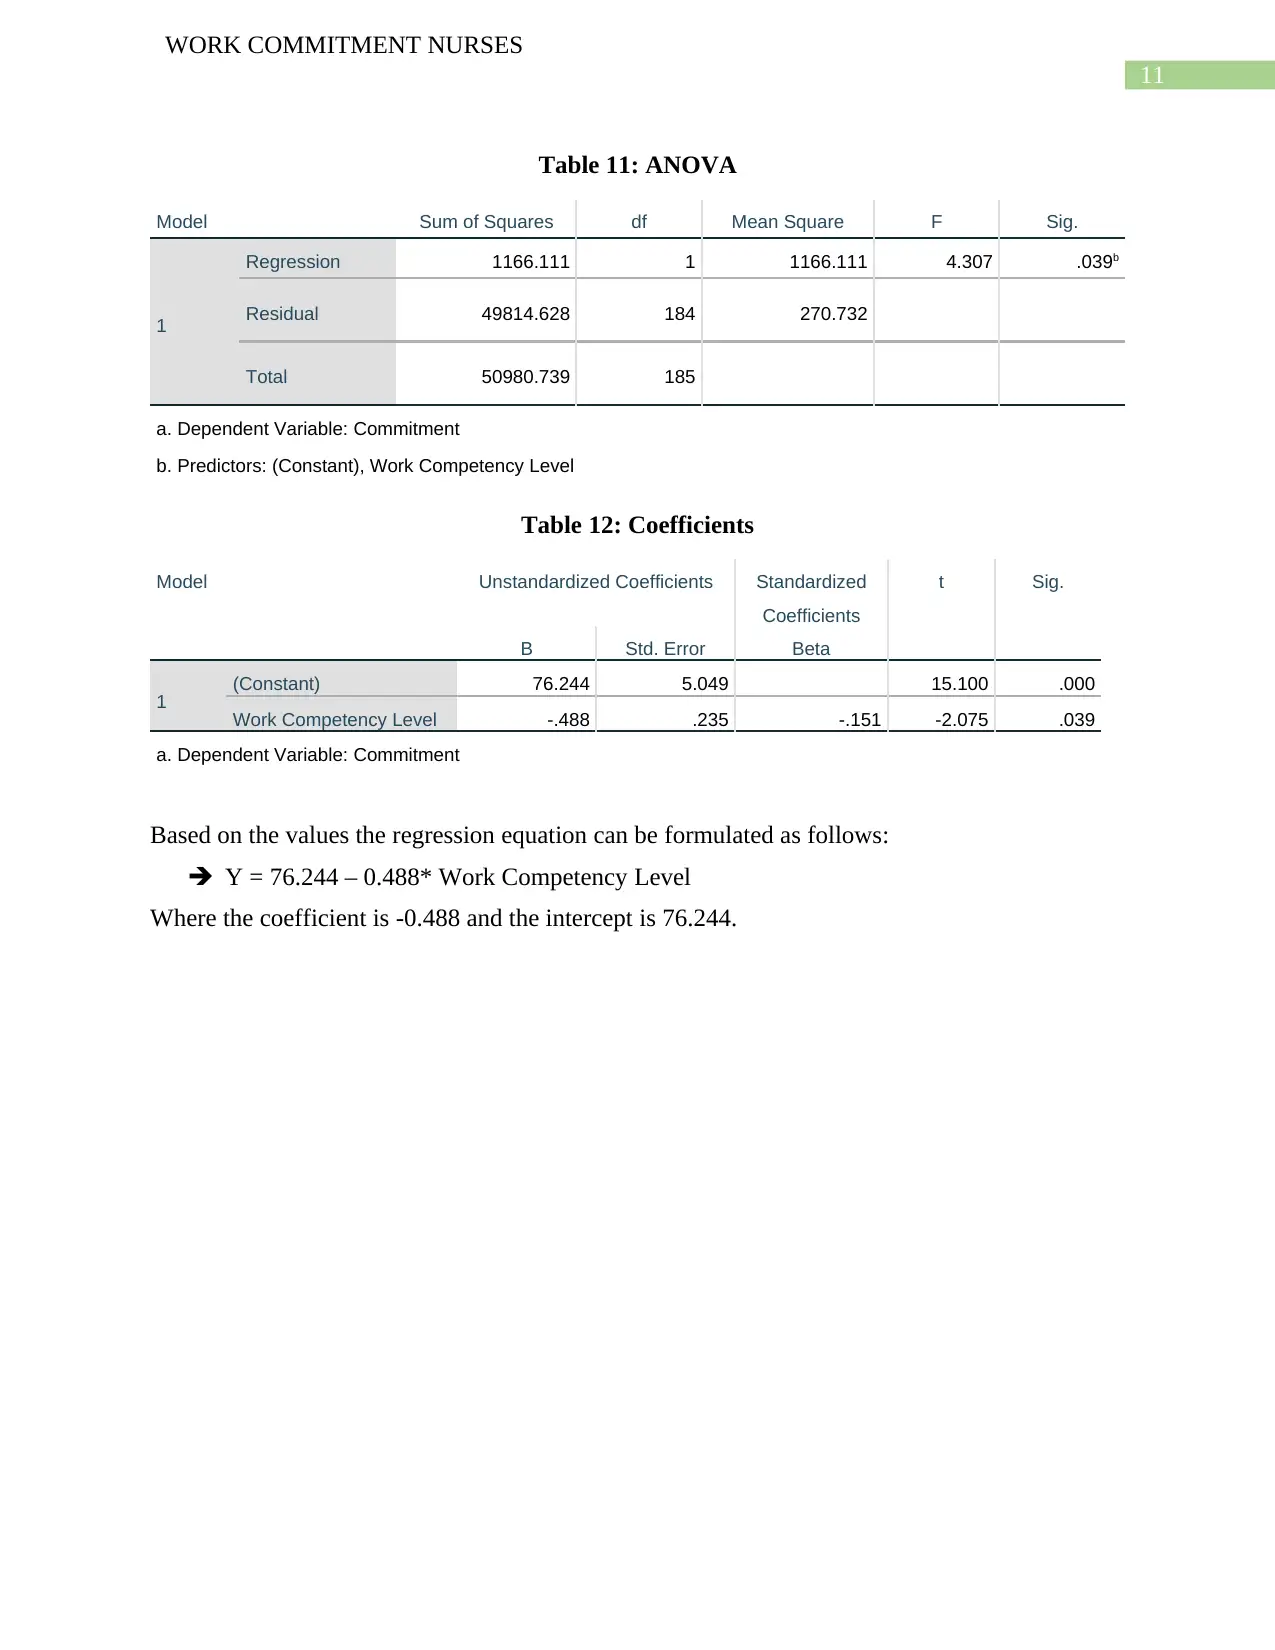
Table 11: ANOVA
Model Sum of Squares df Mean Square F Sig.
1
Regression 1166.111 1 1166.111 4.307 .039b
Residual 49814.628 184 270.732
Total 50980.739 185
a. Dependent Variable: Commitment
b. Predictors: (Constant), Work Competency Level
Table 12: Coefficients
Model Unstandardized Coefficients Standardized
Coefficients
t Sig.
B Std. Error Beta
1 (Constant) 76.244 5.049 15.100 .000
Work Competency Level -.488 .235 -.151 -2.075 .039
a. Dependent Variable: Commitment
Based on the values the regression equation can be formulated as follows:
Y = 76.244 – 0.488* Work Competency Level
Where the coefficient is -0.488 and the intercept is 76.244.
WORK COMMITMENT NURSES
Table 11: ANOVA
Model Sum of Squares df Mean Square F Sig.
1
Regression 1166.111 1 1166.111 4.307 .039b
Residual 49814.628 184 270.732
Total 50980.739 185
a. Dependent Variable: Commitment
b. Predictors: (Constant), Work Competency Level
Table 12: Coefficients
Model Unstandardized Coefficients Standardized
Coefficients
t Sig.
B Std. Error Beta
1 (Constant) 76.244 5.049 15.100 .000
Work Competency Level -.488 .235 -.151 -2.075 .039
a. Dependent Variable: Commitment
Based on the values the regression equation can be formulated as follows:
Y = 76.244 – 0.488* Work Competency Level
Where the coefficient is -0.488 and the intercept is 76.244.
⊘ This is a preview!⊘
Do you want full access?
Subscribe today to unlock all pages.
Trusted by 1+ million students worldwide
1 out of 25
Related Documents


Your All-in-One AI-Powered Toolkit for Academic Success.
+13062052269
info@desklib.com
Available 24*7 on WhatsApp / Email
![[object Object]](/_next/static/media/star-bottom.7253800d.svg)
Unlock your academic potential
Copyright © 2020–2026 A2Z Services. All Rights Reserved. Developed and managed by ZUCOL.