Project Report: Analyzing Consumer Preferences for Organic Snacks
VerifiedAdded on 2023/04/21
|7
|900
|104
Report
AI Summary
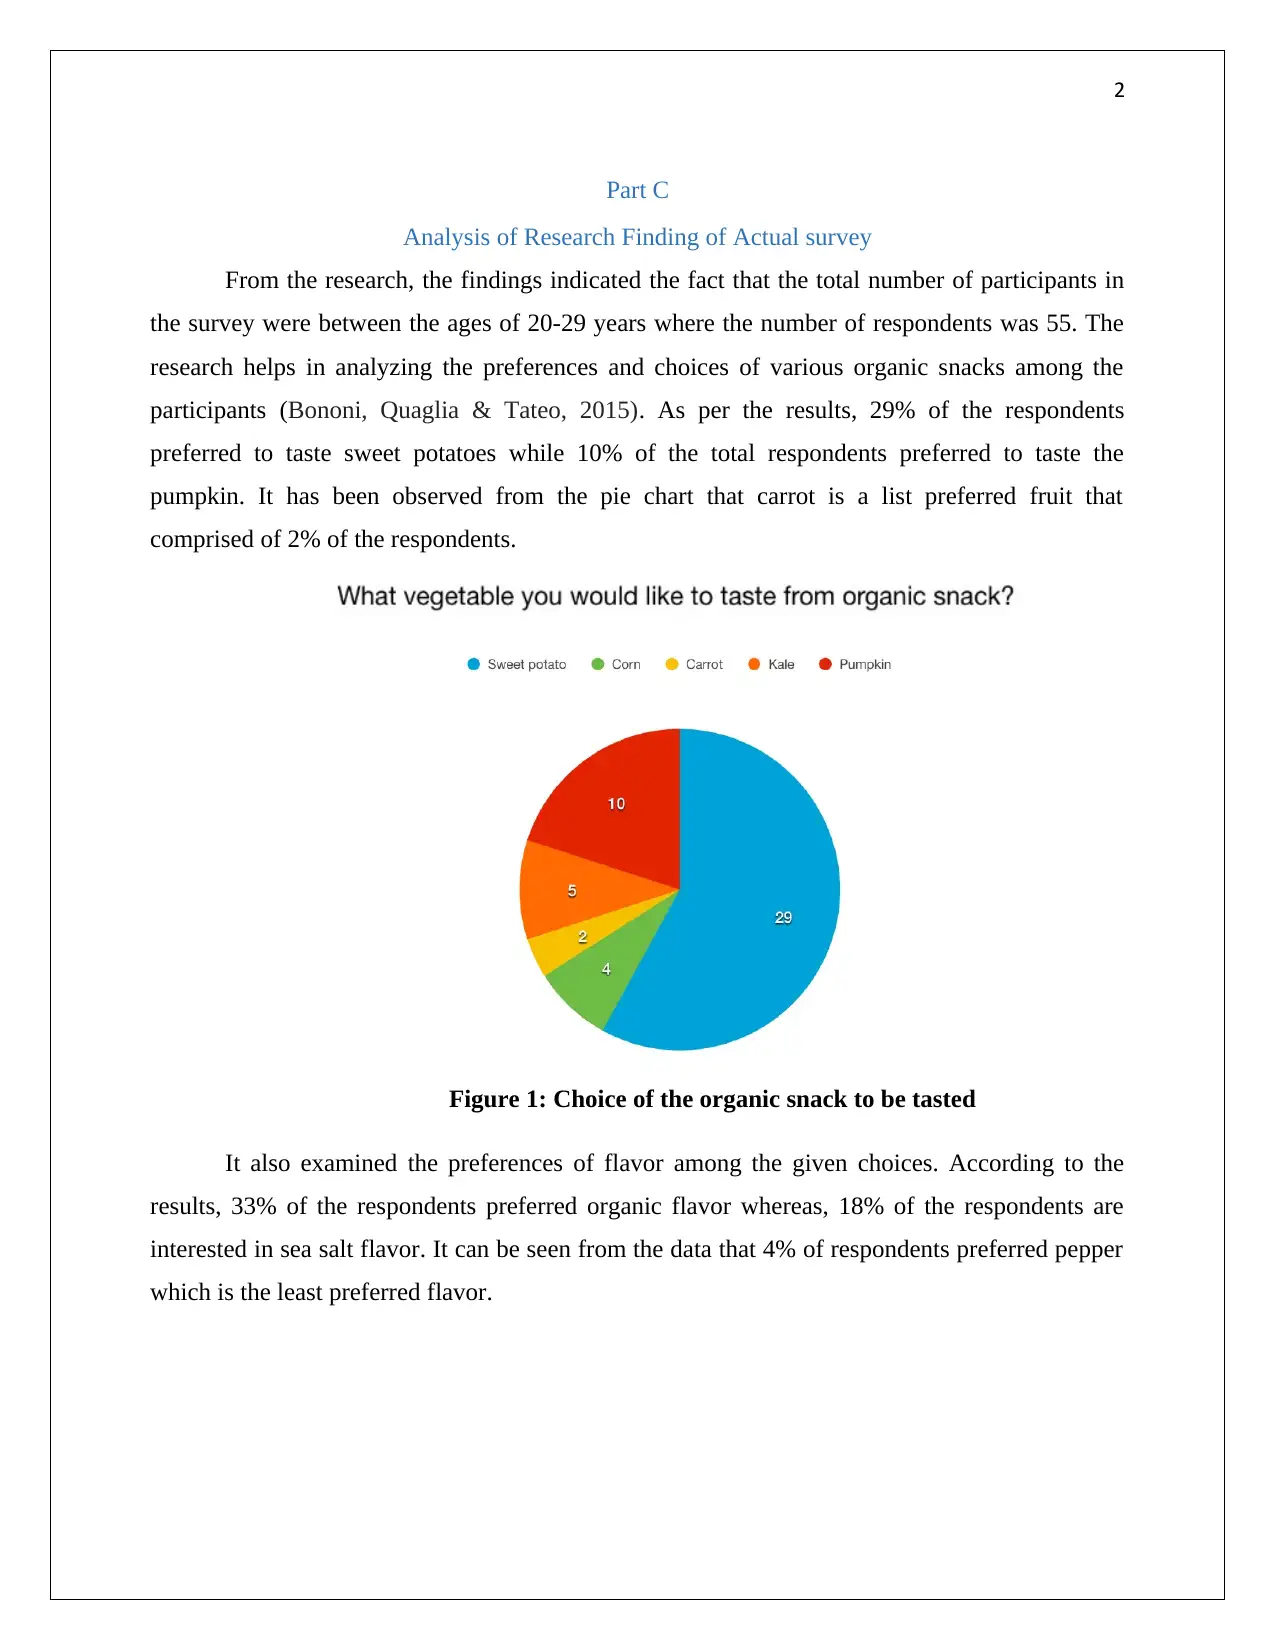
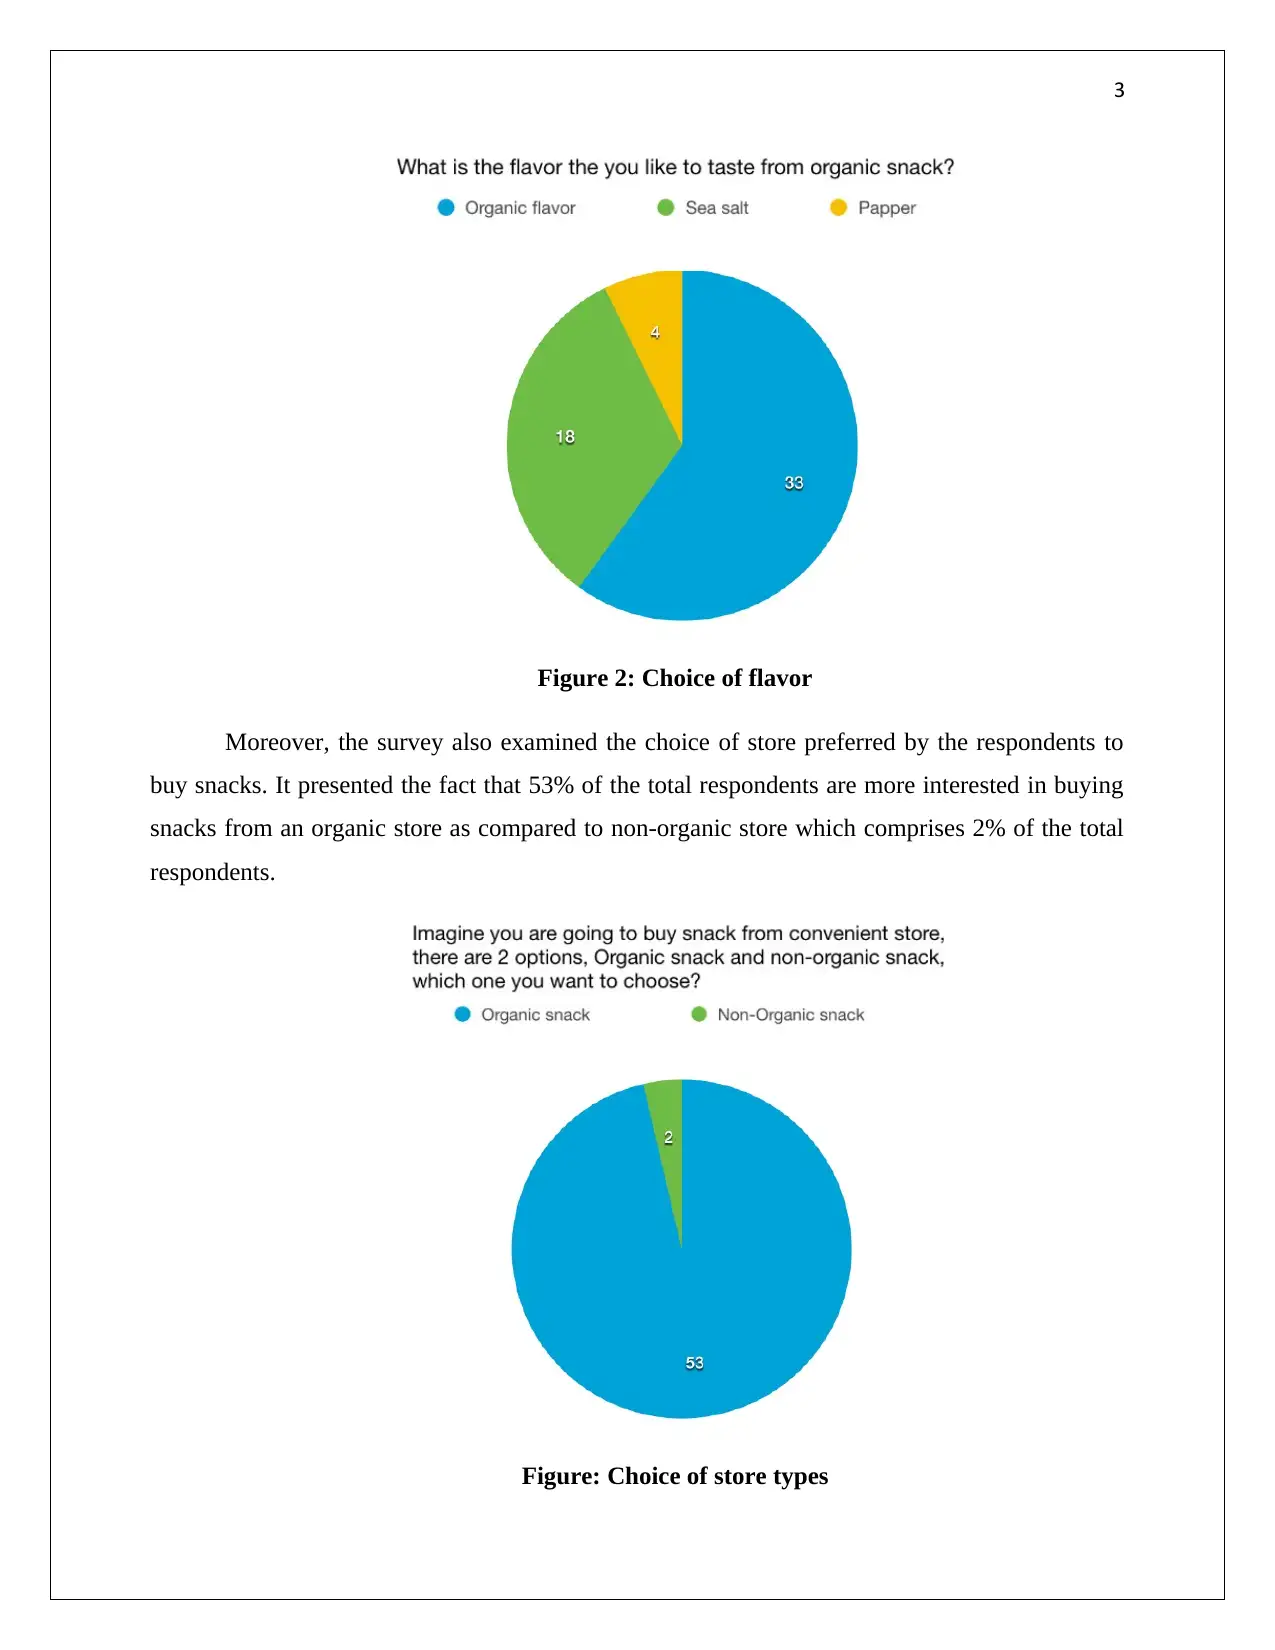
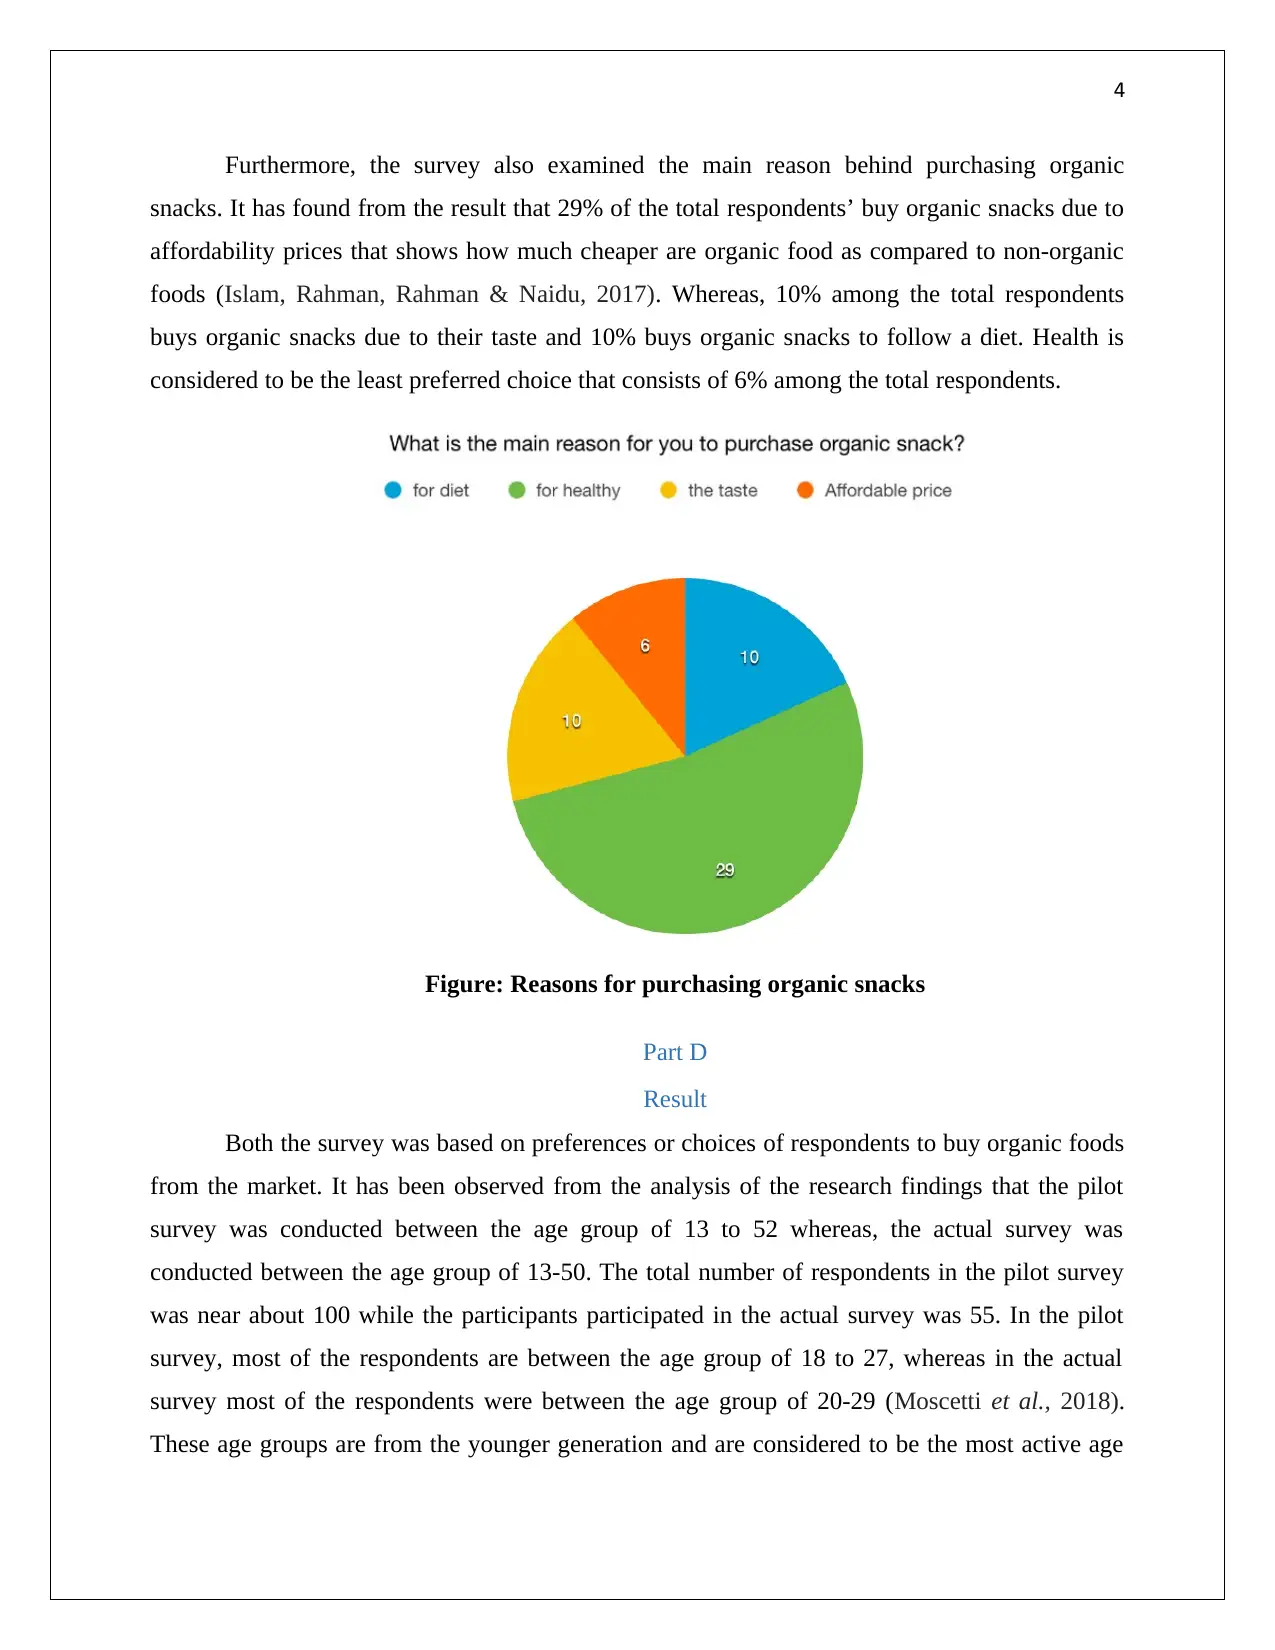
This report presents an analysis of a survey conducted to understand consumer preferences for organic snacks. The study focuses on respondents aged 20-29, examining their choices in terms of snack type, flavor, preferred store, and reasons for purchasing organic snacks. The findings indicate a preference for sweet potatoes and organic flavor, with most respondents favoring organic stores for their purchases, driven primarily by affordability. The report also compares the actual survey with a pilot survey, highlighting improvements in the questions and a sharper focus on organic snack preferences. The survey results are presented through pie charts, providing a clear visual representation of consumer choices. This analysis is crucial for businesses in the organic food sector to understand consumer behavior and tailor their offerings accordingly. Desklib provides similar solved assignments and study tools for students.

Multidisciplinary Project
Student’s Name:
Student’s ID:
Subject:
Student’s Name:
Student’s ID:
Subject:
Paraphrase This Document
Need a fresh take? Get an instant paraphrase of this document with our AI Paraphraser

1
Table of Contents
Part C...........................................................................................................................................................2
Analysis of Research Finding of Actual survey.......................................................................................2
Part D..........................................................................................................................................................4
Result.......................................................................................................................................................4
References...................................................................................................................................................6

2
Part C
Analysis of Research Finding of Actual survey
From the research, the findings indicated the fact that the total number of participants in
the survey were between the ages of 20-29 years where the number of respondents was 55. The
research helps in analyzing the preferences and choices of various organic snacks among the
participants (Bononi, Quaglia & Tateo, 2015). As per the results, 29% of the respondents
preferred to taste sweet potatoes while 10% of the total respondents preferred to taste the
pumpkin. It has been observed from the pie chart that carrot is a list preferred fruit that
comprised of 2% of the respondents.
Figure 1: Choice of the organic snack to be tasted
It also examined the preferences of flavor among the given choices. According to the
results, 33% of the respondents preferred organic flavor whereas, 18% of the respondents are
interested in sea salt flavor. It can be seen from the data that 4% of respondents preferred pepper
which is the least preferred flavor.
⊘ This is a preview!⊘
Do you want full access?
Subscribe today to unlock all pages.

Trusted by 1+ million students worldwide

3
Figure 2: Choice of flavor
Moreover, the survey also examined the choice of store preferred by the respondents to
buy snacks. It presented the fact that 53% of the total respondents are more interested in buying
snacks from an organic store as compared to non-organic store which comprises 2% of the total
respondents.
Figure: Choice of store types
Paraphrase This Document
Need a fresh take? Get an instant paraphrase of this document with our AI Paraphraser

4
Furthermore, the survey also examined the main reason behind purchasing organic
snacks. It has found from the result that 29% of the total respondents’ buy organic snacks due to
affordability prices that shows how much cheaper are organic food as compared to non-organic
foods (Islam, Rahman, Rahman & Naidu, 2017). Whereas, 10% among the total respondents
buys organic snacks due to their taste and 10% buys organic snacks to follow a diet. Health is
considered to be the least preferred choice that consists of 6% among the total respondents.
Figure: Reasons for purchasing organic snacks
Part D
Result
Both the survey was based on preferences or choices of respondents to buy organic foods
from the market. It has been observed from the analysis of the research findings that the pilot
survey was conducted between the age group of 13 to 52 whereas, the actual survey was
conducted between the age group of 13-50. The total number of respondents in the pilot survey
was near about 100 while the participants participated in the actual survey was 55. In the pilot
survey, most of the respondents are between the age group of 18 to 27, whereas in the actual
survey most of the respondents were between the age group of 20-29 (Moscetti et al., 2018).
These age groups are from the younger generation and are considered to be the most active age

5
group among the respondents. Another difference is that the pilot survey consists of eight
questions while the actual survey possesses five questions that were asked to the participants.
Most of the questions in the pilot survey differ from the questions presented in the actual survey.
There has been a great improvement in the actual survey questions as compared to the
questions that were presented in the pilot survey. The questions in the pilot survey were
generally based on the likes and dislikes of the organic and non-organic vegetables that do not
provides sufficient information about organic snacks. On the other hand, actual survey questions
were entirely based on choices or preferences from organic snacks (Bryła, 2017). The questions
help in gaining knowledge about choosing organic snacks instead of non-organic snacks.
Therefore, the pie chart presents the results of the questions.
⊘ This is a preview!⊘
Do you want full access?
Subscribe today to unlock all pages.

Trusted by 1+ million students worldwide

6
References
Bononi, M., Quaglia, G., & Tateo, F. (2015). Easy extraction method to evaluate δ13C vanillin
by liquid chromatography–isotopic ratio mass spectrometry in chocolate bars and
chocolate snack foods. Journal of agricultural and food chemistry, 63(19), 4777-4781.
Bryła, P. (2017). Creating and Delivering Value for Consumers of Healthy Food–a Case Study
of Organic Farma Zdrowia SA. Journal of Management and Business Administration.
Central Europe, 25(4), 55-74.
Islam, S., Rahman, M. M., Rahman, M. A., & Naidu, R. (2017). Inorganic arsenic in rice and
rice-based diets: Health risk assessment. Food Control, 82, 196-202.
Moscetti, R., Raponi, F., Ferri, S., Colantoni, A., Monarca, D., & Massantini, R. (2018). Real-
time monitoring of organic apple (var. Gala) during hot-air drying using near-infrared
spectroscopy. Journal of Food Engineering, 222, 139-150.
1 out of 7
Related Documents

Your All-in-One AI-Powered Toolkit for Academic Success.
+13062052269
info@desklib.com
Available 24*7 on WhatsApp / Email
Unlock your academic potential
Copyright © 2020–2025 A2Z Services. All Rights Reserved. Developed and managed by ZUCOL.