Statistics Assignment: Analyzing Startup Costs and Regression Modeling

Verified

Added on  2020/03/23

|11
|439
|100
Homework Assignment
AI Summary
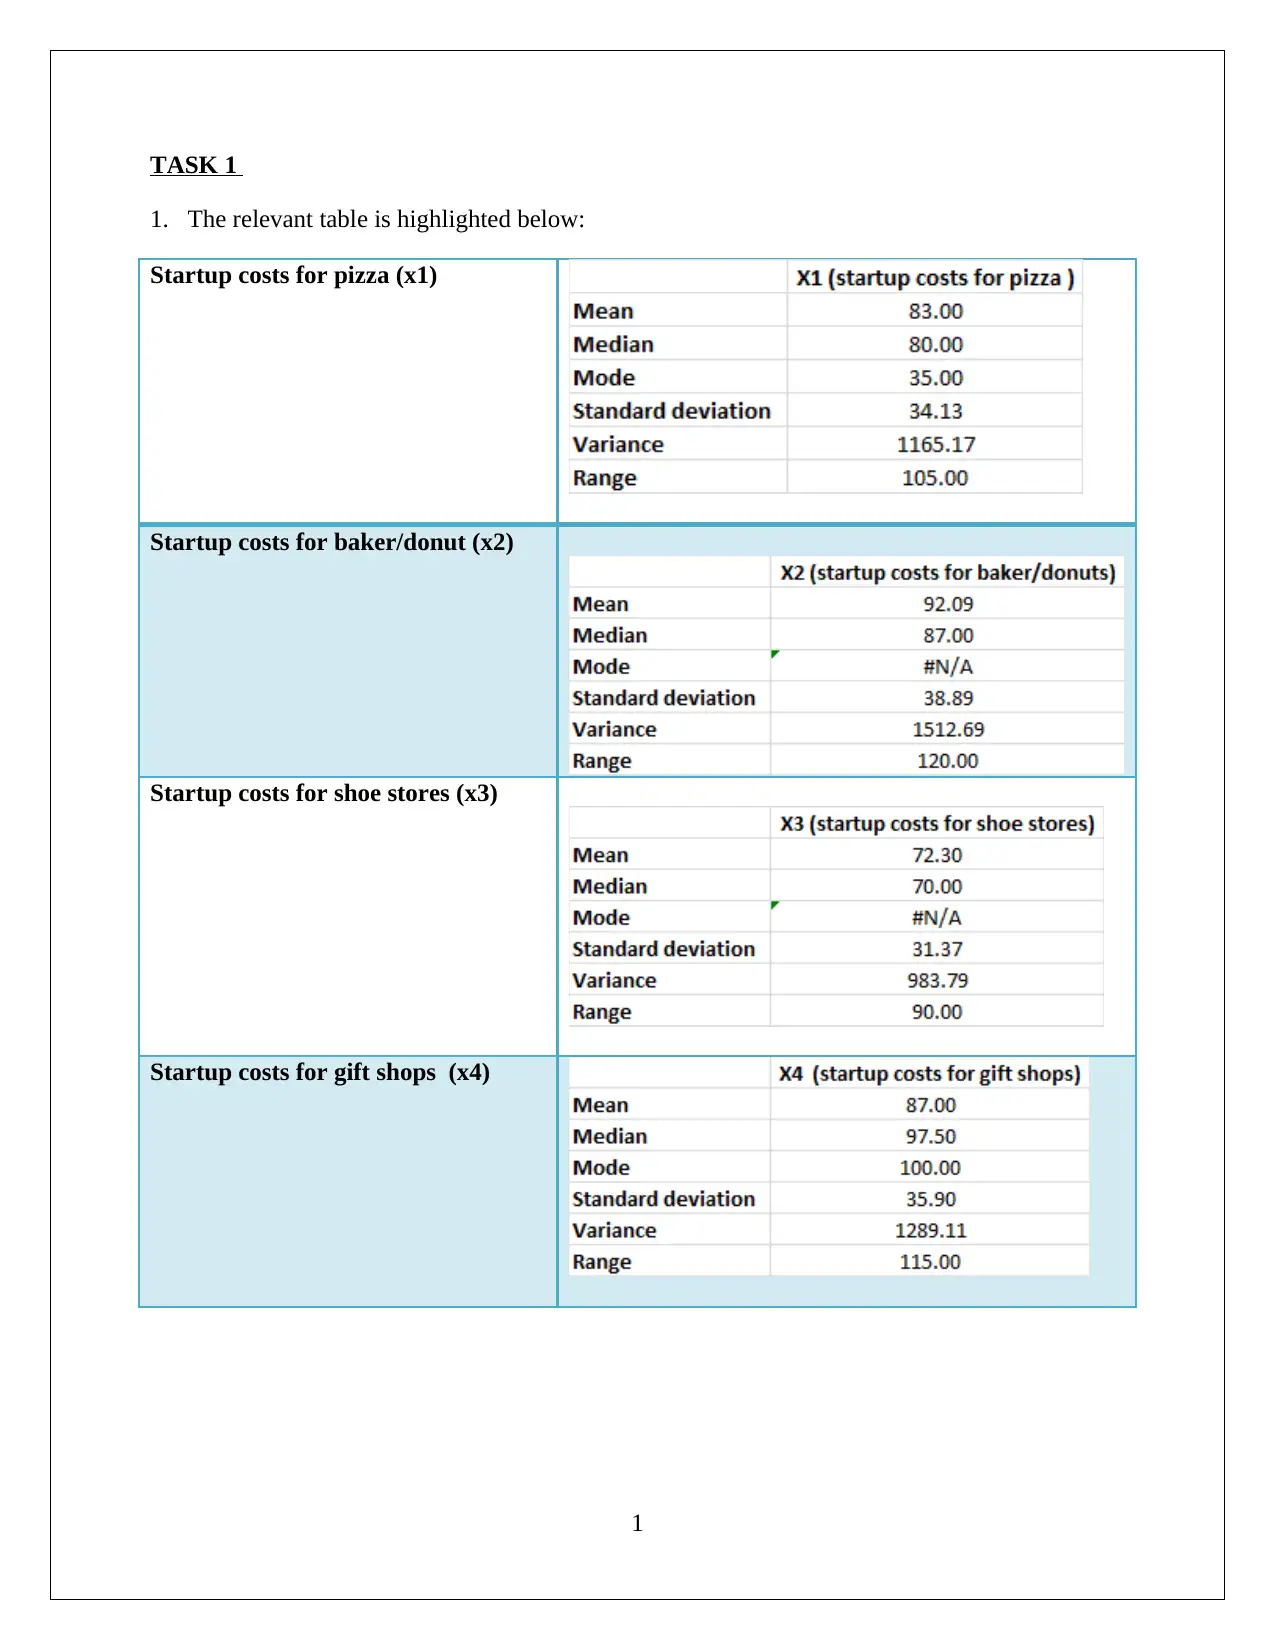
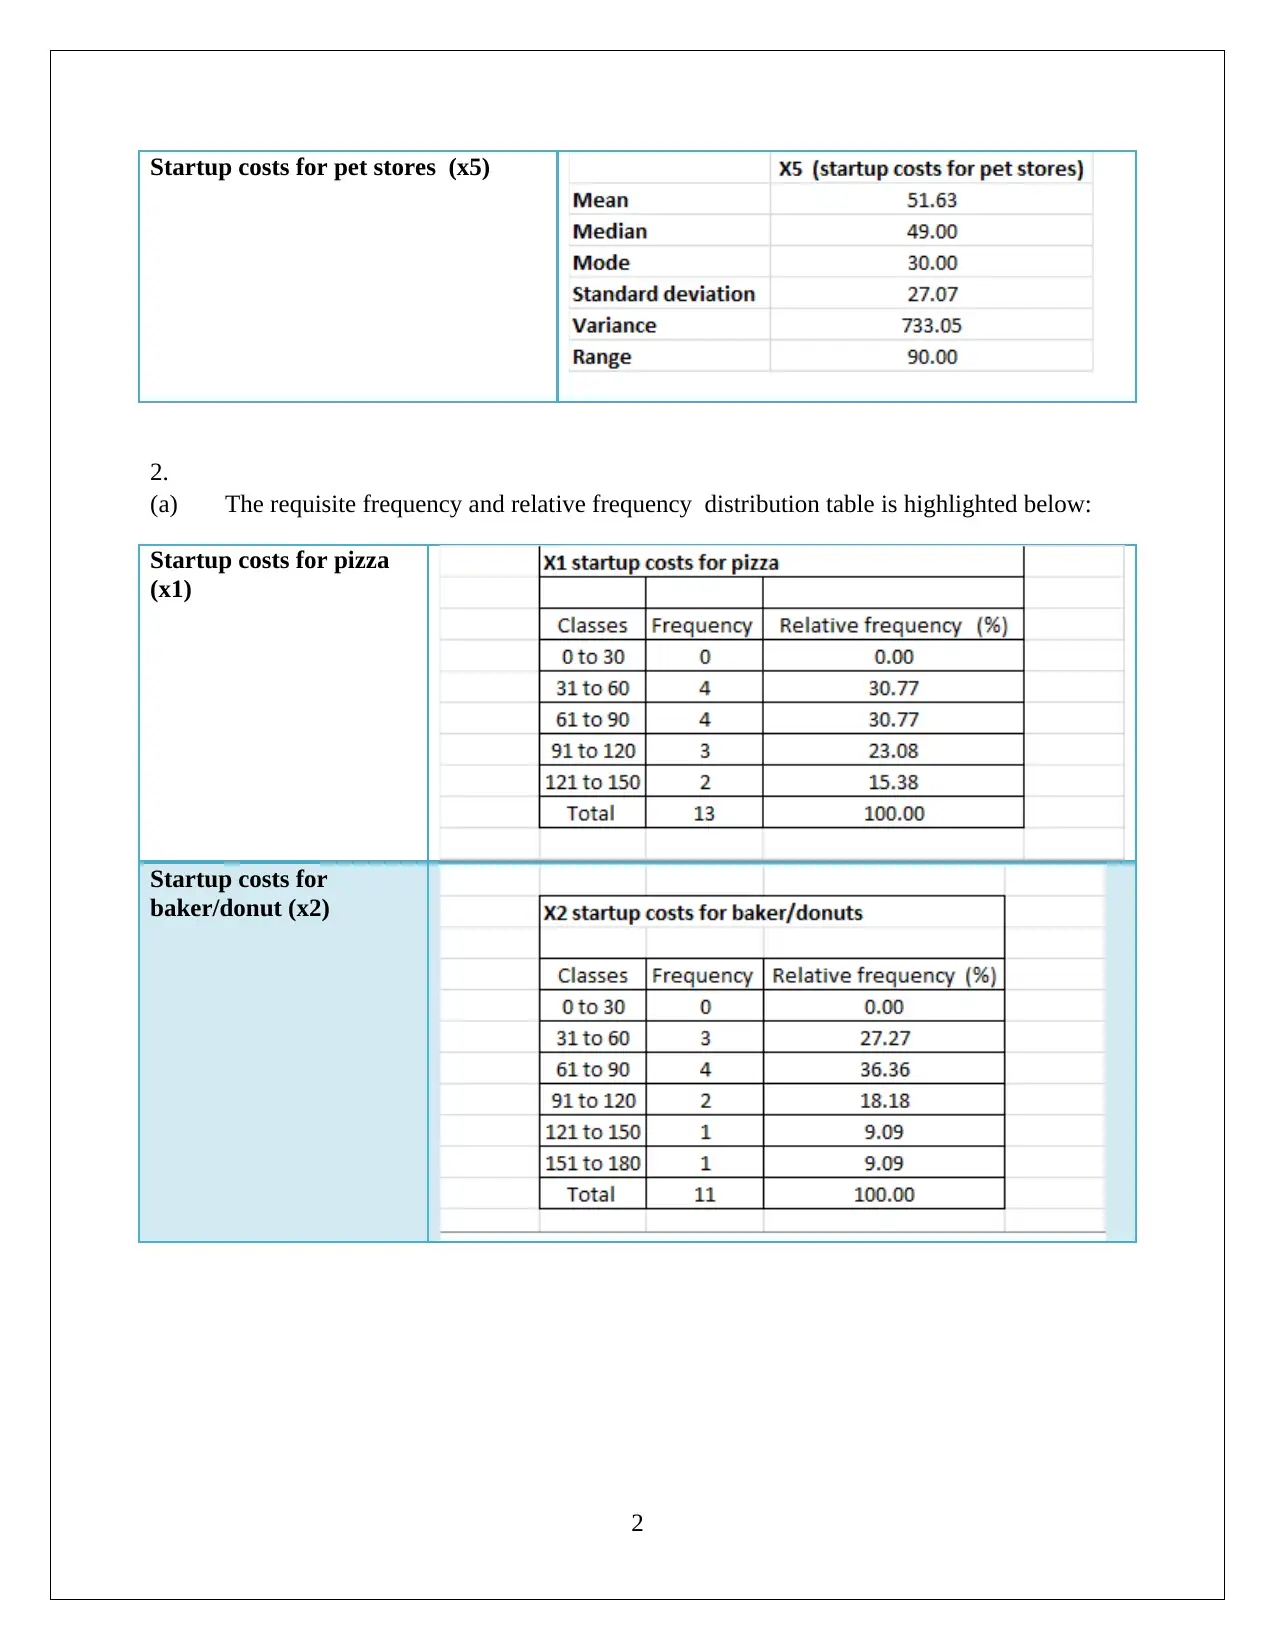
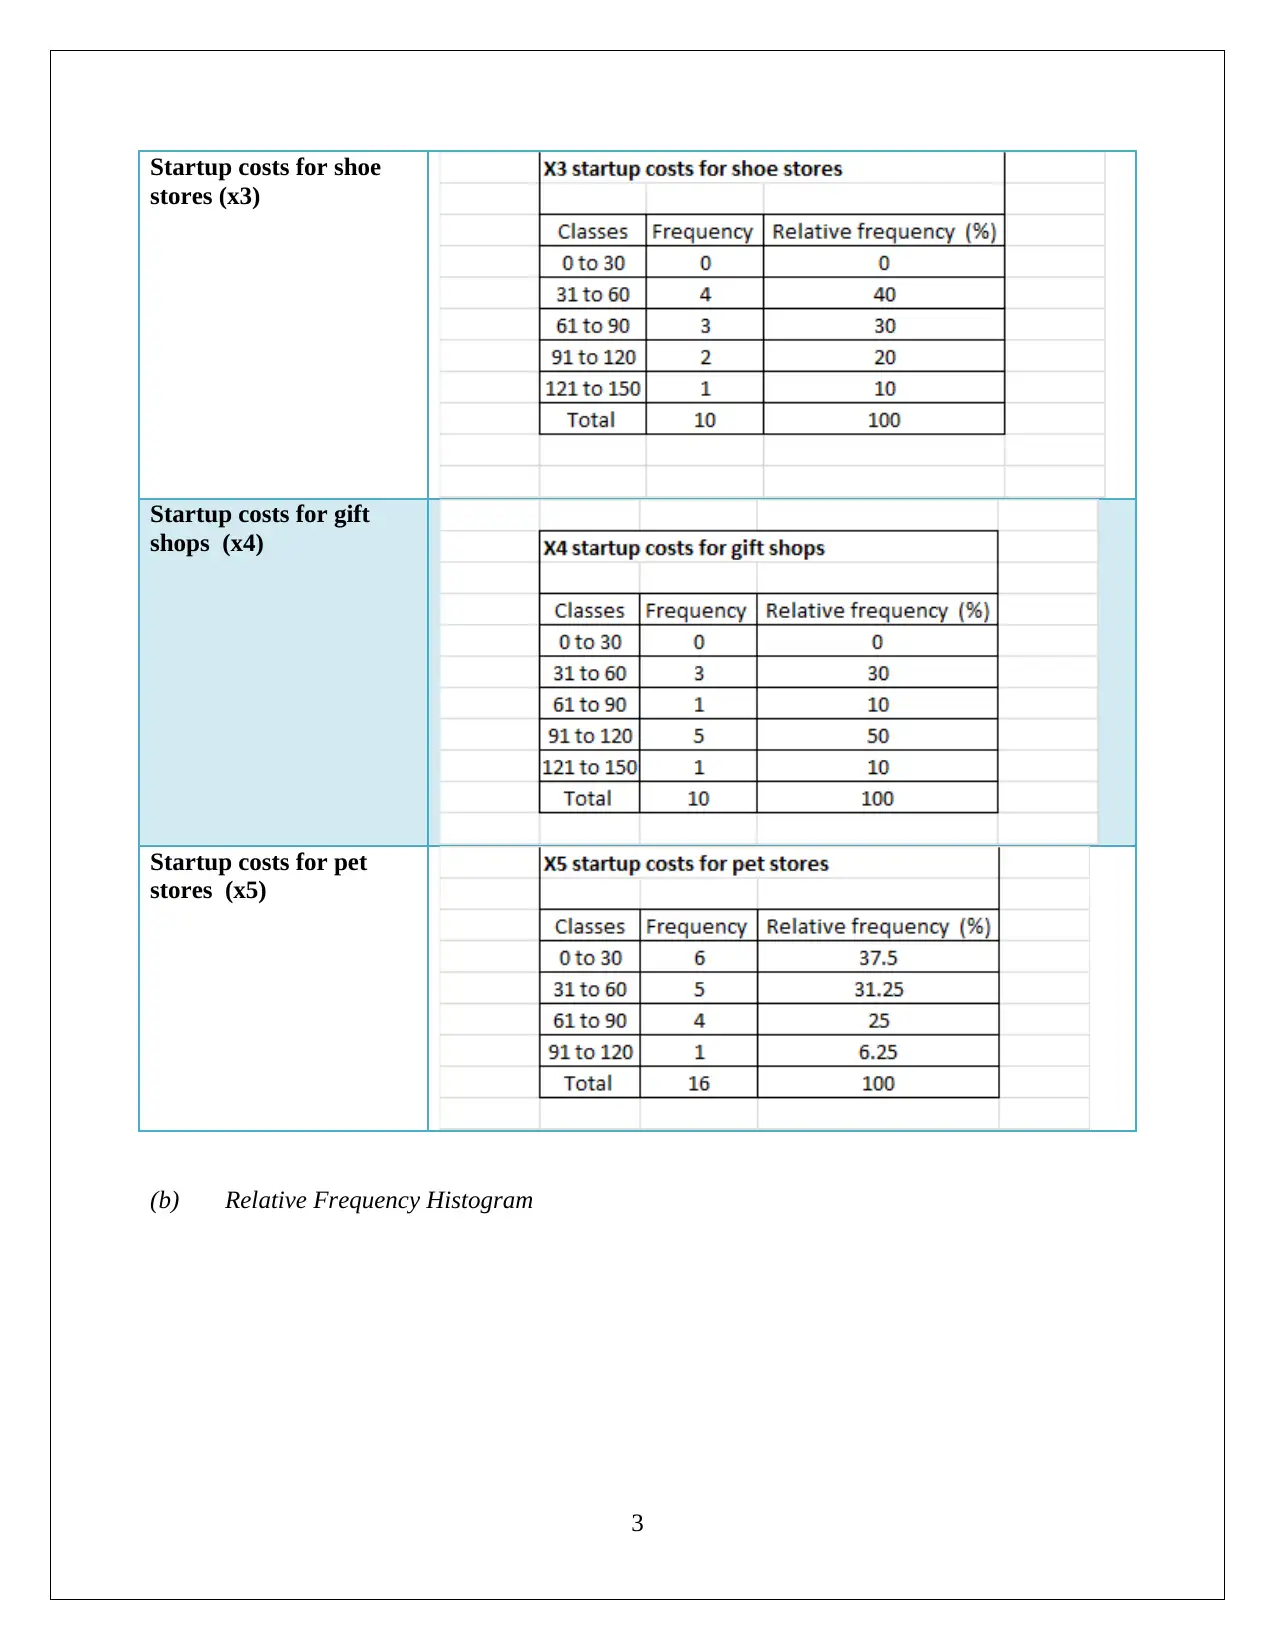
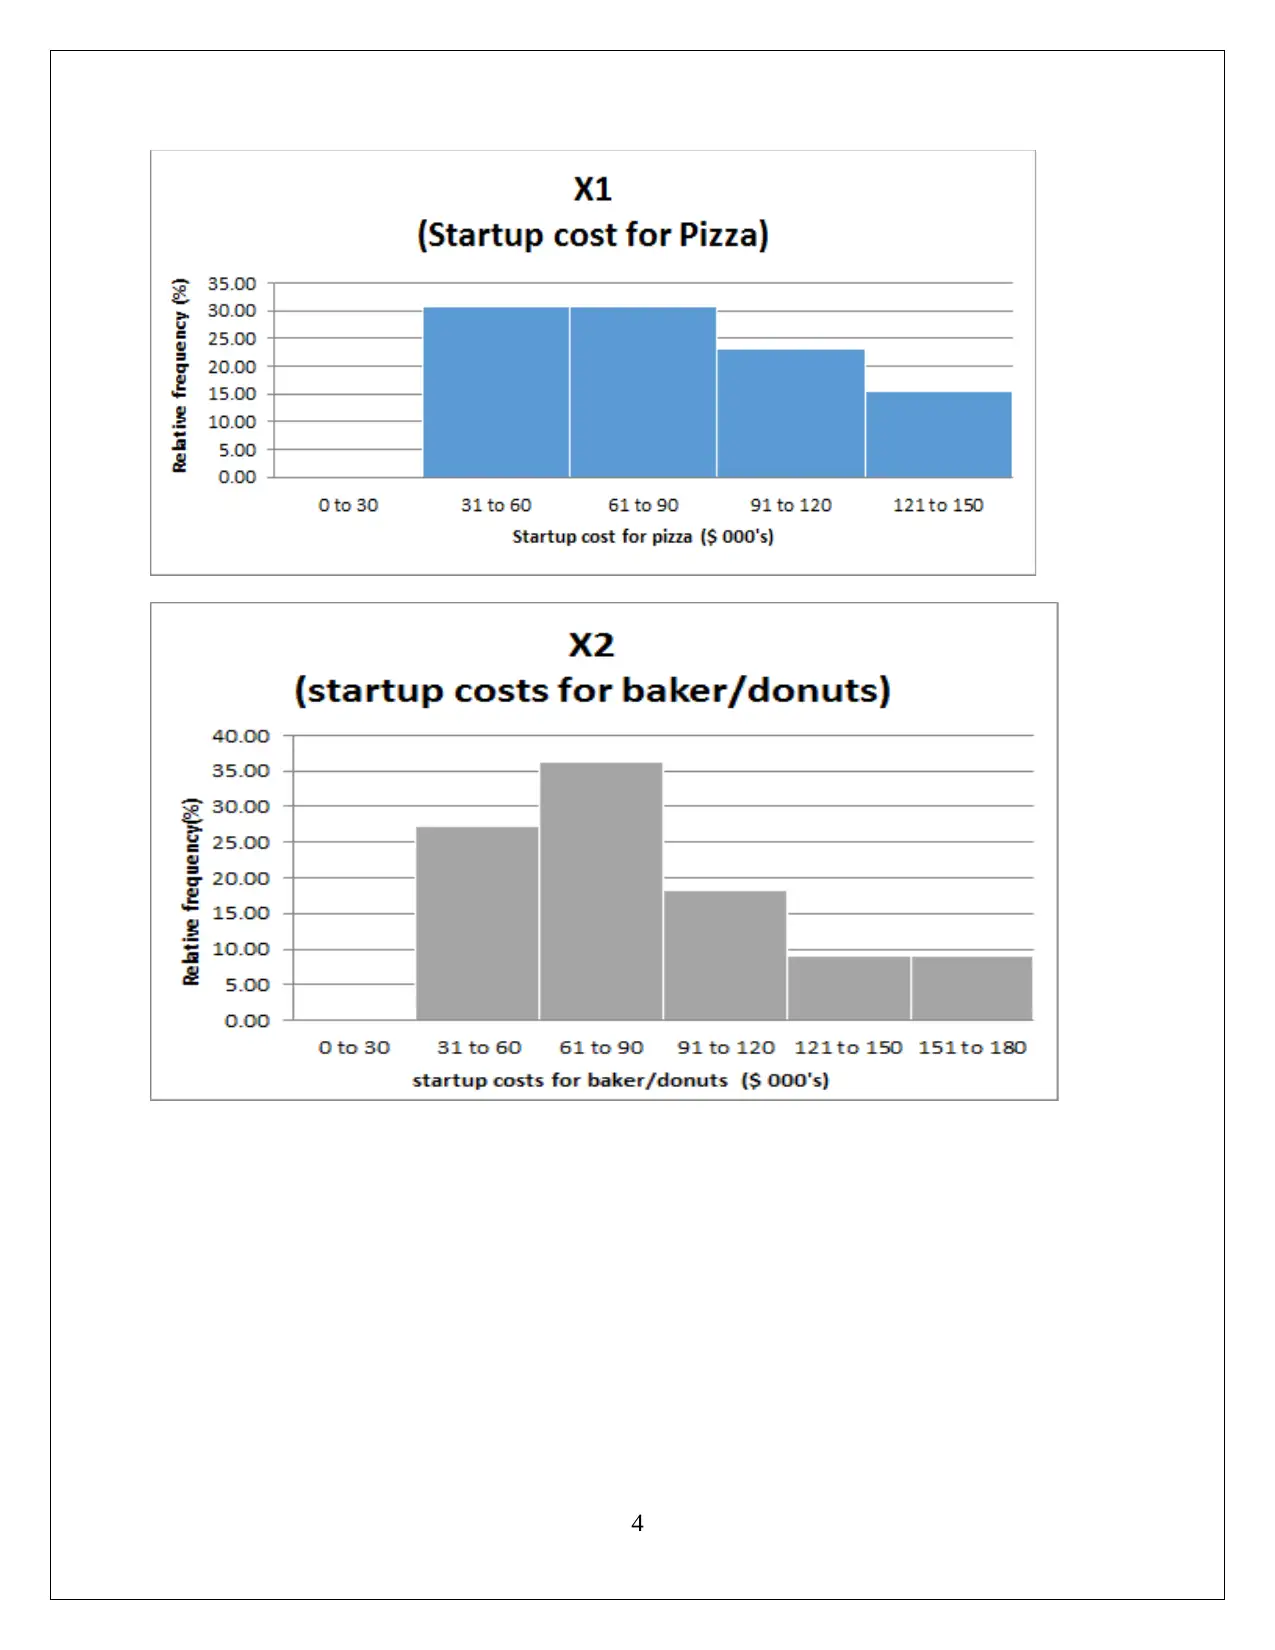
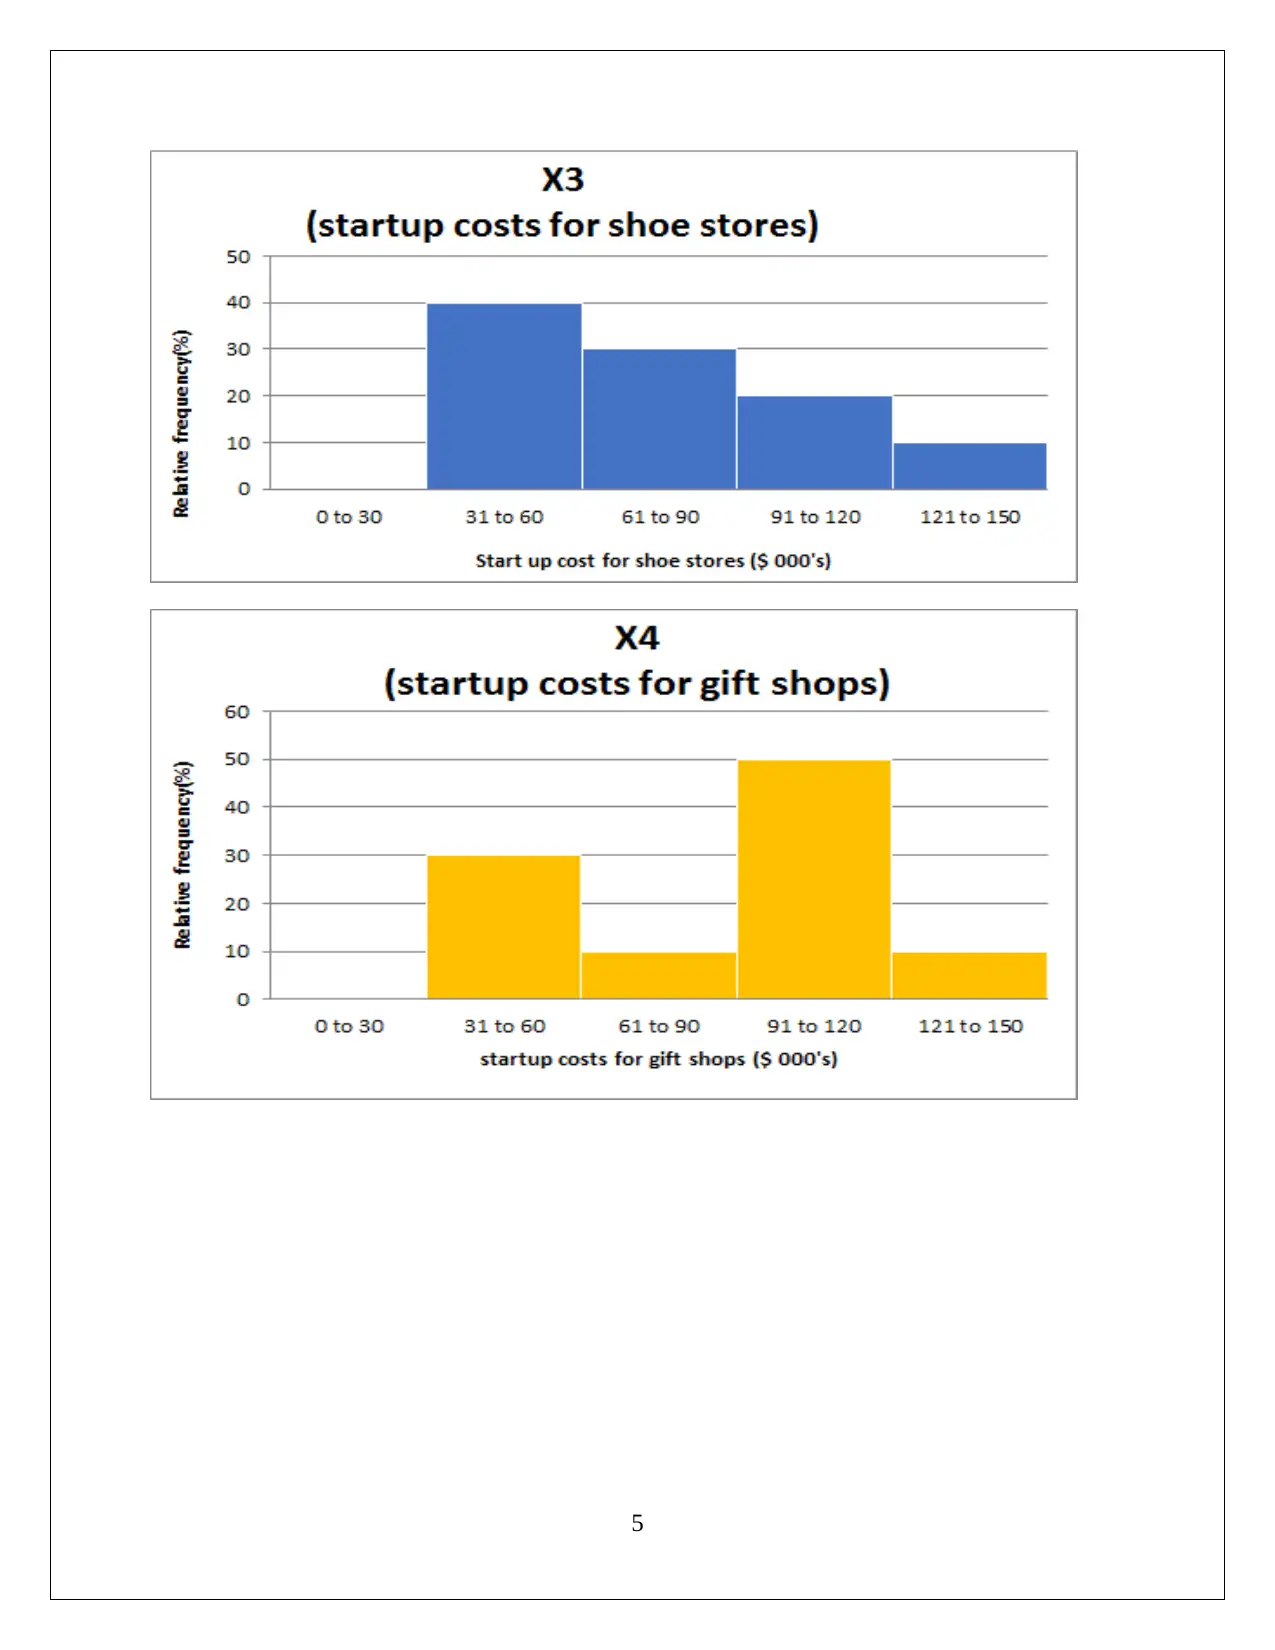
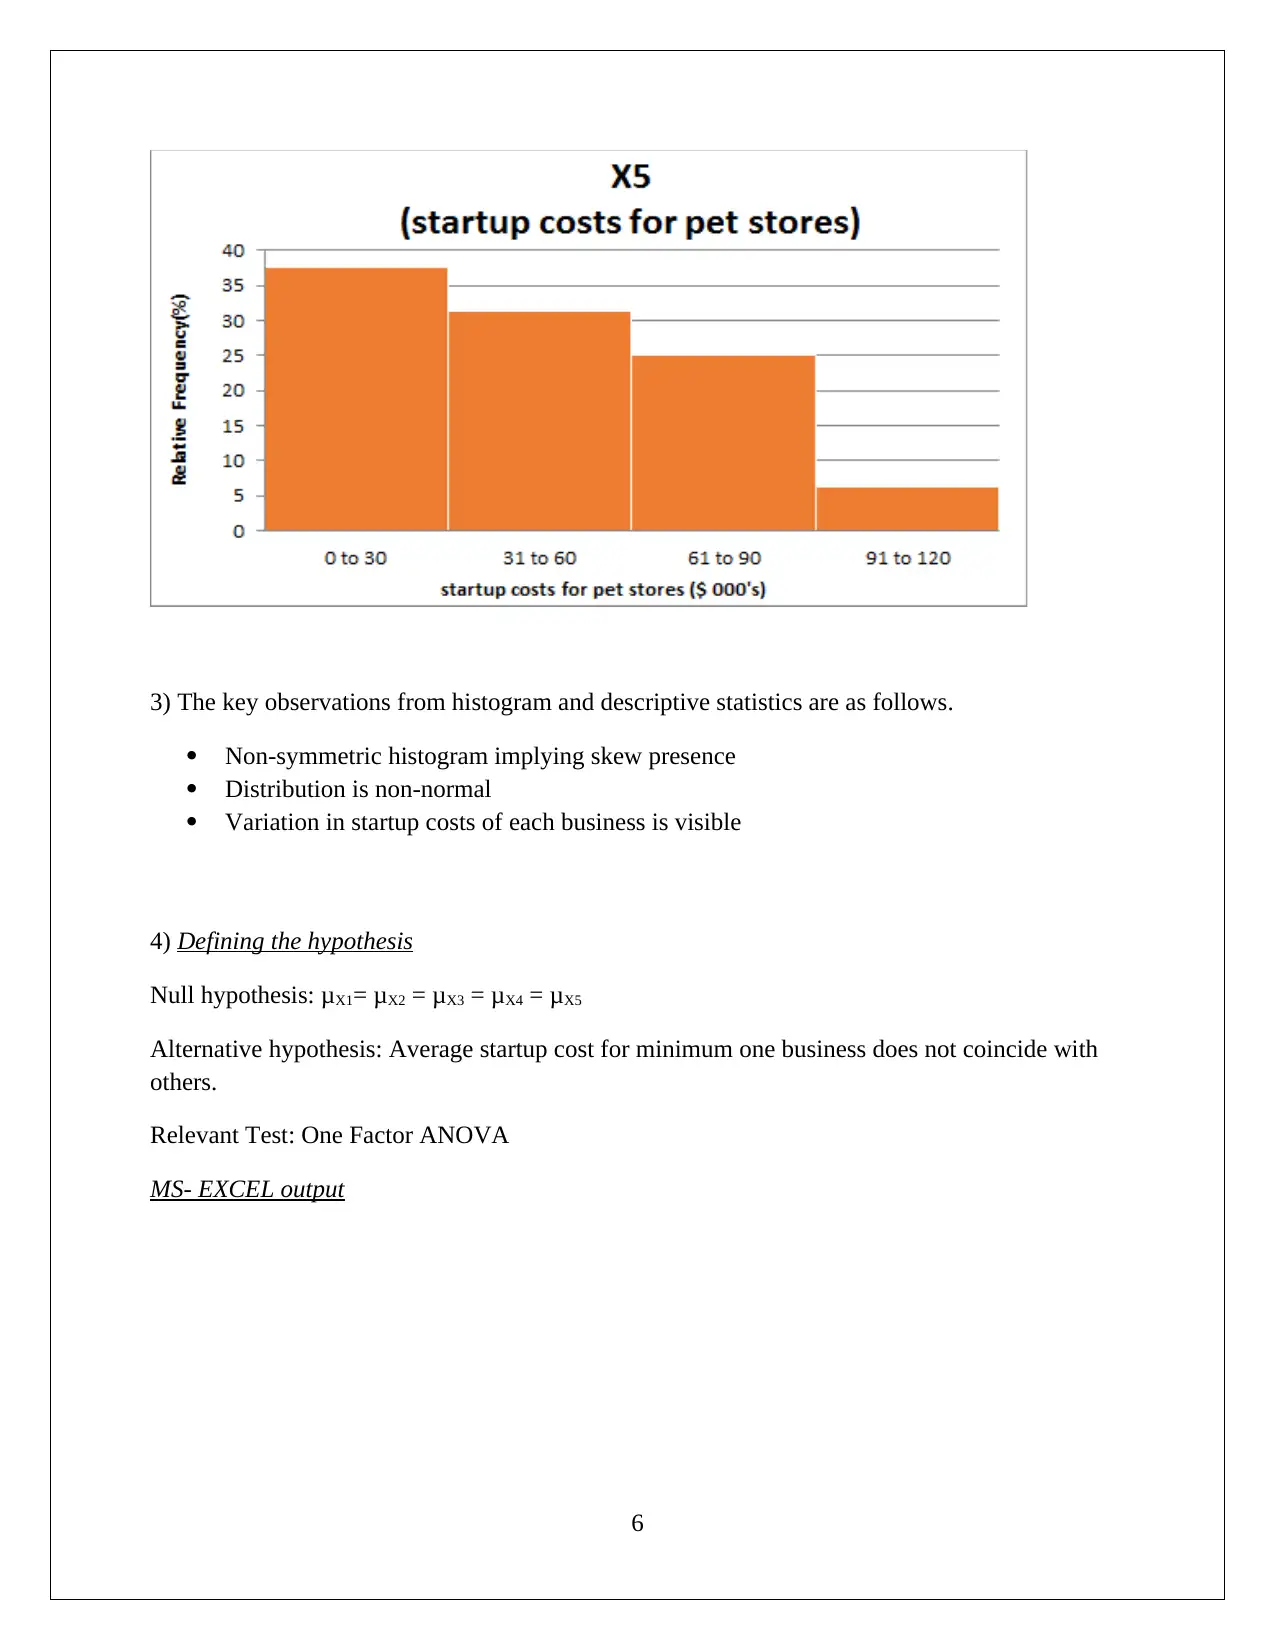
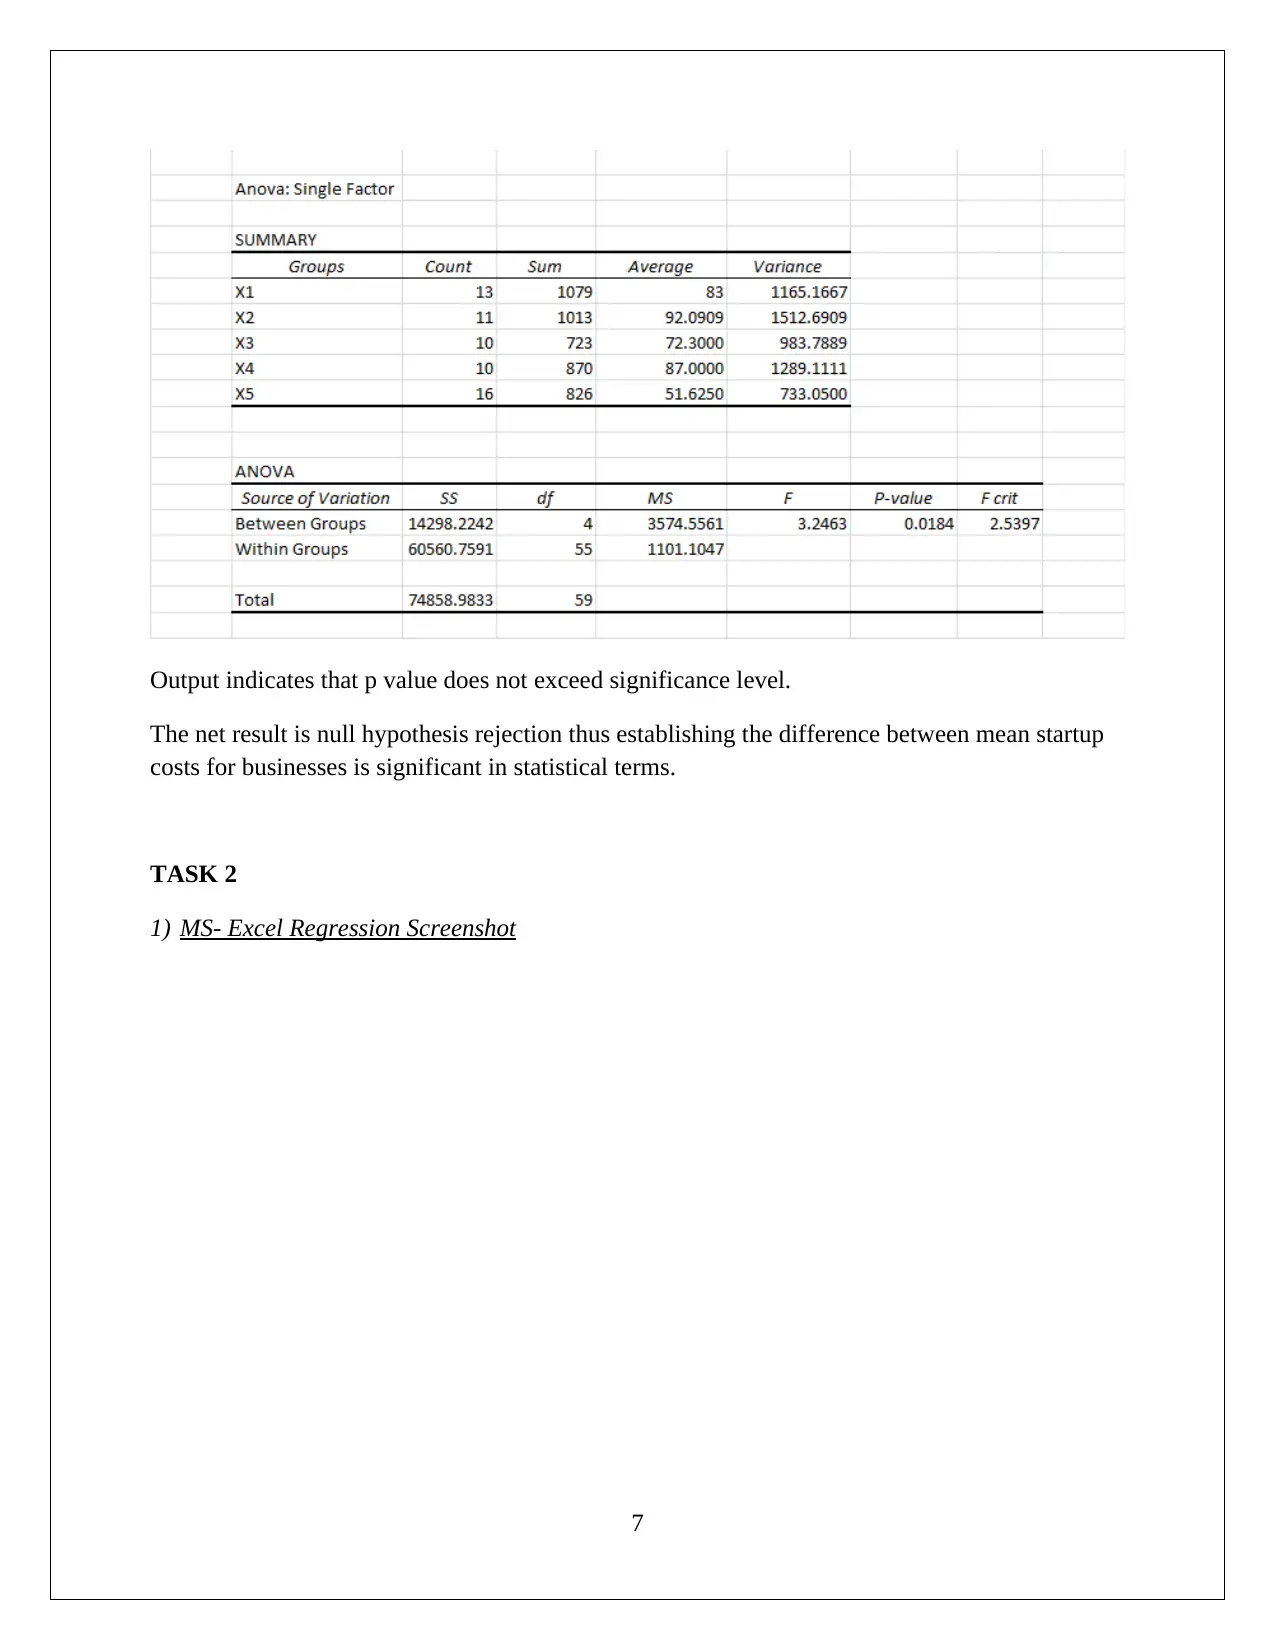
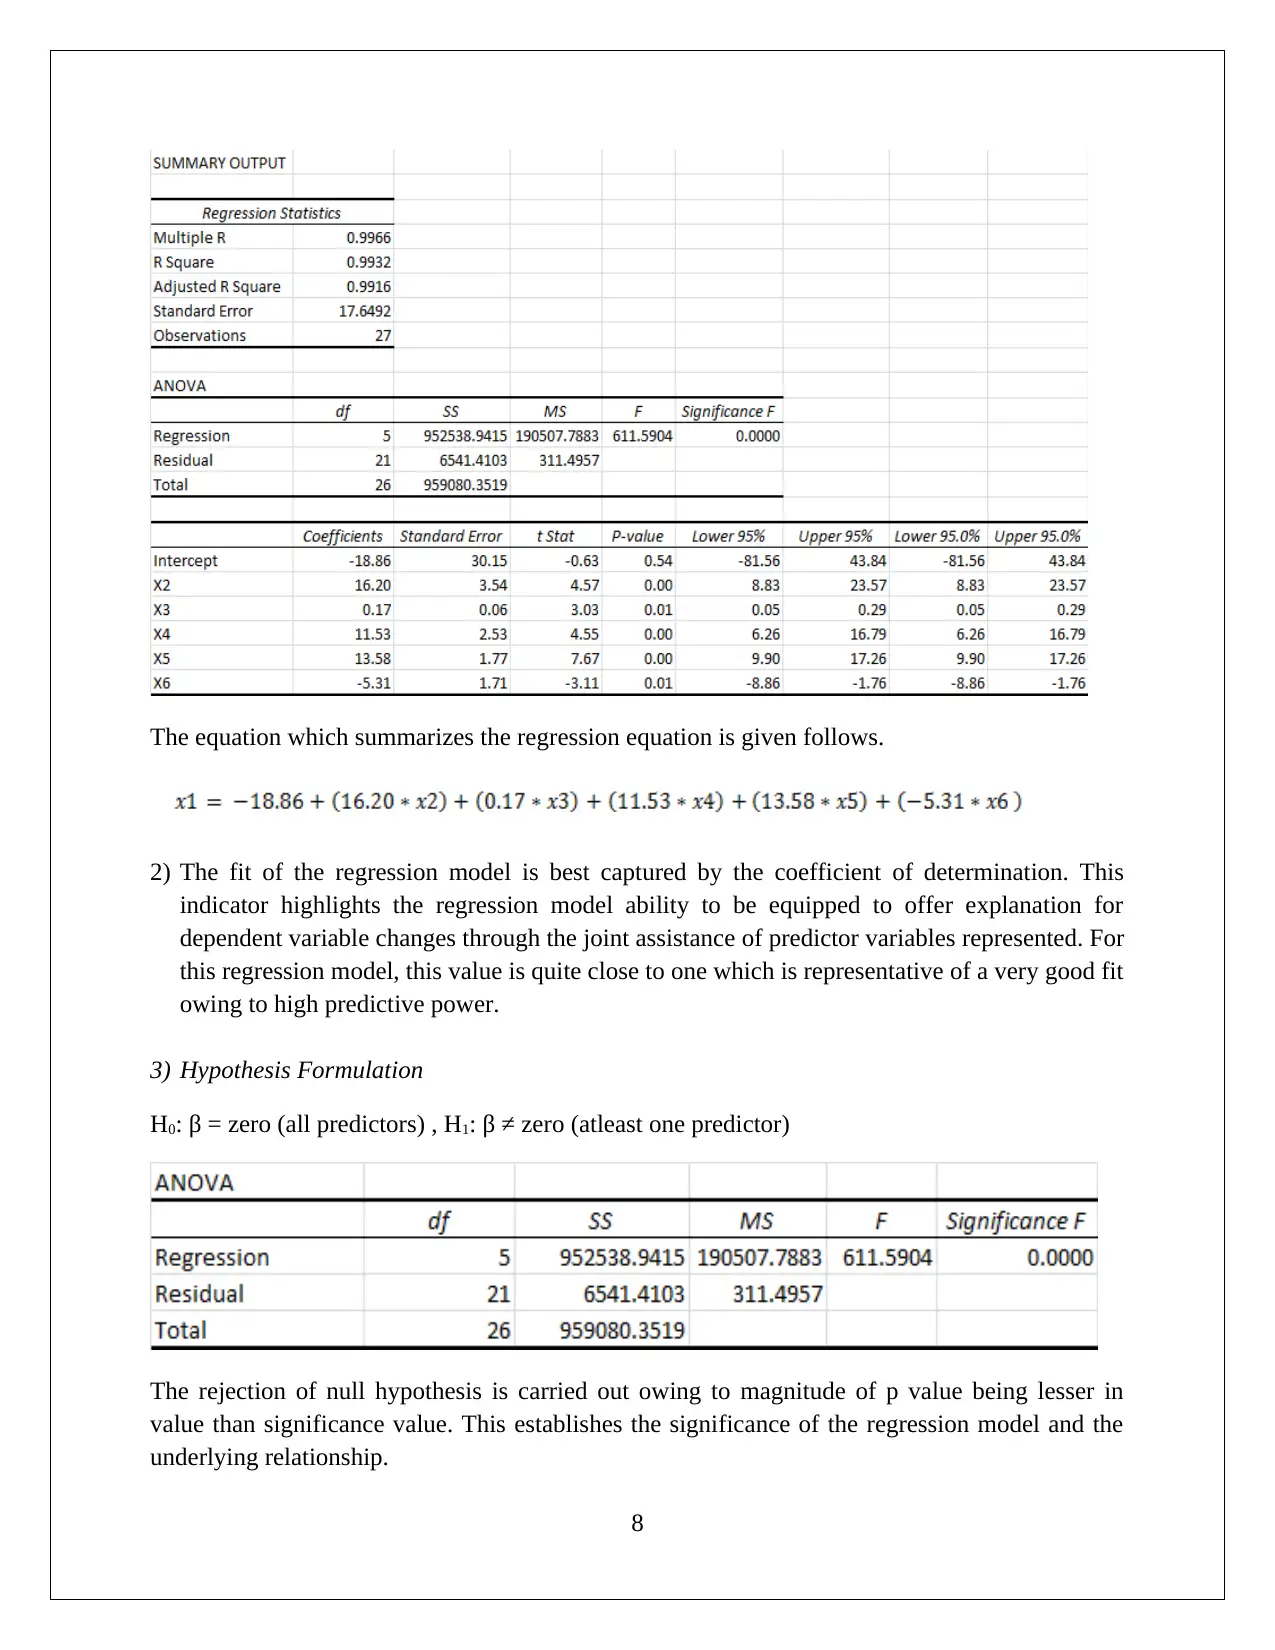
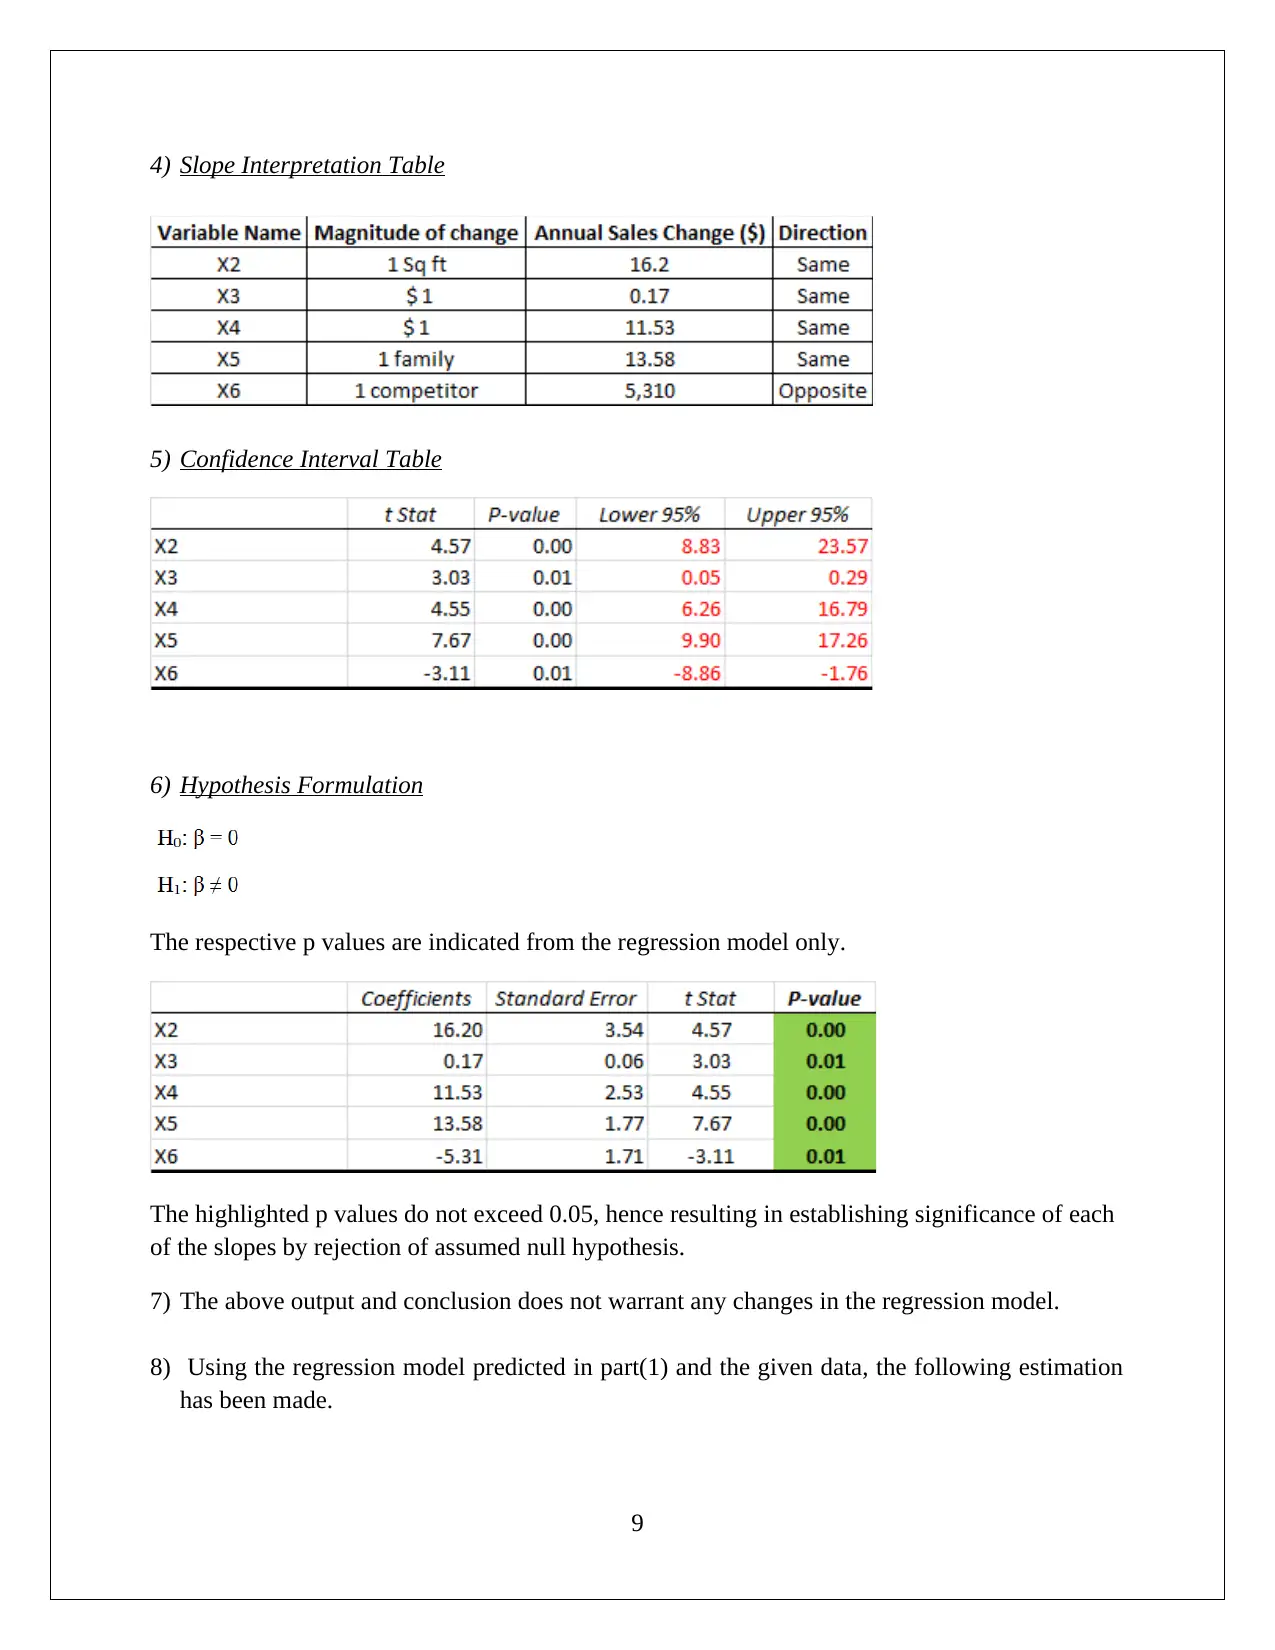
This statistics assignment delves into the analysis of startup costs across different business types using statistical methods. It involves constructing a relative frequency distribution table and interpreting a histogram to understand the distribution of startup costs. The assignment then formulates and tests hypotheses using ANOVA (Analysis of Variance) to determine if there are significant differences in the mean startup costs among various businesses. Furthermore, it utilizes regression analysis to model the relationship between variables, assesses the model's fit using the coefficient of determination, and interprets the significance of regression coefficients. The solution includes the interpretation of p-values and the formulation of null and alternative hypotheses. The assignment also includes the use of MS-Excel for data analysis and model building, providing insights into the practical application of statistical techniques in business contexts. This assignment provides a comprehensive overview of statistical analysis, hypothesis testing, and regression modeling.
Document Page
STATISTICS
Student Id
[Pick the date]
tabler-icon-diamond-filled.svg

Paraphrase This Document

Need a fresh take? Get an instant paraphrase of this document with our AI Paraphraser
Document Page
TASK 1
1. The relevant table is highlighted below:
Startup costs for pizza (x1)
Startup costs for baker/donut (x2)
Startup costs for shoe stores (x3)
Startup costs for gift shops (x4)
1
Document Page
Startup costs for pet stores (x5)
2.
(a) The requisite frequency and relative frequency distribution table is highlighted below:
Startup costs for pizza
(x1)
Startup costs for
baker/donut (x2)
2
Document Page
Startup costs for shoe
stores (x3)
Startup costs for gift
shops (x4)
Startup costs for pet
stores (x5)
(b) Relative Frequency Histogram
3
tabler-icon-diamond-filled.svg

Paraphrase This Document

Need a fresh take? Get an instant paraphrase of this document with our AI Paraphraser
Document Page
4
Document Page
5
Document Page
3) The key observations from histogram and descriptive statistics are as follows.
Non-symmetric histogram implying skew presence
Distribution is non-normal
Variation in startup costs of each business is visible
4) Defining the hypothesis
Null hypothesis: μX1= μX2 = μX3 = μX4 = μX5
Alternative hypothesis: Average startup cost for minimum one business does not coincide with
others.
Relevant Test: One Factor ANOVA
MS- EXCEL output
6
tabler-icon-diamond-filled.svg

Paraphrase This Document

Need a fresh take? Get an instant paraphrase of this document with our AI Paraphraser
Document Page
Output indicates that p value does not exceed significance level.
The net result is null hypothesis rejection thus establishing the difference between mean startup
costs for businesses is significant in statistical terms.
TASK 2
1) MS- Excel Regression Screenshot
7
Document Page
The equation which summarizes the regression equation is given follows.
2) The fit of the regression model is best captured by the coefficient of determination. This
indicator highlights the regression model ability to be equipped to offer explanation for
dependent variable changes through the joint assistance of predictor variables represented. For
this regression model, this value is quite close to one which is representative of a very good fit
owing to high predictive power.
3) Hypothesis Formulation
H0: β = zero (all predictors) , H1: β ≠ zero (atleast one predictor)
The rejection of null hypothesis is carried out owing to magnitude of p value being lesser in
value than significance value. This establishes the significance of the regression model and the
underlying relationship.
8
Document Page
4) Slope Interpretation Table
5) Confidence Interval Table
6) Hypothesis Formulation
The respective p values are indicated from the regression model only.
The highlighted p values do not exceed 0.05, hence resulting in establishing significance of each
of the slopes by rejection of assumed null hypothesis.
7) The above output and conclusion does not warrant any changes in the regression model.
8) Using the regression model predicted in part(1) and the given data, the following estimation
has been made.
9
tabler-icon-diamond-filled.svg

Paraphrase This Document

Need a fresh take? Get an instant paraphrase of this document with our AI Paraphraser
Document Page
10
chevron_up_icon
1 out of 11
circle_padding
hide_on_mobile
zoom_out_icon
[object Object]