Detailed Analysis and Business Report on the Stationery Market Trends
VerifiedAdded on 2020/06/06
|19
|2549
|272
Report
AI Summary
This report provides a comprehensive analysis of the stationery market, focusing on trends in Germany. It examines market data, including sales figures from 2015 to 2017 for various product categories like printer cartridges, office supplies, and writing materials. The analysis includes the use of charts, statistical tools such as correlation coefficients, and prediction models to forecast future sales trends. The report also evaluates the spending on stationery items by country, assesses the competitive landscape, and discusses international standards relevant to the industry. Furthermore, it delves into cost analysis, confidence intervals, and provides recommendations for improving business situations. The conclusion summarizes key findings and emphasizes the application of data visualization and analytical methods for effective business decision-making.
ANALYZING DATA
Paraphrase This Document
Need a fresh take? Get an instant paraphrase of this document with our AI Paraphraser
TABLE OF CONTENTS
INTRODUCTION...........................................................................................................................1
TASK 1............................................................................................................................................1
Trends in Germany stationary market.........................................................................................1
TASK 2............................................................................................................................................2
Annual spending on stationary items by country........................................................................2
TASK 3..........................................................................................Error! Bookmark not defined.
TASK 3............................................................................................................................................3
(a)Total sales value of products from 2015 to 2017....................................................................3
(b) Pie chart for sales amid of 2016 and 2017 productwise........................................................3
© Coorelation cofficient..............................................................................................................4
(d) Prediction on sales trend........................................................................................................5
TASK 4............................................................................................................................................5
(a)Completion of table.................................................................................................................5
(b) International standard for company.......................................................................................6
TASK 5............................................................................................................................................6
(a)Monthly cost by considering year...........................................................................................6
(b)Monthly cost by considering month........................................................................................6
TASK 6............................................................................................................................................7
Confidence interval......................................................................................................................7
TASK 7............................................................................................................................................8
(A)Advise in respect to improving situation...............................................................................8
(b) Descriptive statistics..............................................................................................................8
TASK 8 CONCLUSION.................................................................................................................9
REFERENCES..............................................................................................................................10
APPENDIX....................................................................................................................................11
Figure 1: Wholesale stationary business in Germany......................................................................1
Figure 2: Product wise sales value...................................................................................................3
Figure 3Scatter diagram and coorelation cofficient.........................................................................4
Figure 4Mean and standard deviation chart.....................................................................................8
⊘ This is a preview!⊘
Do you want full access?
Subscribe today to unlock all pages.
Trusted by 1+ million students worldwide
INTRODUCTION
Stationary business is one of small size business that is growing in specific nations like
Germany at fast rate. In the present research study varied facts are analyzed by doing charting of
same and applying statistical tools like mean and standard deviation etc. Detailed analysis of
varied markets in terms of stationary sales value is done in the research study and it is identified
that Germany and Switzerland are two markets where demand of stationary items is high. Hence,
it can be said that there is huge importance of the statistics for the businss firms.
TASK 1
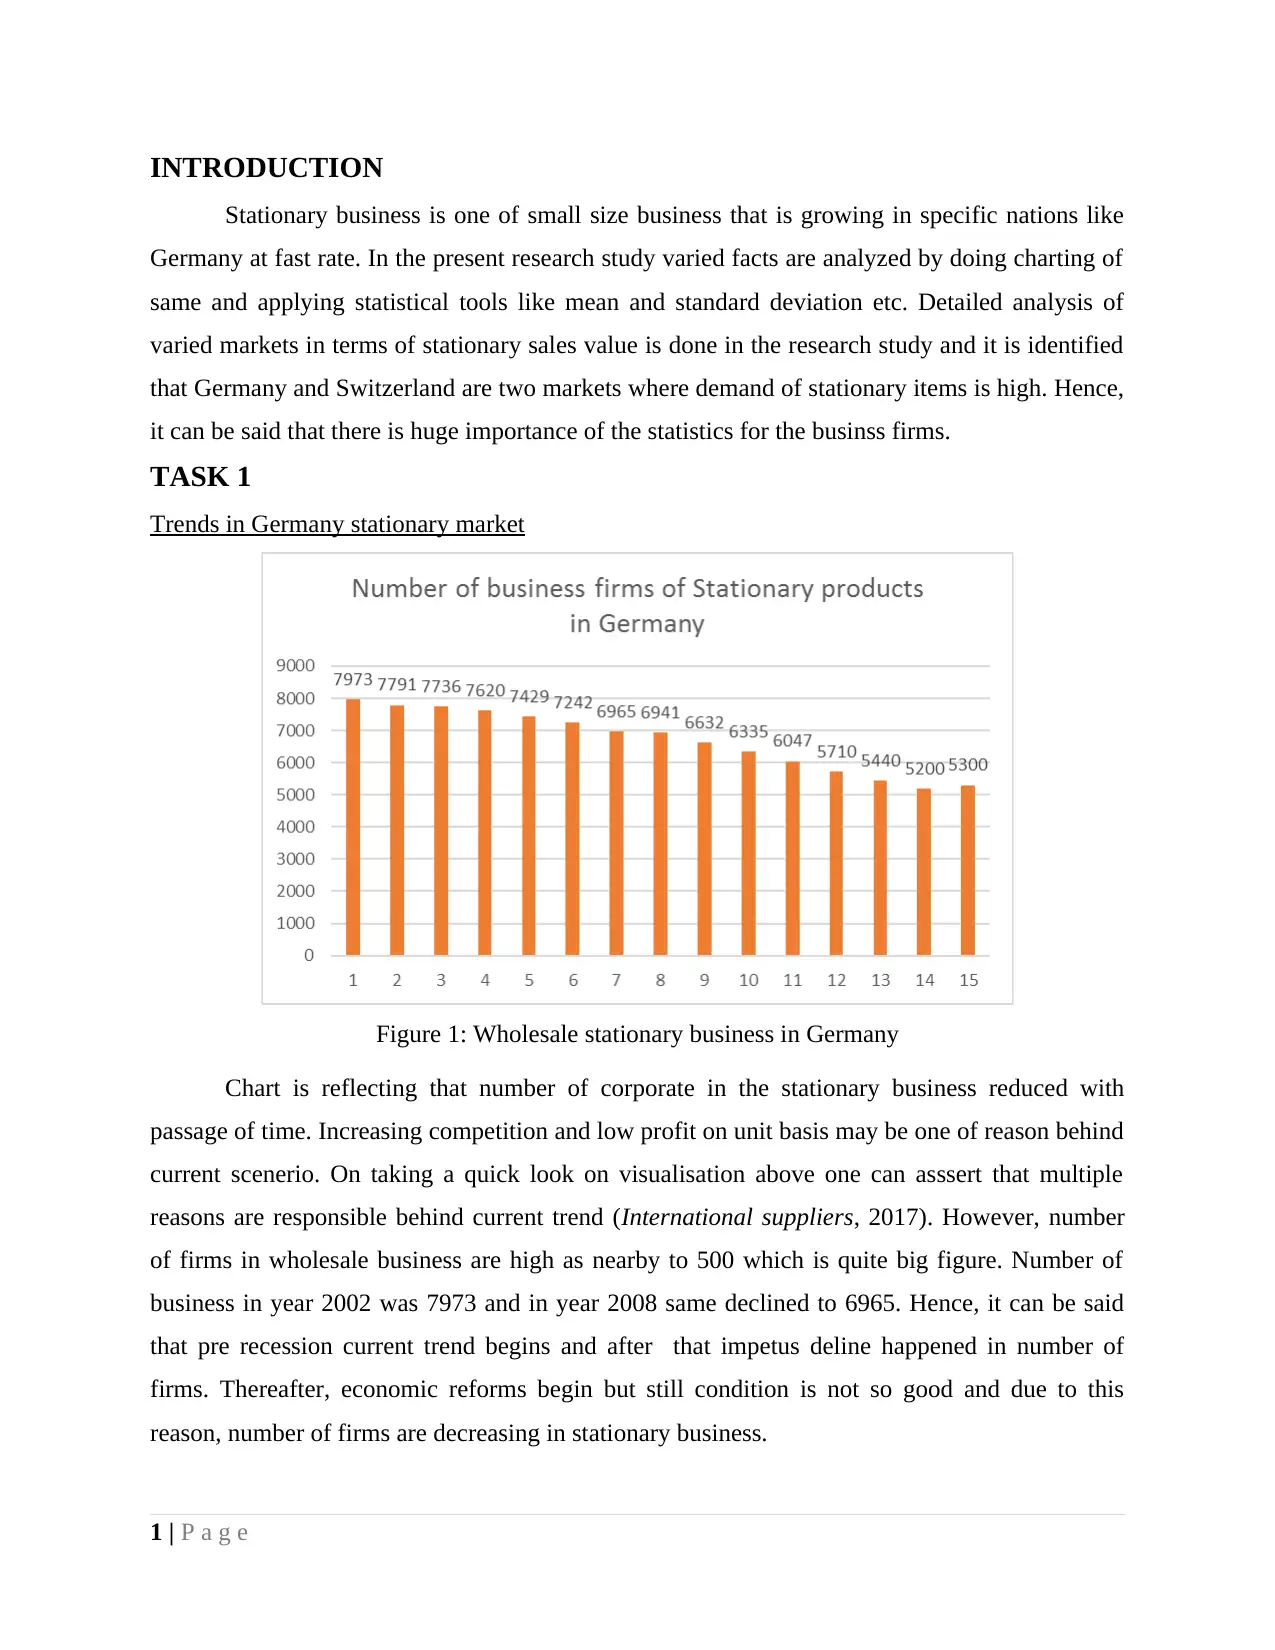
Trends in Germany stationary market
Figure 1: Wholesale stationary business in Germany
Chart is reflecting that number of corporate in the stationary business reduced with
passage of time. Increasing competition and low profit on unit basis may be one of reason behind
current scenerio. On taking a quick look on visualisation above one can asssert that multiple
reasons are responsible behind current trend (International suppliers, 2017). However, number
of firms in wholesale business are high as nearby to 500 which is quite big figure. Number of
business in year 2002 was 7973 and in year 2008 same declined to 6965. Hence, it can be said
that pre recession current trend begins and after that impetus deline happened in number of
firms. Thereafter, economic reforms begin but still condition is not so good and due to this
reason, number of firms are decreasing in stationary business.
1 | P a g e
Stationary business is one of small size business that is growing in specific nations like
Germany at fast rate. In the present research study varied facts are analyzed by doing charting of
same and applying statistical tools like mean and standard deviation etc. Detailed analysis of
varied markets in terms of stationary sales value is done in the research study and it is identified
that Germany and Switzerland are two markets where demand of stationary items is high. Hence,
it can be said that there is huge importance of the statistics for the businss firms.
TASK 1
Trends in Germany stationary market
Figure 1: Wholesale stationary business in Germany
Chart is reflecting that number of corporate in the stationary business reduced with
passage of time. Increasing competition and low profit on unit basis may be one of reason behind
current scenerio. On taking a quick look on visualisation above one can asssert that multiple
reasons are responsible behind current trend (International suppliers, 2017). However, number
of firms in wholesale business are high as nearby to 500 which is quite big figure. Number of
business in year 2002 was 7973 and in year 2008 same declined to 6965. Hence, it can be said
that pre recession current trend begins and after that impetus deline happened in number of
firms. Thereafter, economic reforms begin but still condition is not so good and due to this
reason, number of firms are decreasing in stationary business.
1 | P a g e
Paraphrase This Document
Need a fresh take? Get an instant paraphrase of this document with our AI Paraphraser

TASK 2
Annual spending on stationary items by country
Interpretation
By the above conducted research, it has been evaluated that the stationery industry of
German has grown very effectively to get a reputable position in the marketplace. The above
report has presented the data presented by Trade Association for Office Supply and Writing
Materials and have shown a total revenue more than €14.8 billion per year. It is very much
related to the expenditure of every individual which is €182 per year. From the above
2 | P a g e
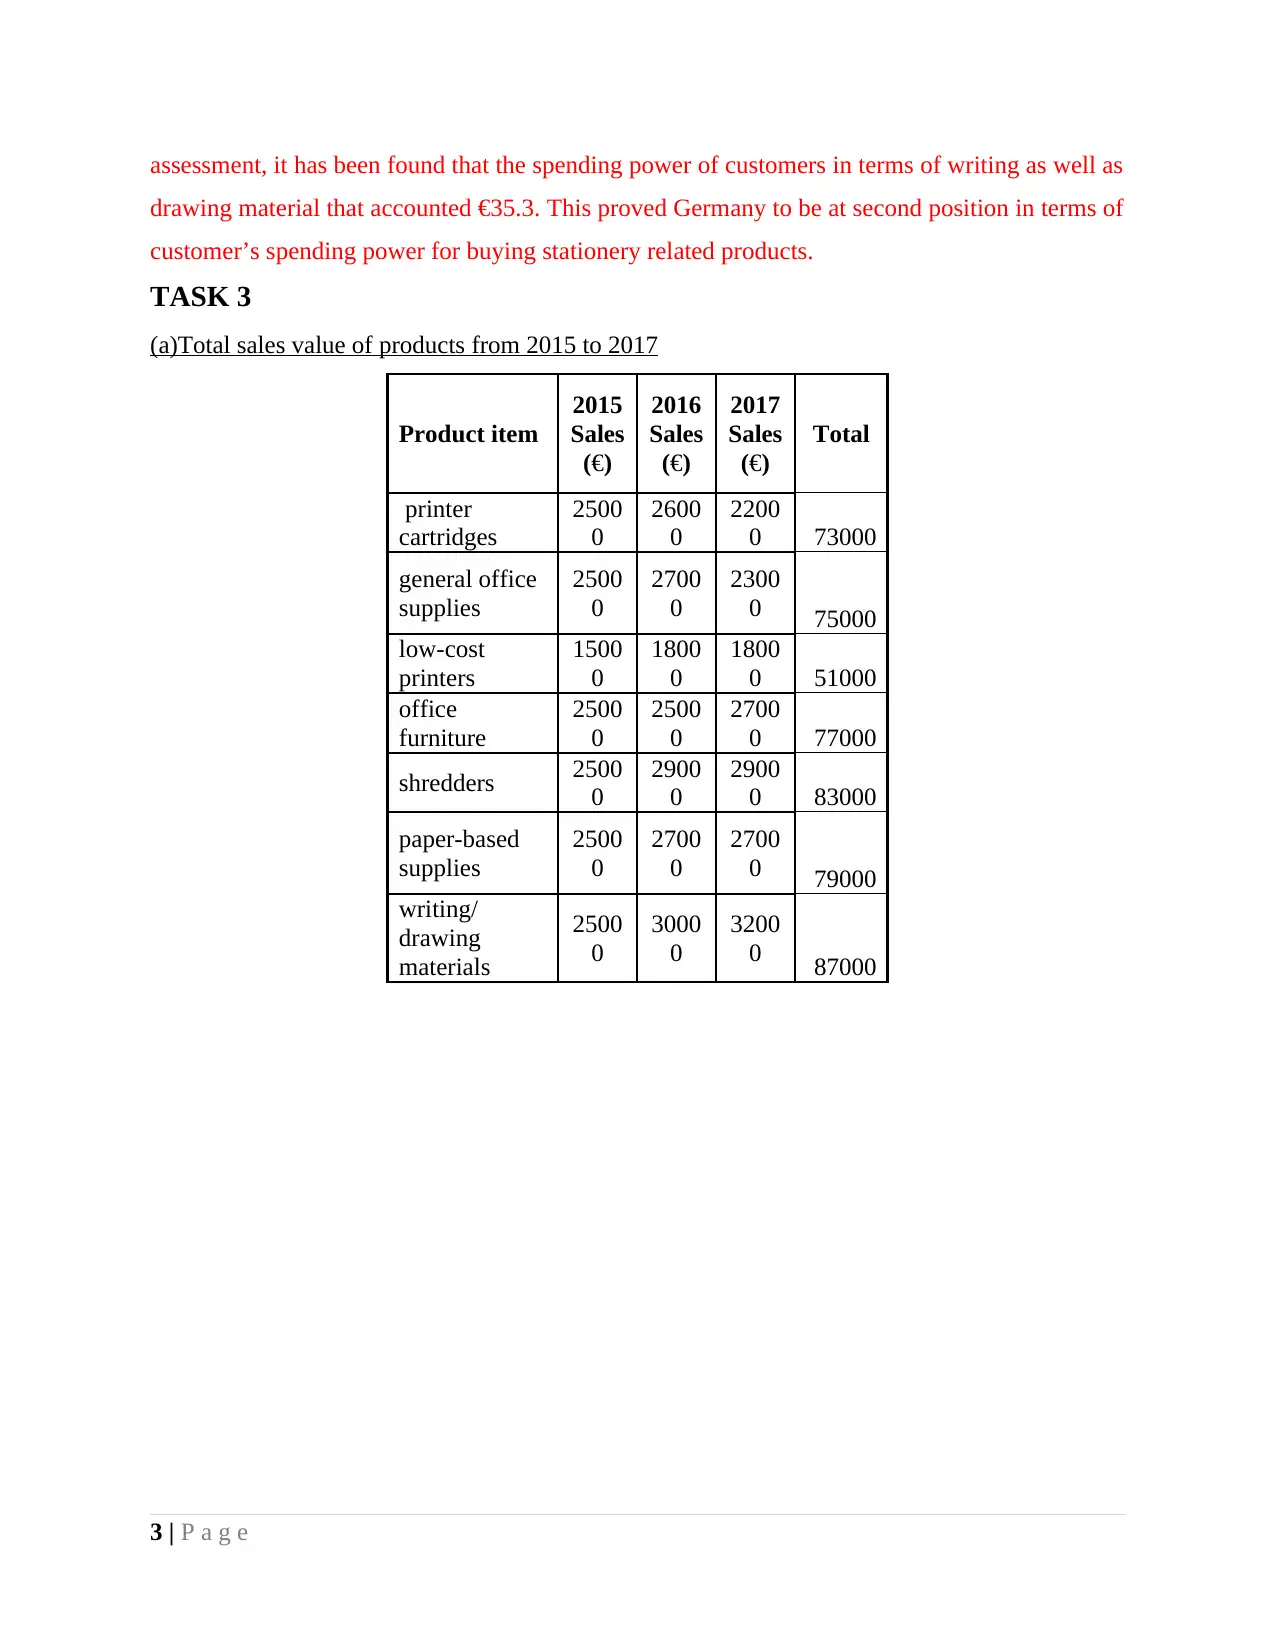
assessment, it has been found that the spending power of customers in terms of writing as well as
drawing material that accounted €35.3. This proved Germany to be at second position in terms of
customer’s spending power for buying stationery related products.
TASK 3
(a)Total sales value of products from 2015 to 2017
Product item
2015
Sales
(€)
2016
Sales
(€)
2017
Sales
(€)
Total
printer
cartridges
2500
0
2600
0
2200
0 73000
general office
supplies
2500
0
2700
0
2300
0 75000
low-cost
printers
1500
0
1800
0
1800
0 51000
office
furniture
2500
0
2500
0
2700
0 77000
shredders 2500
0
2900
0
2900
0 83000
paper-based
supplies
2500
0
2700
0
2700
0 79000
writing/
drawing
materials
2500
0
3000
0
3200
0 87000
3 | P a g e
⊘ This is a preview!⊘
Do you want full access?
Subscribe today to unlock all pages.
Trusted by 1+ million students worldwide
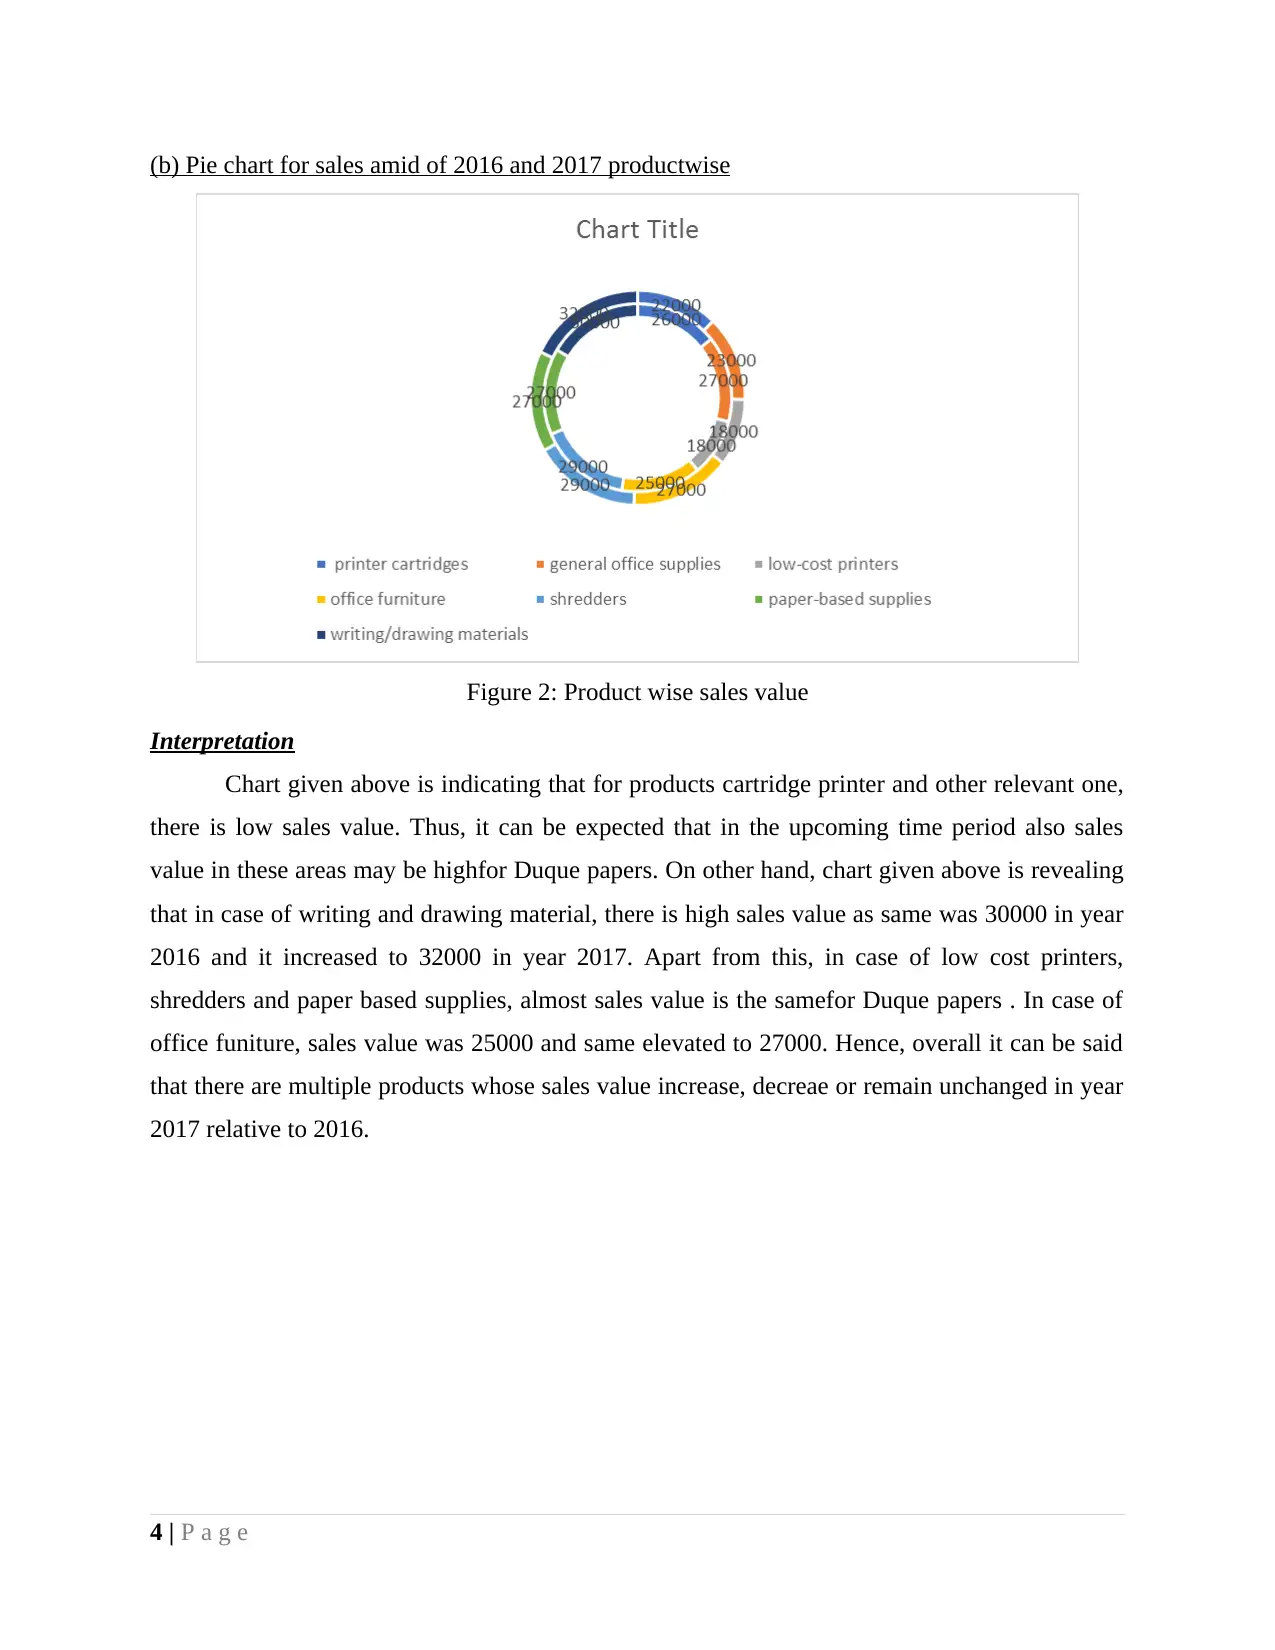
(b) Pie chart for sales amid of 2016 and 2017 productwise
Figure 2: Product wise sales value
Interpretation
Chart given above is indicating that for products cartridge printer and other relevant one,
there is low sales value. Thus, it can be expected that in the upcoming time period also sales
value in these areas may be highfor Duque papers. On other hand, chart given above is revealing
that in case of writing and drawing material, there is high sales value as same was 30000 in year
2016 and it increased to 32000 in year 2017. Apart from this, in case of low cost printers,
shredders and paper based supplies, almost sales value is the samefor Duque papers . In case of
office funiture, sales value was 25000 and same elevated to 27000. Hence, overall it can be said
that there are multiple products whose sales value increase, decreae or remain unchanged in year
2017 relative to 2016.
4 | P a g e
Paraphrase This Document
Need a fresh take? Get an instant paraphrase of this document with our AI Paraphraser
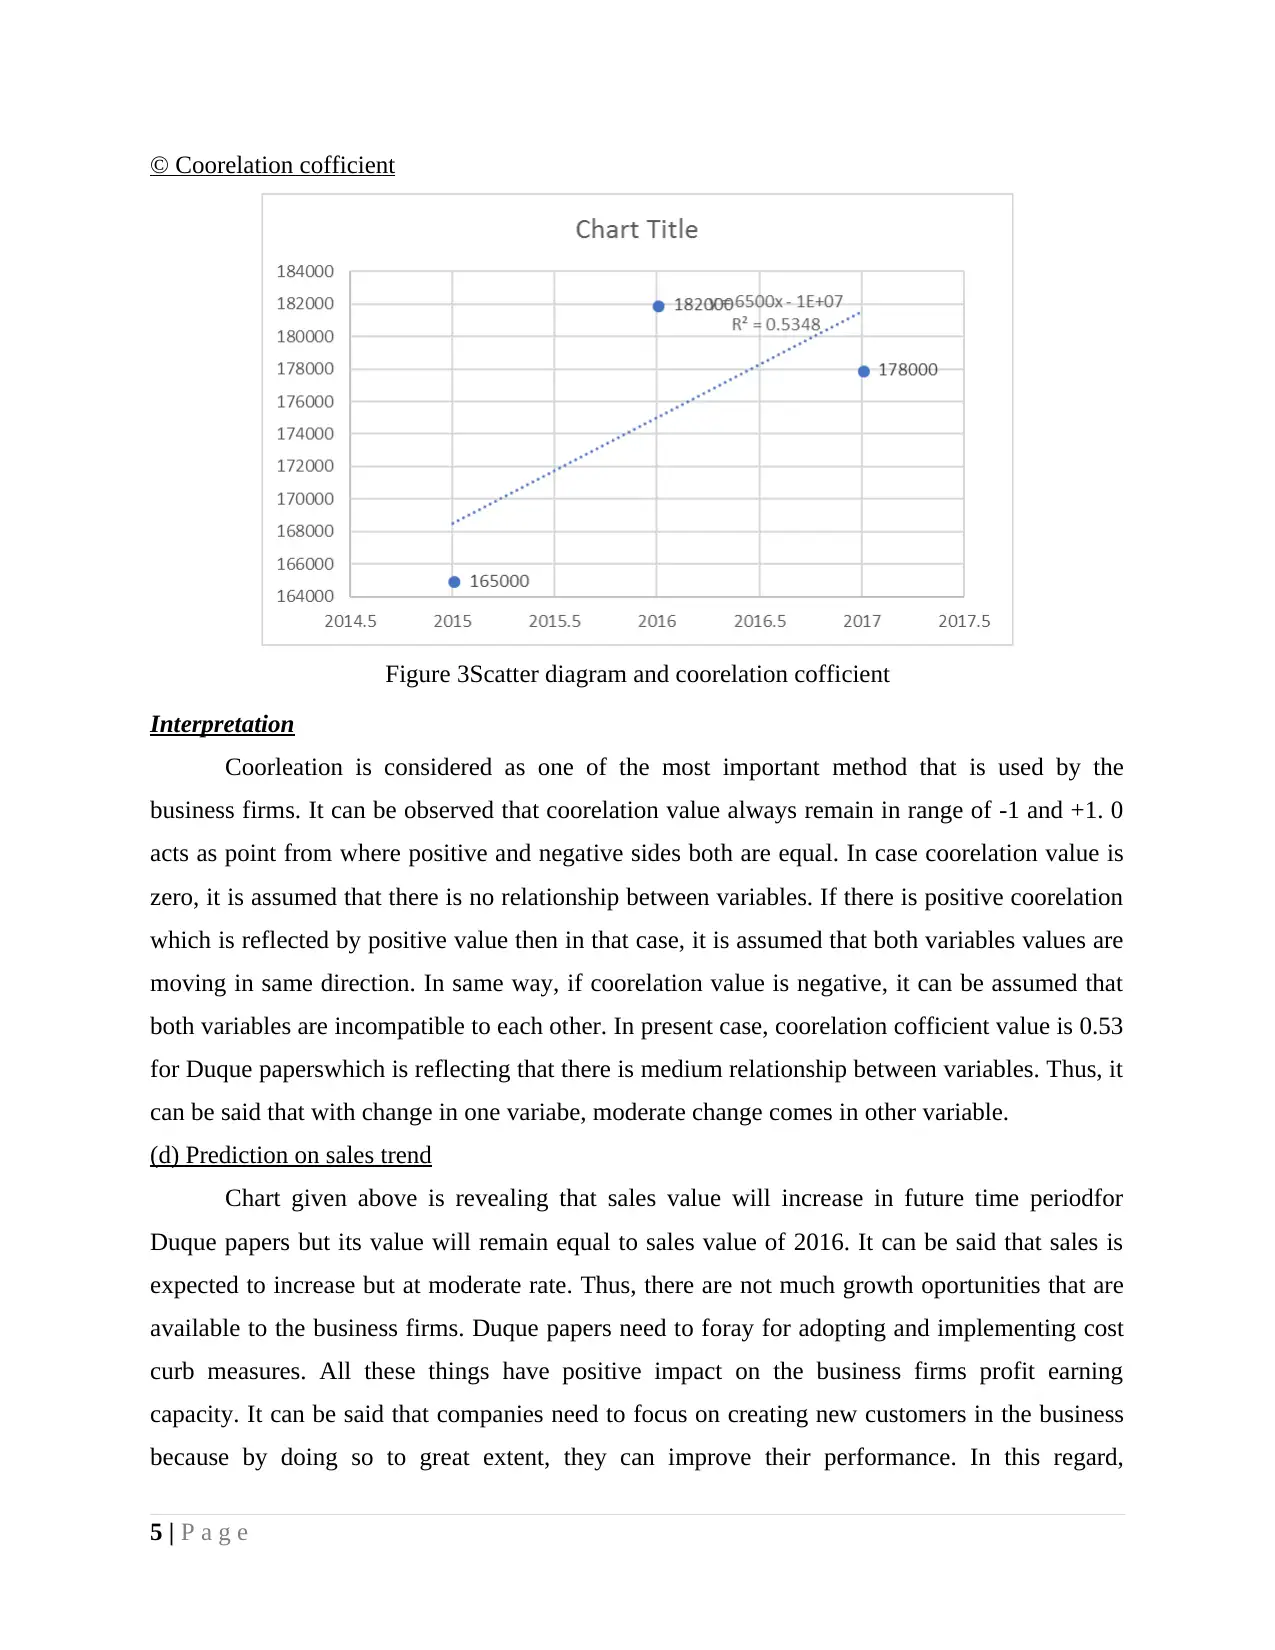
© Coorelation cofficient
Figure 3Scatter diagram and coorelation cofficient
Interpretation
Coorleation is considered as one of the most important method that is used by the
business firms. It can be observed that coorelation value always remain in range of -1 and +1. 0
acts as point from where positive and negative sides both are equal. In case coorelation value is
zero, it is assumed that there is no relationship between variables. If there is positive coorelation
which is reflected by positive value then in that case, it is assumed that both variables values are
moving in same direction. In same way, if coorelation value is negative, it can be assumed that
both variables are incompatible to each other. In present case, coorelation cofficient value is 0.53
for Duque paperswhich is reflecting that there is medium relationship between variables. Thus, it
can be said that with change in one variabe, moderate change comes in other variable.
(d) Prediction on sales trend
Chart given above is revealing that sales value will increase in future time periodfor
Duque papers but its value will remain equal to sales value of 2016. It can be said that sales is
expected to increase but at moderate rate. Thus, there are not much growth oportunities that are
available to the business firms. Duque papers need to foray for adopting and implementing cost
curb measures. All these things have positive impact on the business firms profit earning
capacity. It can be said that companies need to focus on creating new customers in the business
because by doing so to great extent, they can improve their performance. In this regard,
5 | P a g e
management can take advice from the middle level managers and can work on it to improve
performance.
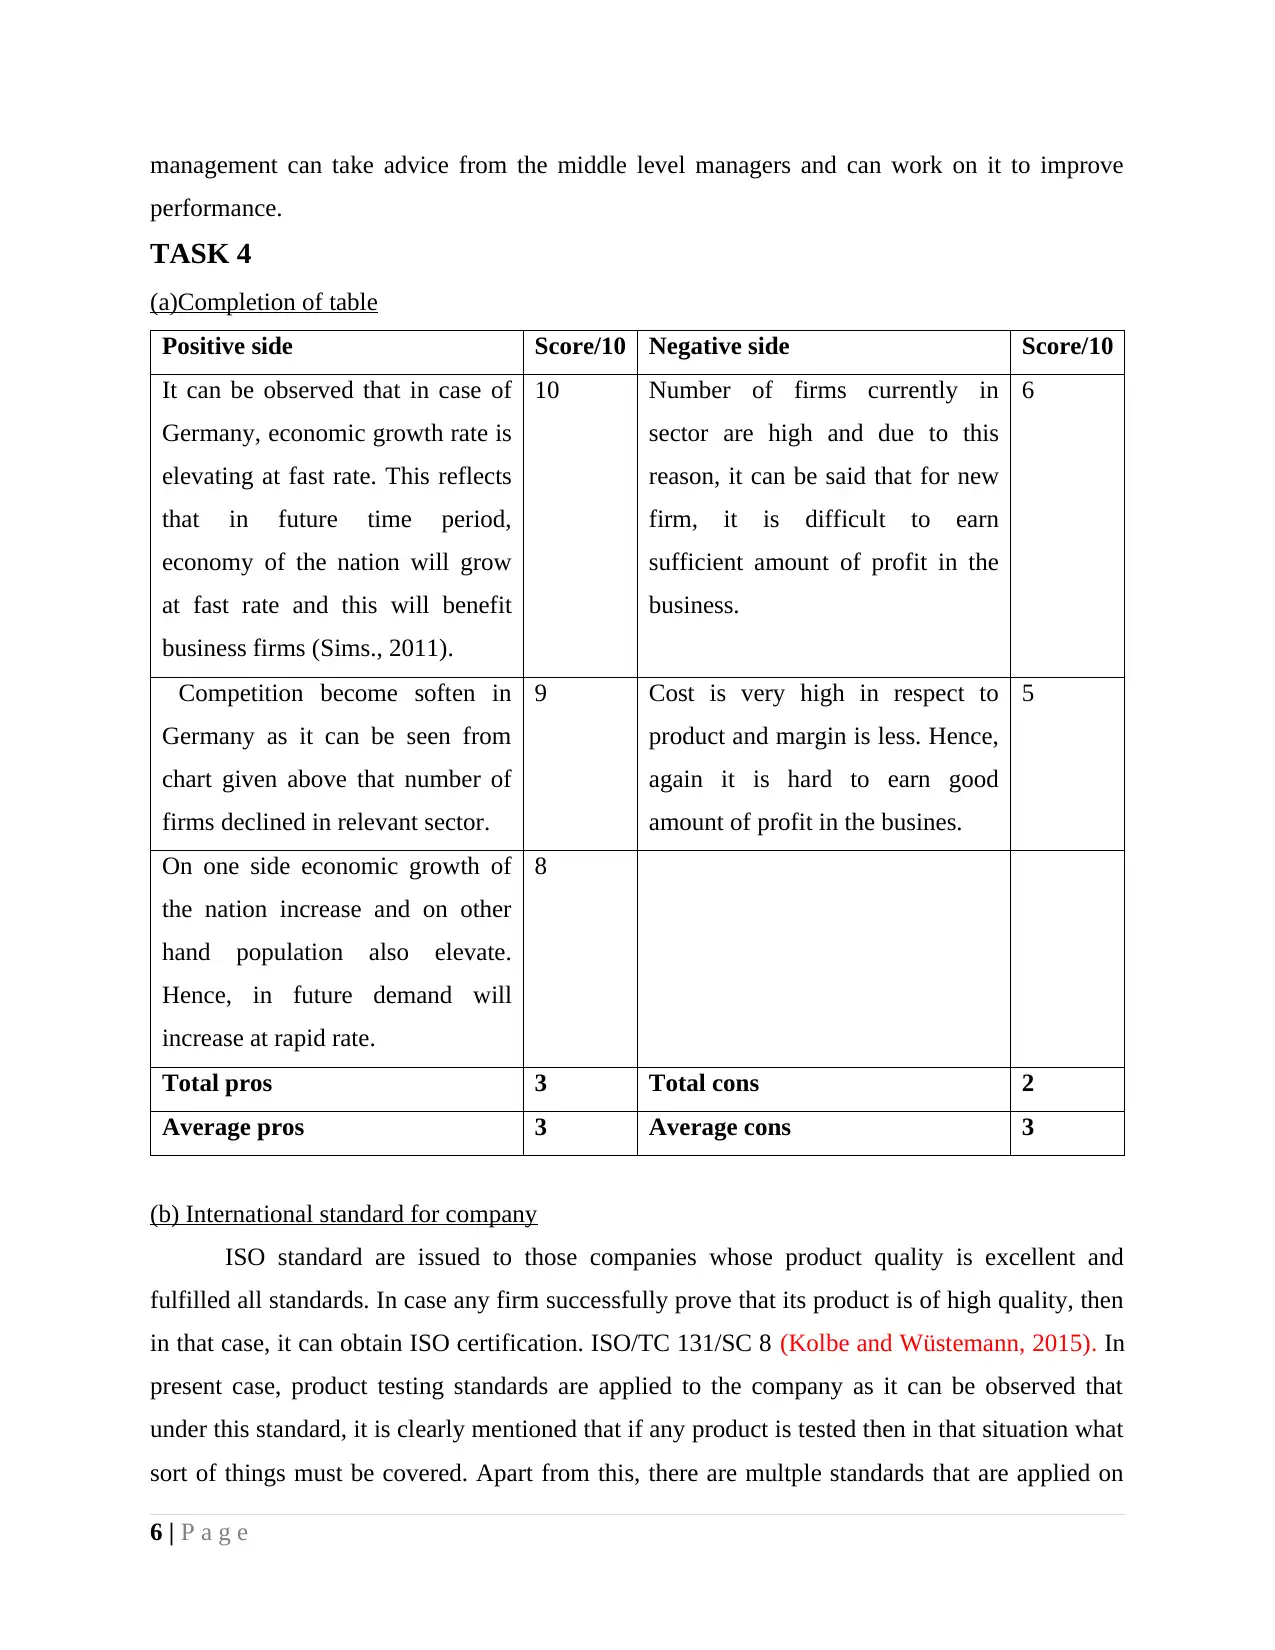
TASK 4
(a)Completion of table
Positive side Score/10 Negative side Score/10
It can be observed that in case of
Germany, economic growth rate is
elevating at fast rate. This reflects
that in future time period,
economy of the nation will grow
at fast rate and this will benefit
business firms (Sims., 2011).
10 Number of firms currently in
sector are high and due to this
reason, it can be said that for new
firm, it is difficult to earn
sufficient amount of profit in the
business.
6
Competition become soften in
Germany as it can be seen from
chart given above that number of
firms declined in relevant sector.
9 Cost is very high in respect to
product and margin is less. Hence,
again it is hard to earn good
amount of profit in the busines.
5
On one side economic growth of
the nation increase and on other
hand population also elevate.
Hence, in future demand will
increase at rapid rate.
8
Total pros 3 Total cons 2
Average pros 3 Average cons 3
(b) International standard for company
ISO standard are issued to those companies whose product quality is excellent and
fulfilled all standards. In case any firm successfully prove that its product is of high quality, then
in that case, it can obtain ISO certification. ISO/TC 131/SC 8 (Kolbe and Wüstemann, 2015). In
present case, product testing standards are applied to the company as it can be observed that
under this standard, it is clearly mentioned that if any product is tested then in that situation what
sort of things must be covered. Apart from this, there are multple standards that are applied on
6 | P a g e
performance.
TASK 4
(a)Completion of table
Positive side Score/10 Negative side Score/10
It can be observed that in case of
Germany, economic growth rate is
elevating at fast rate. This reflects
that in future time period,
economy of the nation will grow
at fast rate and this will benefit
business firms (Sims., 2011).
10 Number of firms currently in
sector are high and due to this
reason, it can be said that for new
firm, it is difficult to earn
sufficient amount of profit in the
business.
6
Competition become soften in
Germany as it can be seen from
chart given above that number of
firms declined in relevant sector.
9 Cost is very high in respect to
product and margin is less. Hence,
again it is hard to earn good
amount of profit in the busines.
5
On one side economic growth of
the nation increase and on other
hand population also elevate.
Hence, in future demand will
increase at rapid rate.
8
Total pros 3 Total cons 2
Average pros 3 Average cons 3
(b) International standard for company
ISO standard are issued to those companies whose product quality is excellent and
fulfilled all standards. In case any firm successfully prove that its product is of high quality, then
in that case, it can obtain ISO certification. ISO/TC 131/SC 8 (Kolbe and Wüstemann, 2015). In
present case, product testing standards are applied to the company as it can be observed that
under this standard, it is clearly mentioned that if any product is tested then in that situation what
sort of things must be covered. Apart from this, there are multple standards that are applied on
6 | P a g e
⊘ This is a preview!⊘
Do you want full access?
Subscribe today to unlock all pages.
Trusted by 1+ million students worldwide
the companies. Hence, it can be said that there are number of international standards that applied
to the company.
TASK 5
(a)Monthly cost by considering year
Table 1Calculation of monthly cost
Yearly
amount 6667
Interest 666.6666667
Monthly cost 611.1111111
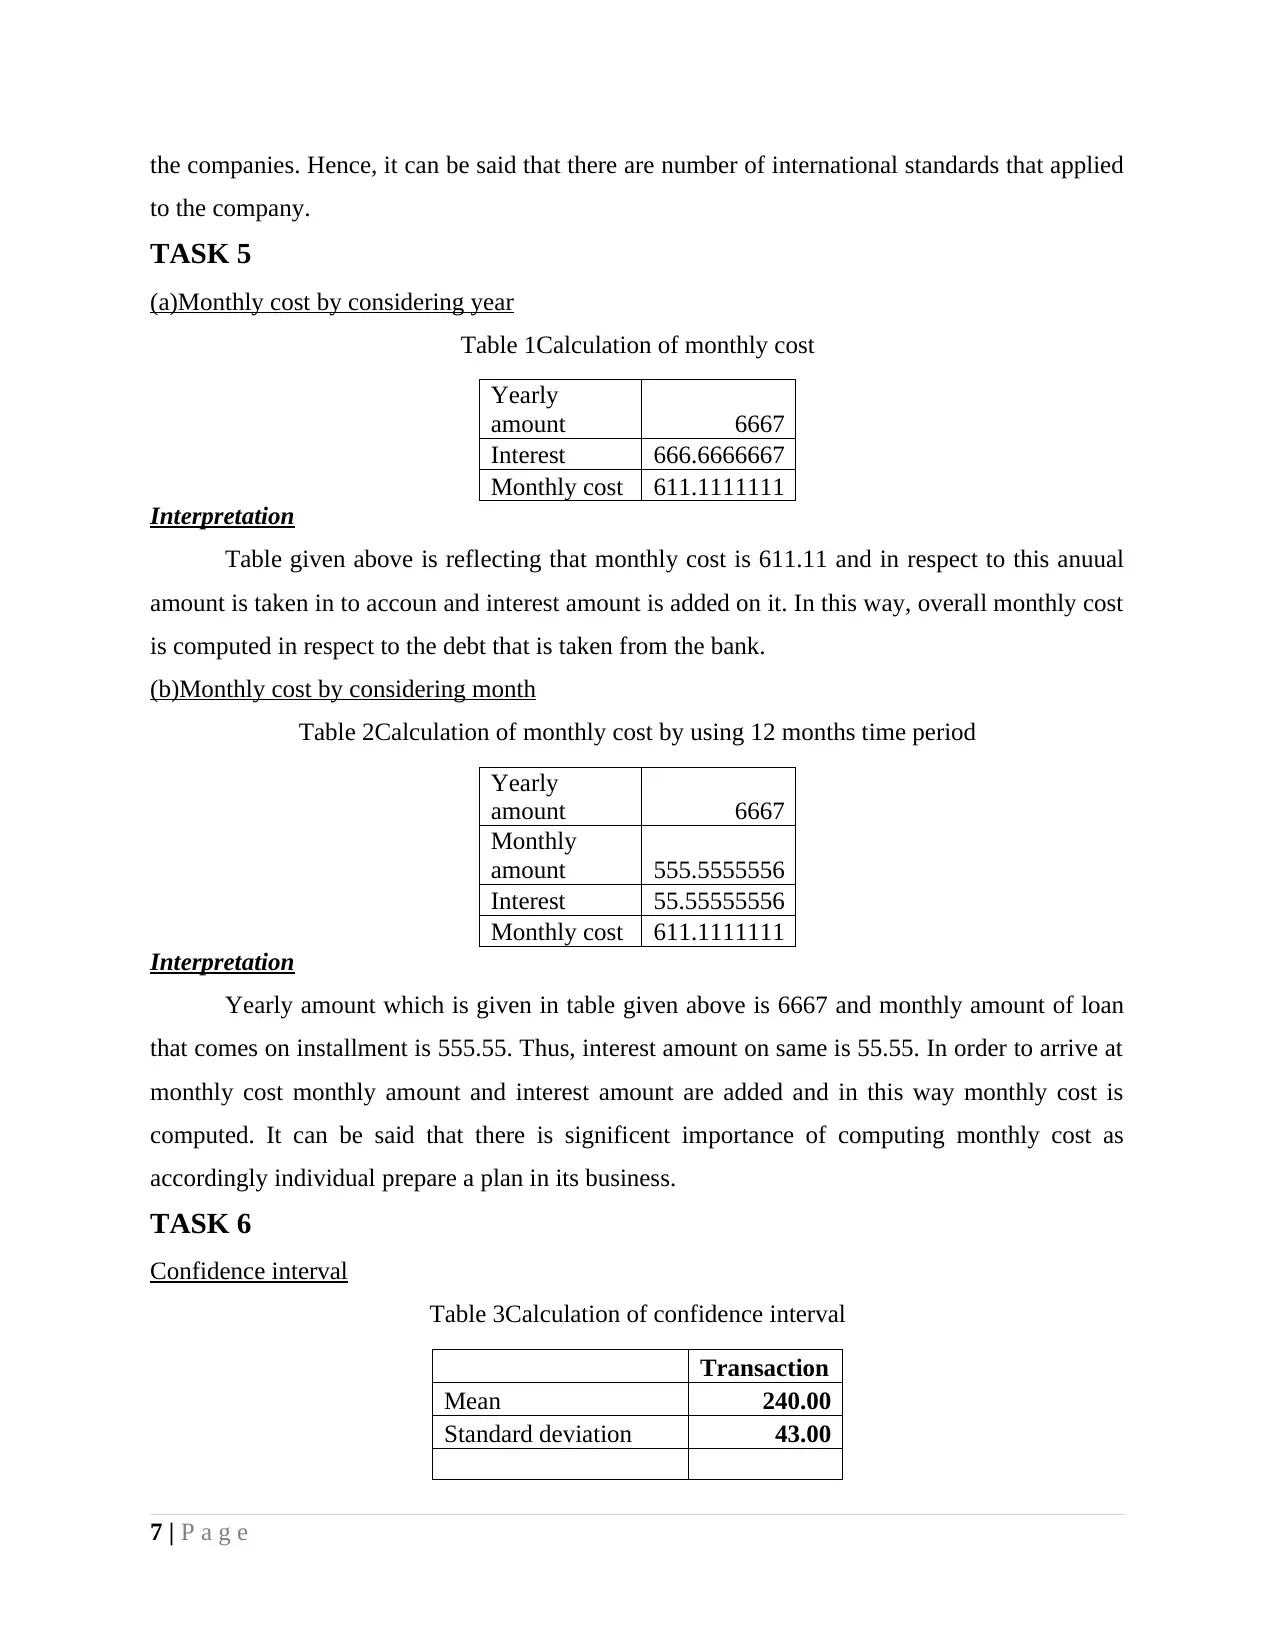
Interpretation
Table given above is reflecting that monthly cost is 611.11 and in respect to this anuual
amount is taken in to accoun and interest amount is added on it. In this way, overall monthly cost
is computed in respect to the debt that is taken from the bank.
(b)Monthly cost by considering month
Table 2Calculation of monthly cost by using 12 months time period
Yearly
amount 6667
Monthly
amount 555.5555556
Interest 55.55555556
Monthly cost 611.1111111
Interpretation
Yearly amount which is given in table given above is 6667 and monthly amount of loan
that comes on installment is 555.55. Thus, interest amount on same is 55.55. In order to arrive at
monthly cost monthly amount and interest amount are added and in this way monthly cost is
computed. It can be said that there is significent importance of computing monthly cost as
accordingly individual prepare a plan in its business.
TASK 6
Confidence interval
Table 3Calculation of confidence interval
Transaction
Mean 240.00
Standard deviation 43.00
7 | P a g e
to the company.
TASK 5
(a)Monthly cost by considering year
Table 1Calculation of monthly cost
Yearly
amount 6667
Interest 666.6666667
Monthly cost 611.1111111
Interpretation
Table given above is reflecting that monthly cost is 611.11 and in respect to this anuual
amount is taken in to accoun and interest amount is added on it. In this way, overall monthly cost
is computed in respect to the debt that is taken from the bank.
(b)Monthly cost by considering month
Table 2Calculation of monthly cost by using 12 months time period
Yearly
amount 6667
Monthly
amount 555.5555556
Interest 55.55555556
Monthly cost 611.1111111
Interpretation
Yearly amount which is given in table given above is 6667 and monthly amount of loan
that comes on installment is 555.55. Thus, interest amount on same is 55.55. In order to arrive at
monthly cost monthly amount and interest amount are added and in this way monthly cost is
computed. It can be said that there is significent importance of computing monthly cost as
accordingly individual prepare a plan in its business.
TASK 6
Confidence interval
Table 3Calculation of confidence interval
Transaction
Mean 240.00
Standard deviation 43.00
7 | P a g e
Paraphrase This Document
Need a fresh take? Get an instant paraphrase of this document with our AI Paraphraser
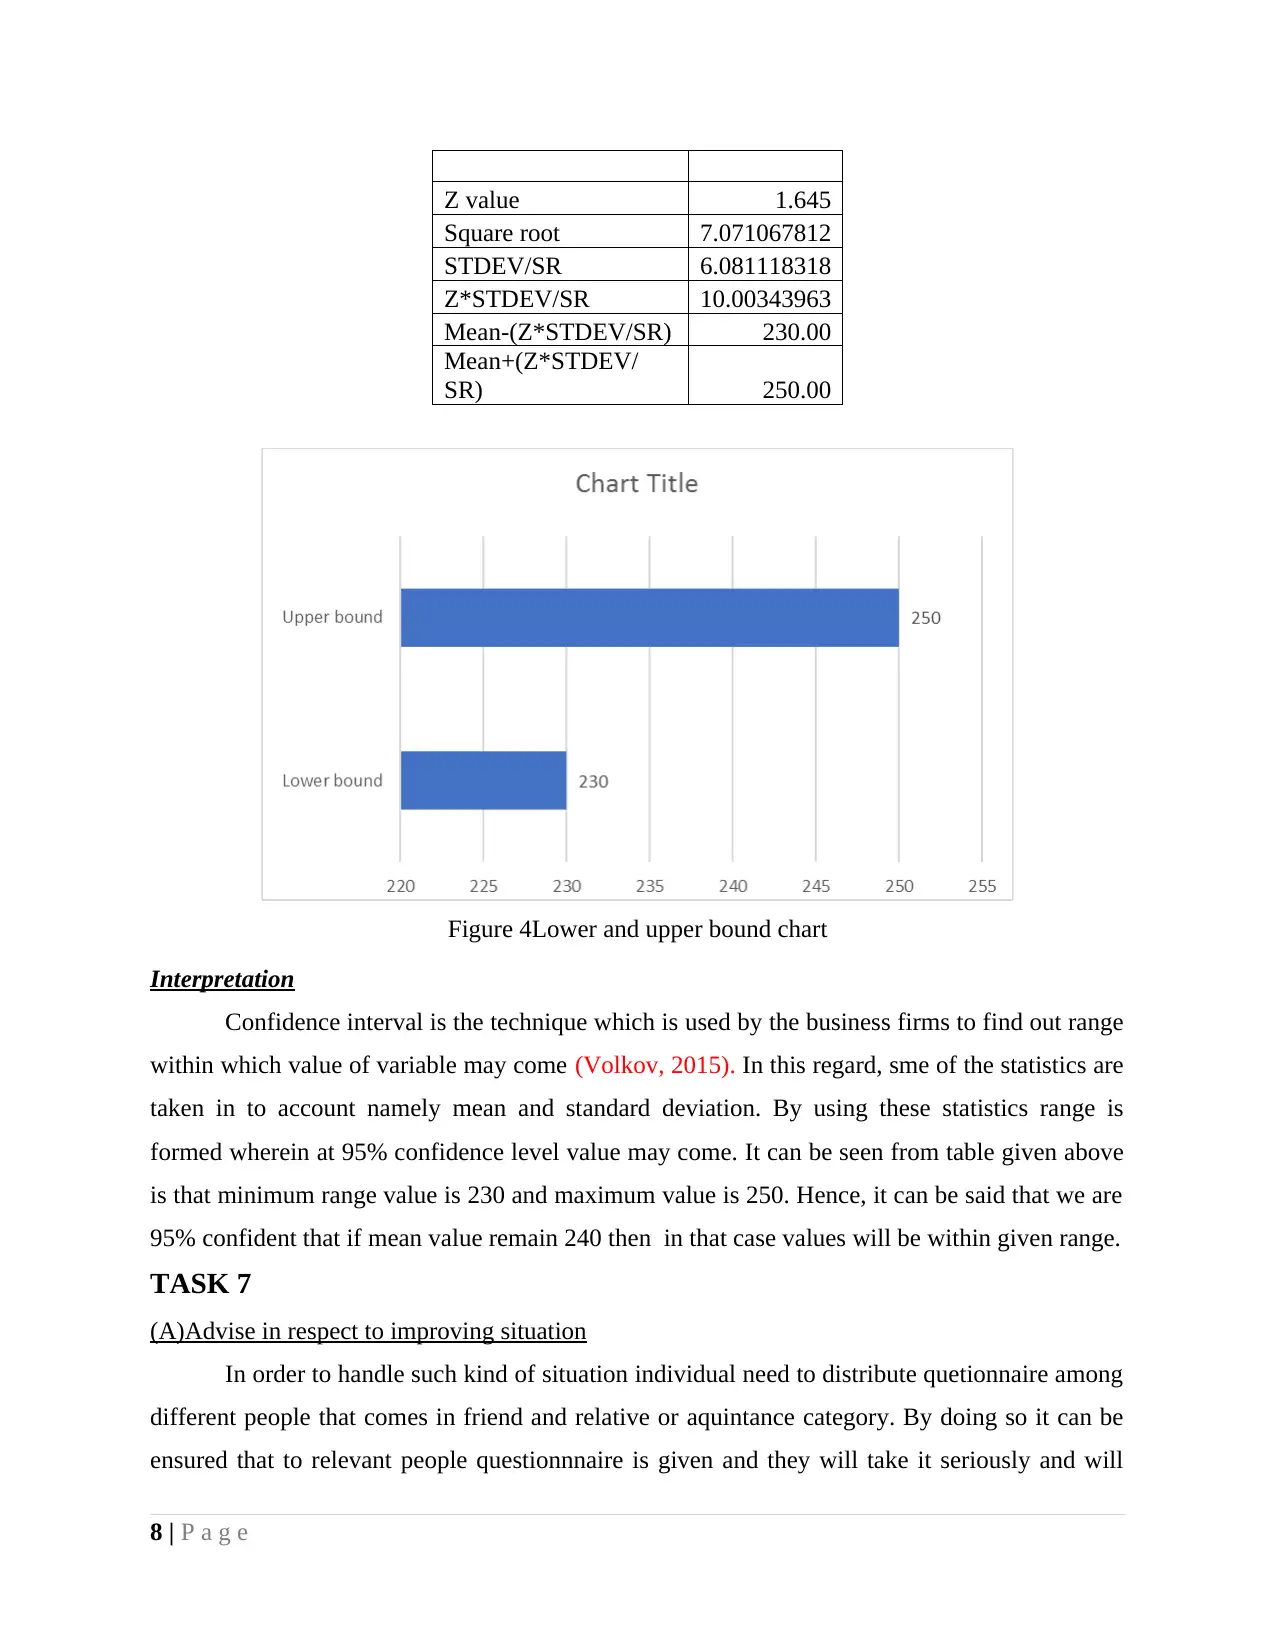
Z value 1.645
Square root 7.071067812
STDEV/SR 6.081118318
Z*STDEV/SR 10.00343963
Mean-(Z*STDEV/SR) 230.00
Mean+(Z*STDEV/
SR) 250.00
Figure 4Lower and upper bound chart
Interpretation
Confidence interval is the technique which is used by the business firms to find out range
within which value of variable may come (Volkov, 2015). In this regard, sme of the statistics are
taken in to account namely mean and standard deviation. By using these statistics range is
formed wherein at 95% confidence level value may come. It can be seen from table given above
is that minimum range value is 230 and maximum value is 250. Hence, it can be said that we are
95% confident that if mean value remain 240 then in that case values will be within given range.
TASK 7
(A)Advise in respect to improving situation
In order to handle such kind of situation individual need to distribute quetionnaire among
different people that comes in friend and relative or aquintance category. By doing so it can be
ensured that to relevant people questionnnaire is given and they will take it seriously and will
8 | P a g e
revert back filled questionnaire on time (Kasara and Mares, 2017). Apart from this, one can itself
go to meet respondents and can make them questions understand. By doing so it can be ensured
that rights answers are obtained on asked question. By implemeting these advises one can
improve situation to great extent and get filled all questionnaires on time.
(b) Descriptive statistics
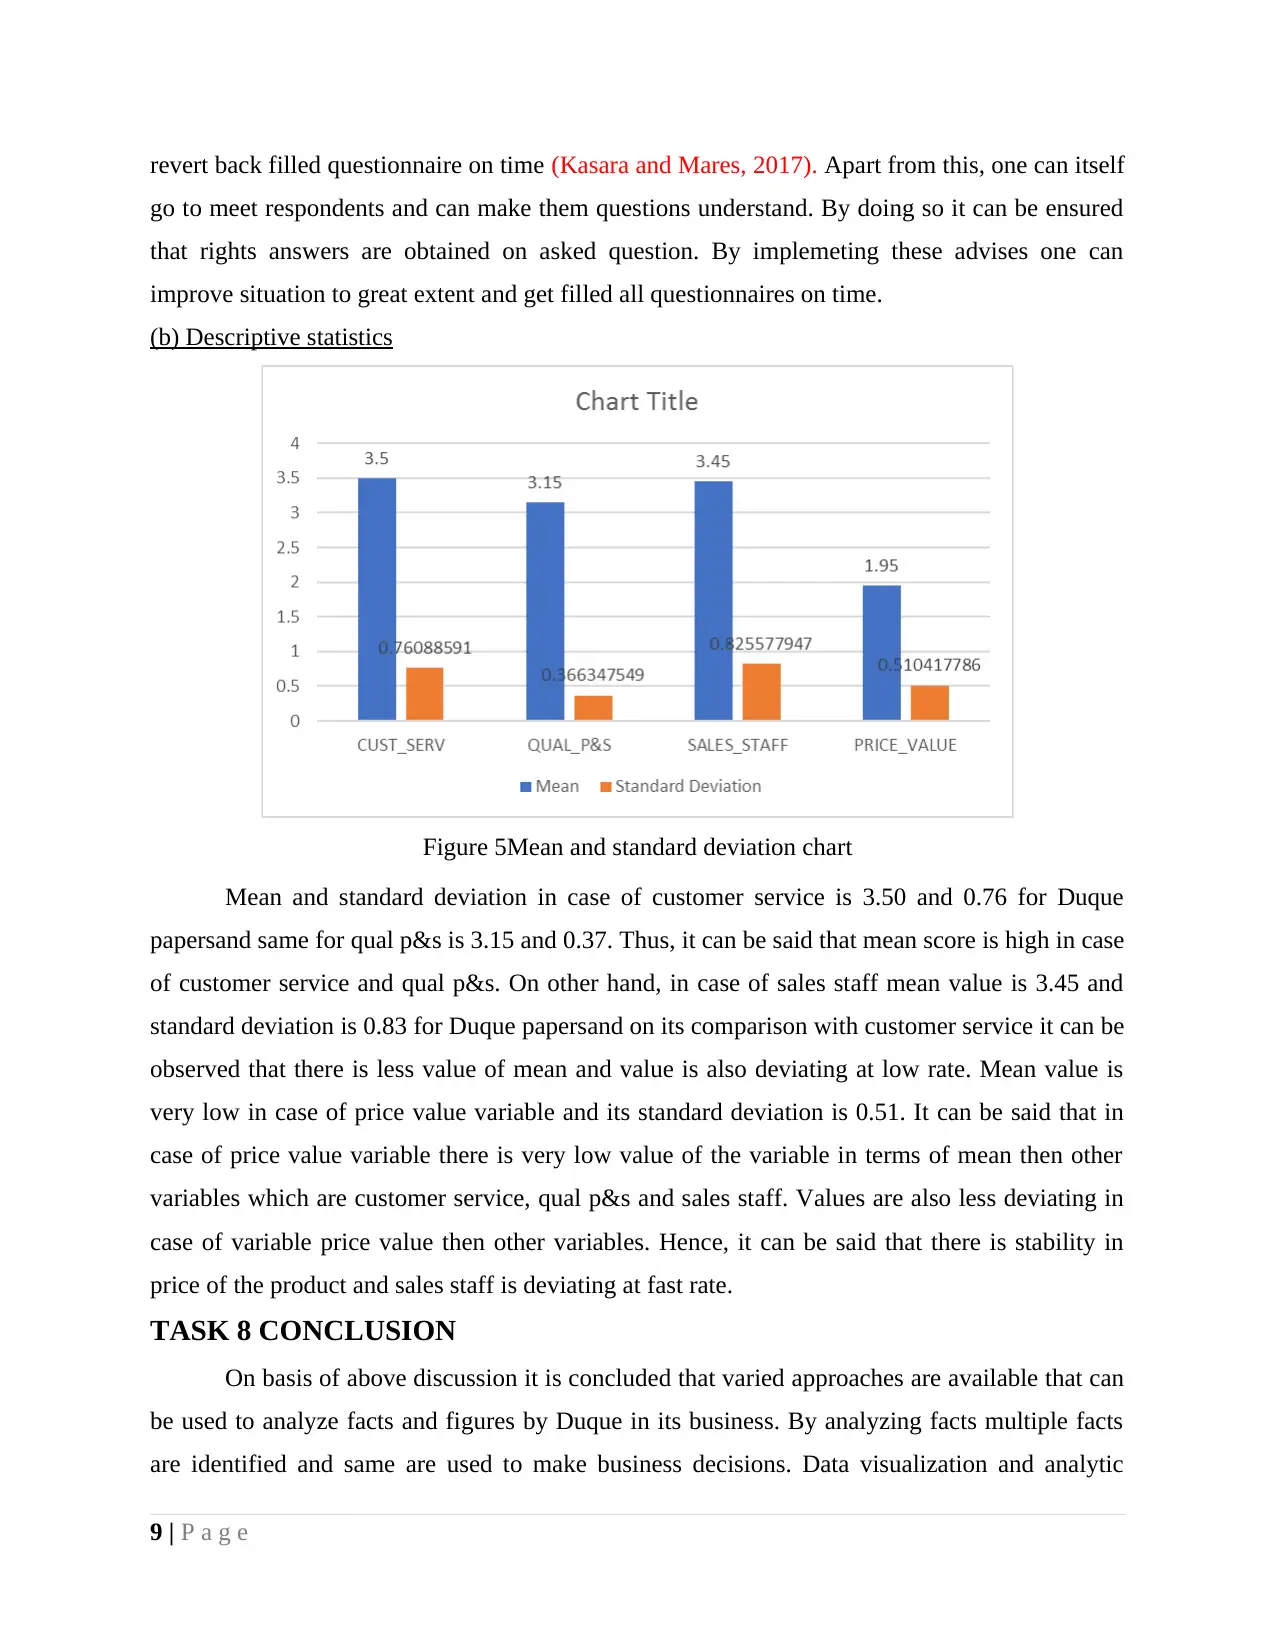
Figure 5Mean and standard deviation chart
Mean and standard deviation in case of customer service is 3.50 and 0.76 for Duque
papersand same for qual p&s is 3.15 and 0.37. Thus, it can be said that mean score is high in case
of customer service and qual p&s. On other hand, in case of sales staff mean value is 3.45 and
standard deviation is 0.83 for Duque papersand on its comparison with customer service it can be
observed that there is less value of mean and value is also deviating at low rate. Mean value is
very low in case of price value variable and its standard deviation is 0.51. It can be said that in
case of price value variable there is very low value of the variable in terms of mean then other
variables which are customer service, qual p&s and sales staff. Values are also less deviating in
case of variable price value then other variables. Hence, it can be said that there is stability in
price of the product and sales staff is deviating at fast rate.
TASK 8 CONCLUSION
On basis of above discussion it is concluded that varied approaches are available that can
be used to analyze facts and figures by Duque in its business. By analyzing facts multiple facts
are identified and same are used to make business decisions. Data visualization and analytic
9 | P a g e
go to meet respondents and can make them questions understand. By doing so it can be ensured
that rights answers are obtained on asked question. By implemeting these advises one can
improve situation to great extent and get filled all questionnaires on time.
(b) Descriptive statistics
Figure 5Mean and standard deviation chart
Mean and standard deviation in case of customer service is 3.50 and 0.76 for Duque
papersand same for qual p&s is 3.15 and 0.37. Thus, it can be said that mean score is high in case
of customer service and qual p&s. On other hand, in case of sales staff mean value is 3.45 and
standard deviation is 0.83 for Duque papersand on its comparison with customer service it can be
observed that there is less value of mean and value is also deviating at low rate. Mean value is
very low in case of price value variable and its standard deviation is 0.51. It can be said that in
case of price value variable there is very low value of the variable in terms of mean then other
variables which are customer service, qual p&s and sales staff. Values are also less deviating in
case of variable price value then other variables. Hence, it can be said that there is stability in
price of the product and sales staff is deviating at fast rate.
TASK 8 CONCLUSION
On basis of above discussion it is concluded that varied approaches are available that can
be used to analyze facts and figures by Duque in its business. By analyzing facts multiple facts
are identified and same are used to make business decisions. Data visualization and analytic
9 | P a g e
⊘ This is a preview!⊘
Do you want full access?
Subscribe today to unlock all pages.
Trusted by 1+ million students worldwide
1 out of 19
Related Documents


Your All-in-One AI-Powered Toolkit for Academic Success.
+13062052269
info@desklib.com
Available 24*7 on WhatsApp / Email
![[object Object]](/_next/static/media/star-bottom.7253800d.svg)
Unlock your academic potential
Copyright © 2020–2026 A2Z Services. All Rights Reserved. Developed and managed by ZUCOL.