Ukraine's Economic Development Path Since 1980: An Analysis
VerifiedAdded on 2023/03/30
|12
|2162
|147
Report
AI Summary
This report examines Ukraine's economic development path since 1980, focusing on key indicators such as GDP, Human Development Index (HDI), GINI index, and unemployment rates. It analyzes the impact of population changes, income inequality, and the application of economic theories like Lewis's model and Adam Smith's principles on Ukraine's growth. The report highlights Ukraine's progress in HDI, driven by improvements in education and life expectancy, while also addressing challenges such as unemployment and the need for economic reforms to enhance global competitiveness. The analysis includes discussions on agricultural contributions, manufacturing sector performance, and the importance of foreign investment and anti-corruption measures for sustainable economic development. The report concludes that continued focus on agriculture, innovation, and strategic economic policies will be crucial for Ukraine's future growth and stability.
Running head: UKRAINIAN GROWTH 1
Ukraine’s Development Path
Student’s name
Institution
Abstract
Ukraine’s Development Path
Student’s name
Institution
Abstract
Paraphrase This Document
Need a fresh take? Get an instant paraphrase of this document with our AI Paraphraser
UKRAINIAN GROWTH 2
Ukraine is an emerging market that gained independence in 1991 following the Soviet Union’s
collapse. A recent special landmark for Ukraine’s economy was in 2018 when its Gross
Domestic Product (GDP) growth accelerated to 3.3 percent. The growth was fostered by a
conducive environment for domestic demands of products and good agricultural harvest. Its GDP
is averaged at 88.24 USD Billion since 1987. In 2018, Ukraine’s Human Development Index
was 0.751 hence termed as a high human development country. Its current Consumer Price Index
(CPI) stands at 8.8%.
Keywords: Gross Domestic Product, Human Development Index, Consumer Price Index.
Table of Contents
UKRAINIAN GROWTH 3
Table of Figures...........................................................................................................................................4
Ukraine’s HDI from 1990 to 2017........................................................................................................4
Ukraine’s GPD from 1998 to 2017.......................................................................................................4
Ukraine’s Development Path.......................................................................................................................5
Introduction.............................................................................................................................................5
Population...............................................................................................................................................5
Equality in Ukraine..................................................................................................................................6
Unemployment Rates..............................................................................................................................6
Human Development Index.....................................................................................................................7
Lewis Theory of Economics......................................................................................................................7
Adam Smith Theory of Economics...........................................................................................................8
Growth Domestic Product.......................................................................................................................9
Financing the GDP...............................................................................................................................9
Conclusion.............................................................................................................................................10
References.................................................................................................................................................11
⊘ This is a preview!⊘
Do you want full access?
Subscribe today to unlock all pages.
Trusted by 1+ million students worldwide
UKRAINIAN GROWTH 4
Table of Figures
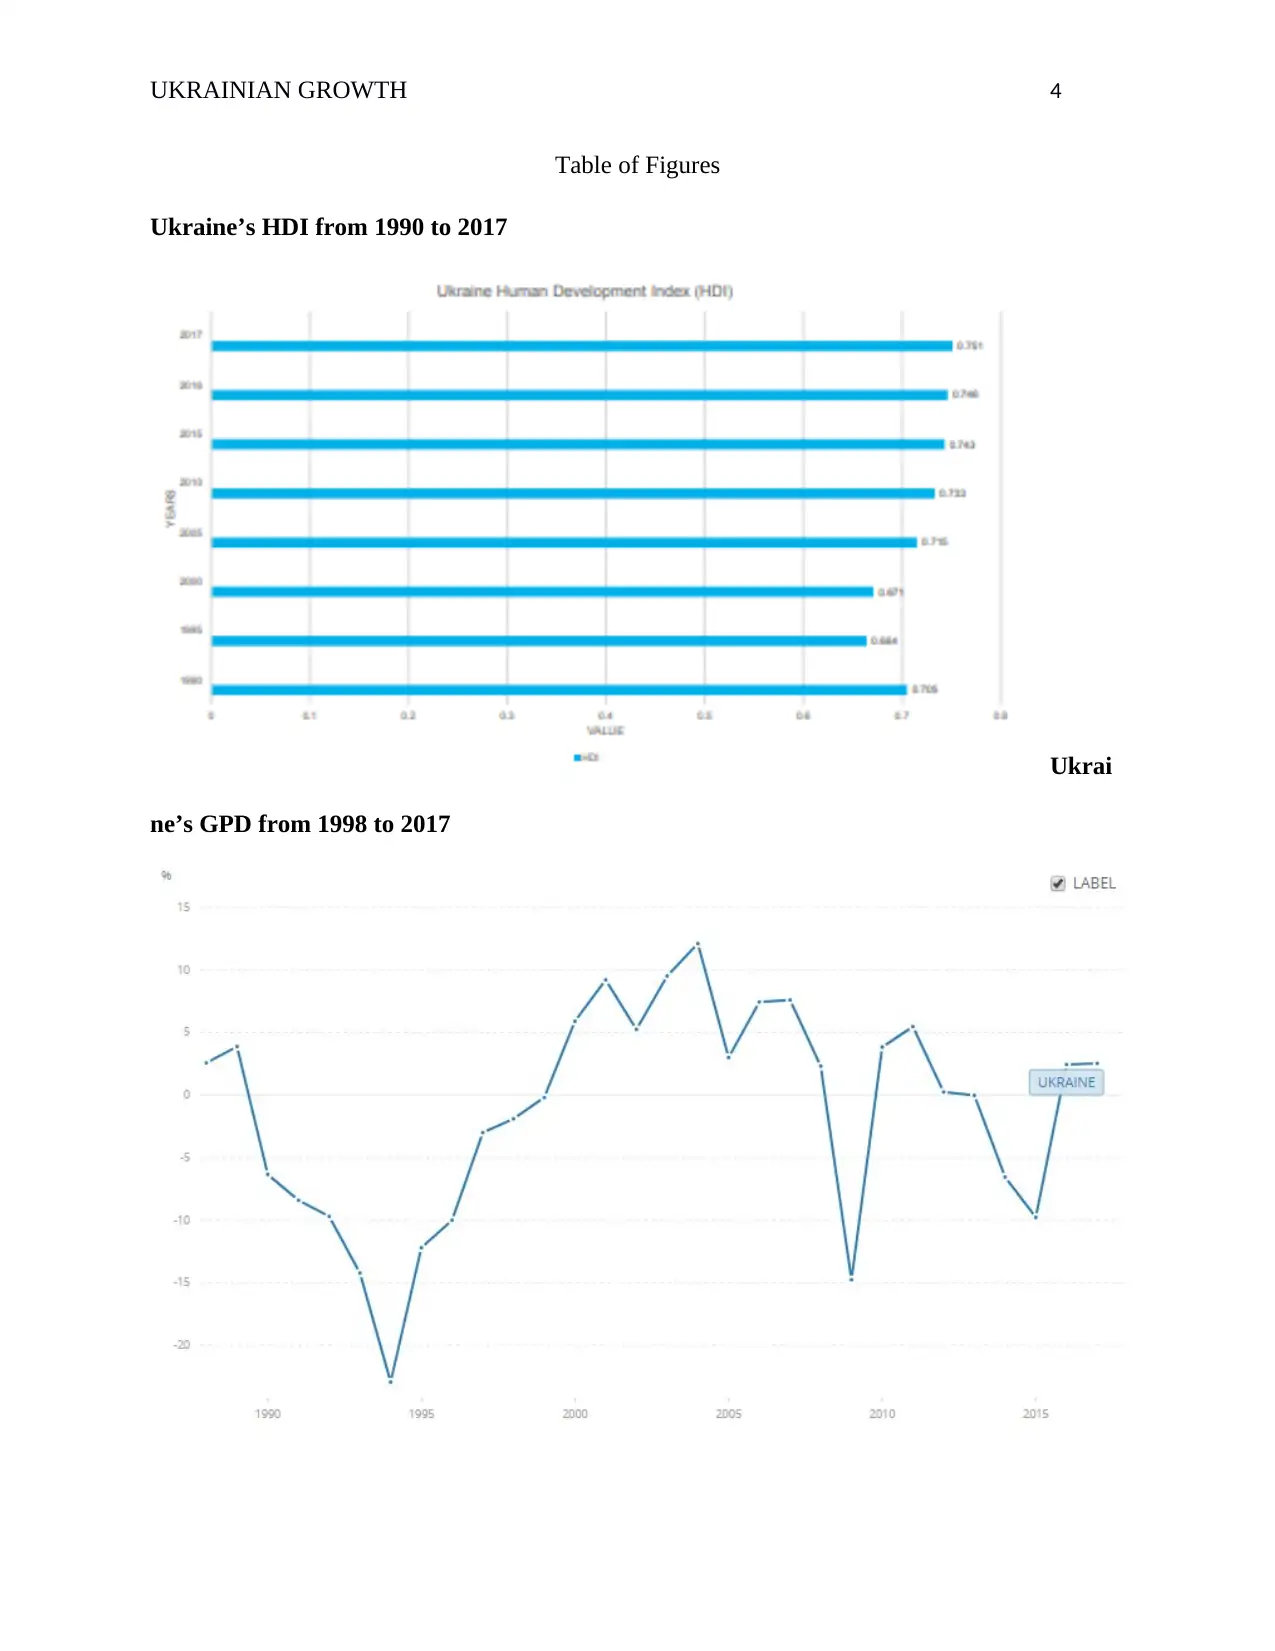
Ukraine’s HDI from 1990 to 2017
Ukrai
ne’s GPD from 1998 to 2017
Table of Figures
Ukraine’s HDI from 1990 to 2017
Ukrai
ne’s GPD from 1998 to 2017
Paraphrase This Document
Need a fresh take? Get an instant paraphrase of this document with our AI Paraphraser
UKRAINIAN GROWTH 5
Ukraine’s Development Path
Introduction
Ukraine is a middle-income economy in the lower division. It has a Gross National Income
(GNI) per capita of $8,130, a $2,963 GDP per capita in 2018, and a GDP of $112.154 Billion in
2017. The following report shall look at the development path taken by Ukraine since the 1980s
to date giving insights from the key economic characteristics such as income per capita, Human
Development Index, population among others that amplify its economic development.
Population
The total population of Ukraine is estimated to be about 42.5 million as recorded in 2018, which
represents 0.66 percent of the world’s population. The country has experienced challenges in the
economic, political, and security spheres that have greatly contributed to the status of its
economy (Shumska & Nezhyvenko, 2013). After independence, Ukraine’s GDP stood at $1,307
per capita. The population had been decreasing since 1993 from 52.179 million to 42.2 million in
2018. However, there was an acute increase from 1980 to 1993 before the decrease was
experienced. This could be as a result of political instability, especially after the fall of the Soviet
Union that oversaw the independence of the nation.
About 1.7 million Ukrainians live below the poverty line, which is up to 4.02% of the total
population (("Ukraine | Data", 2019)). One of the factors that have led to this is the increase in
population-migration of the people from rural to urban areas hence heightening unemployment
cases and as a result, leading to limited housing facilities (Lukianenko & Oliskevych, 2017). To
curb this, the government can make investments in infrastructure as well as give access to
education for everyone. Markets for products and services should also be made available to
everybody in aid to reduce the poverty rate in the country.
UKRAINIAN GROWTH 6
Equality in Ukraine
Ukraine ranks as one of the equal nations in the world (“Inequality index”, 2019). According to
the Gini index estimate made by the World Bank, Ukraine stood at 25.05 in 2015. Since the
1990’s the highest Gini index was recorded in 1995 at a value of 39.30 and the minimum value
at 24.10 in 2014. This shows income distribution between the richest and the poorest in Ukraine.
It compares to Norway and Slovenia whose Gini indices are 26.8 and 25.7 by 2014 respectively.
However, some factors might lead to an increase in inequality within the country. This include,
inequality in the labor market resulting from high migration rates to the urban areas as well as
limited opportunities to sustain such trends (Skorobogatova, 2016). Nevertheless, there are
factors that could lead to a reduction in the inequality that could arise, and these are taxation and
social spending. The recent Gini index, as recorded by the World Bank in 2016, shows a 0.5
reduction margin to 25.0 as compared to that of 2015.
Unemployment Rates
The number of unemployed persons was last recorded to be 311.40 thousand in April 2019,
which was a reduction from 340.70 in March the same year. The highest unemployment rate was
recorded in 2000 at 1.234 million people and the lowest at 10 thousand in 1992 soon after
independence. The changes evident have been as a result of the change in economic activities
within the nation. In 2018, the jobless rate stood at 9.3%, implying a 0.3% reduction in the
previous year. The average unemployment rate was at 8.57% since the year 2003 up to 2018.
The highest rate was recorded in 2014 at 10.60% and the lowest in 2013 at 6.30% ("Ukraine
Employment Rate", 2019). Throughout time, the unemployment rate based on gender has seen a
lower rate for women averagely at 8.5 percent and 10.6 percent for men. On the other hand, an
increase in the jobless rate implied a decrease in the employment rate from 66.20% in the third
⊘ This is a preview!⊘
Do you want full access?
Subscribe today to unlock all pages.
Trusted by 1+ million students worldwide
UKRAINIAN GROWTH 7
quarter to 66.10% in the fourth quarter of 2018. The rate has been averagely 65.63% from 2005
to 2018 with the highest rate recorded in 2008 at 68.10 percent and the minimum at 63.30
percent in 2017, the first quarter.
Human Development Index
Ukraine’s Human Development Index for 2018 was 0.751 hence termed as a high human
development country ranking it at position 88 in the world. Since 1990, its HDI has been
increasing with a margin of 6.5 percent i.e., from 0.705 to 0.751 in 2018. The life expectancy has
also increased with a mean of 2.4 years from 1990 i.e., an average annual growth rate of 0.22%
and stands currently at 72.2 years (Ukraine Life expectancy, 1950-2018 -knoema.com, 2019).
There two aspects that have been fostering Ukraine to raise its global competitive ability are
knowledge and education. The years of schooling and expected years of schooling have
increased by a mean of 2.2 years and 2.6 years, respectively. The GNI which currently is at
$8,930, however, has decreased averagely by 24.4% since 1990 from $10,748.
Lewis Theory of Economics
Lewis model of economic development divides the economy into two sectors, capitalist and
subsistence, which implies the manufacturing and the agricultural sector, respectively. To an
extension, the capitalist also includes mining and plantation. Subsistence sector is said to be
labor intensive (Lewis & Mizen, 2000). In 2018, there was a high record harvest totaling to 70.2
million tones grain harvest. This increased Ukraine’s exports hence an increase in foreign
currency earnings amounting to over $17billion. However, through an act of parliament, the ban
for the open land market was extended although it was stipulated that it would lead to 1.5% GDP
growth annually. Political force seems to take root in this case following restrictions to open land
markets. Agriculture, therefore, makes a significant contribution to Ukraine’s economy. In the
Paraphrase This Document
Need a fresh take? Get an instant paraphrase of this document with our AI Paraphraser
UKRAINIAN GROWTH 8
manufacturing sector, an increase of 7.40 percent was recorded in April 2019. Averagely, it has
been noted that production has stood at -4.05% from 2012 to 2019. The maximum percent
recorded was 9.90 and the lowest at -32.30% in 2014. Since the manufacturing sector is mainly
in the urban areas, rural to urban migration has been at peak, and this has affected the economy
intensely since this sector has not been operating within the expectations. The successes and
growth in the economy of the country could be attributed to industries such as the fuel and
chemical industries and majorly to agriculture.
Adam Smith Theory of Economics
Adam Smith known as the father of economics advocated for individuals in the society to be
given the discretion to peruse their own economic activity, and this would lead to maximized
input as a result of members working to the best of their ability (Brown, 2013). In terms of
technology and innovation, which are prime pillars to creativity, Ukraine ranks at 13th position
among 124 countries with an estimated $2.5 billion exports in 2015. Ukraine has the potential to
become an innovation-driven economy (Mazur, 2011). The workforce is talented and technically
qualified, with 80% of youths in the gap of 19-25 years enrolled in the universities. The country
is said to have the largest pool in the World of programmers and IT developers. In global
innovation, Ukraine has risen seven places and now ranked 43 globally. However, the country
still faces a challenge as far as the widespread adoption of technology is concerned hence a
limitation to the immense progress as proposed by Smith. This could be attributed to the low
standards of living as well as average income hence affecting the global competitiveness
(Vinnychuk & Ziukov, 2013). There is, therefore, a need to reform the entrepreneurial and
innovation ecosystem in order to foster economic progress.
UKRAINIAN GROWTH 9
Growth Domestic Product
There was a 3.5 percent growth in Ukraine’s economy recorded in the first half of 2018, as a
result of the high record of early agricultural harvest as well as strong consumption resulting
from higher salaries, remittances, and pensions (("Ukraine | Data", 2019). There was a previous
rise by 2.5% of the GDP in 2017, and the government predicts a 3 percent rise by the year 2019.
However, the uncertainty in the 2019 elections holds back the key reforms stipulated within the
same prediction. This, however, has not relented the projection for 2020 to be made at an
estimate of 4 percent especially as a result of the uncertainties surrounding the elections expected
to subside. Nevertheless, deterioration in investor confidence and financing difficulties could
lead in contrast to a 2 percent fall altogether in the year 2019 resulting from the uncertainties
mentioned. There is hence a need to put emphasis on the environmental production, education,
and health sectors, which can lead to improvements in the nation’s economy.
Financing the GDP
Financing for the large public debts owed, for example, to the International Monetary Fund
(IMF) is crucial. Formulation of a credible and achievable budget is, therefore, necessary to meet
the fiscal deficit target of 2.5% GDP. Recent reforms that have been made in the country such as
house utility subsidies, education, health among others would call for affordable implementation
(Sum, 2012). It will also be important to secure financing from global lenders, foster Foreign
Direct Investment (FDI), and boost non-traditional exports (Derkatch, 2018). To sustain a good
fiscal environment, measures that reduce revenues such as implementing capital exit tax in place
of corporate income tax should be by all means be avoided. Creation of an efficient logistics
system to target the boost of exports could lead to effective integration in the global economy
hence placing the country at a competitive position worldwide. To align the political force
⊘ This is a preview!⊘
Do you want full access?
Subscribe today to unlock all pages.
Trusted by 1+ million students worldwide
UKRAINIAN GROWTH 10
properly, there is a need to strengthen the rule of law and boost the anti-corruption measures with
attempts to clean up the non-performing loans (Yakubovskiy et al., 2017). Finally, managing
public assets should be improved, utilize river transport the more, railway system reformation
and last but not least, oversee the addressing of inefficiencies evident in the storage system.
Conclusion
In conclusion, growth in the three components of HDI i.e., income index (standard of living),
education and life expectancy as evident in the previous years, will see an increase in the Human
Development Index. Ukraine will remain as an equal nation in the coming years based on
progress seen in the last 20 years. The poverty rates are also expected to reduce as more focus is
given to agriculture and innovation sectors, which are a big boost to the Ukrainian economy.
With the right measures put in place, the Gross Domestic Product value is also expected to rise.
Paraphrase This Document
Need a fresh take? Get an instant paraphrase of this document with our AI Paraphraser
UKRAINIAN GROWTH 11
References
Brown, Maurice. (2013). Adam Smith's Economics: Its place in the Development of Economic
Thought. Routledge.
Derkatch, D. (2018). Ukraine: Economic Growth Depends on Reforms and Financing. Retrieved
from
Inequality index (2019). Retrieved from
Lewis, M. K., & Mizen, P. D. (2012). Monetary economics. OUP Catalogue
Lukianenko, I., & Oliskevych, M. (2017). Evidence of asymmetries and nonlinearity of
unemployment and labour force participation rate in Ukraine. Prague Economic
Papers, 2017(5), 578-601.
Mazur, I. (2011). Institutionalization of shadow economy in Ukraine. Ekonomika i Organizacja
Gospodarki Żywnościowej, Warszawa: SGGW, (94), 5-23.
Shumska, S. S., & Nezhyvenko, O. V. (2013). Shadow economy in Ukraine: Methodology and
evaluation. Актуальні проблеми економіки, (10), 74-83.
Skorobogatova, N. (2016). Macroeconomic instability: its causes and consequences for the
economy of Ukraine. Eastern Journal of European Studies, 7(1), 63-80.
Sum, V. (2012). Economic policy uncertainty and stock market performance: evidence from the
European Union, Croatia, Norway, Russia, Switzerland, Turkey and Ukraine. Ukraine |
Data. (2019). Retrieved from https://data.worldbank.org/country/ukraine
Ukraine Employment Rate (2019). Retrieved from
Ukraine Life expectancy, 1950-2018 -knoema.com. (2019). Retrieved from
UKRAINIAN GROWTH 12
Yakubovskiy, M., Liashenko, V., Kamińska, B., & Kvilinskyi, O. (2017). Economy
modernization of industrial regions (based on the example of Ukraine). Economic
transformation in Ukraine: comparative analysis and European experience, 12-29.
Vinnychuk, I., & Ziukov, S. (2013). Shadow economy in Ukraine: modelling and
analysis. Business Systems & Economics, 3(2), 141-152.
⊘ This is a preview!⊘
Do you want full access?
Subscribe today to unlock all pages.
Trusted by 1+ million students worldwide
1 out of 12
Related Documents


Your All-in-One AI-Powered Toolkit for Academic Success.
+13062052269
info@desklib.com
Available 24*7 on WhatsApp / Email
![[object Object]](/_next/static/media/star-bottom.7253800d.svg)
Unlock your academic potential
Copyright © 2020–2026 A2Z Services. All Rights Reserved. Developed and managed by ZUCOL.