Analyzing Impact of WCM & CG on Firm Performance: Detailed Report
VerifiedAdded on 2023/06/10
|24
|6813
|72
Report
AI Summary
This report analyzes the impact of working capital management (WCM) and corporate governance (CG) on firm performance, using Return on Assets (ROA), Return on Equity (ROE), and Net Profit Margin (NPM) as key performance indicators. WCM is assessed through metrics like Cash Conversion Cycle (CCC), Average Collection Period (ACP), Average Inventory Period (AIP), and Average Payment Period (APP). CG is evaluated using Board Size (BSIZE), Non-Executive Directors (NEDs), and CEO Duality. The analysis incorporates control variables such as firm size (FSIZE), leverage, and liquidity. Descriptive statistics, correlation analysis, and linear regression models are employed to test hypotheses regarding the relationships between these variables. The findings suggest significant correlations between WCM components like ACP and APP, and firm performance, as well as between CG factors like BSIZE and CEO duality, and performance metrics. Leverage is found to have a negative correlation with firm performance, while liquidity and firm size show positive correlations.
Running head: IMPACT OF WCM AND CG ON FIRM PERFORMANCE
IMPACT OF WCM AND CG ON FIRM PERFORMANCE
Name of Student
Name of University
Author Note
IMPACT OF WCM AND CG ON FIRM PERFORMANCE
Name of Student
Name of University
Author Note
Paraphrase This Document
Need a fresh take? Get an instant paraphrase of this document with our AI Paraphraser
1IMPACT OF WCM AND CG ON FIRM PERFORMANCE
Table of Contents
Chapter 4..........................................................................................................................................2
Analysis.......................................................................................................................................2
Descriptive Statistics...............................................................................................................3
Correlation...............................................................................................................................5
Regression................................................................................................................................8
Discussion..................................................................................................................................11
Chapter 5........................................................................................................................................15
Conclusion.................................................................................................................................15
Limitations.................................................................................................................................16
Further Research........................................................................................................................17
2IMPACT OF WCM AND CG ON FIRM PERFORMANCE
Chapter 4
Analysis
The results of the analysis of the connection between firm performance and working
capital management and again on how the firm performance might be affected by corporate
governance of the firm are hence discussed. To study these two relationships the study first
defined firm performance using the Return on Asset or the ROA, the Return on Equity or the
ROE and the Net Profit Margin or NPM of the firm. The study then defined a number of
parameters to gauge the working capital management, using aspects such as, Cash Conversion
Cycle or CCC, the ACP or the Average Collection Period, the AIP or the Average Inventory
Period and the APP or Average Payment Period. The idea is to see how each of these aspects
may impact each of the parameters which represent firm performance. Again, the study defined a
number of parameters to gauge the corporate governance, using aspects such as, Board Size
denoted as BSIZE, Non-executive directors denoted as NEDs and CEO Duality. The study then
investigates the relationship between these parameters with those of firm performance.
Furthermore the study also considers a number of control variables such as firm size or FSIZE,
LEVERAGE and LIQUIDITY.
This section reports on the results of the tests for validity of the seven hypotheses as
defined for the purpose of the study. The analysis included a scrutiny of the descriptive measures
on all the variables defined. The correlation measure between each of the independent variables
with that of the dependent variable, firm performance was then computed to look for any
tentative linear relationship. The study further explores the veracity of the conjectures presuming
a linear relationship between the dependent and seven of the independent variables as specified
⊘ This is a preview!⊘
Do you want full access?
Subscribe today to unlock all pages.
Trusted by 1+ million students worldwide
3IMPACT OF WCM AND CG ON FIRM PERFORMANCE
in the previous sections using linear regression analysis. It is in this part of the analysis that the
relationship is considered in light of the control variables as well.
Descriptive Statistics
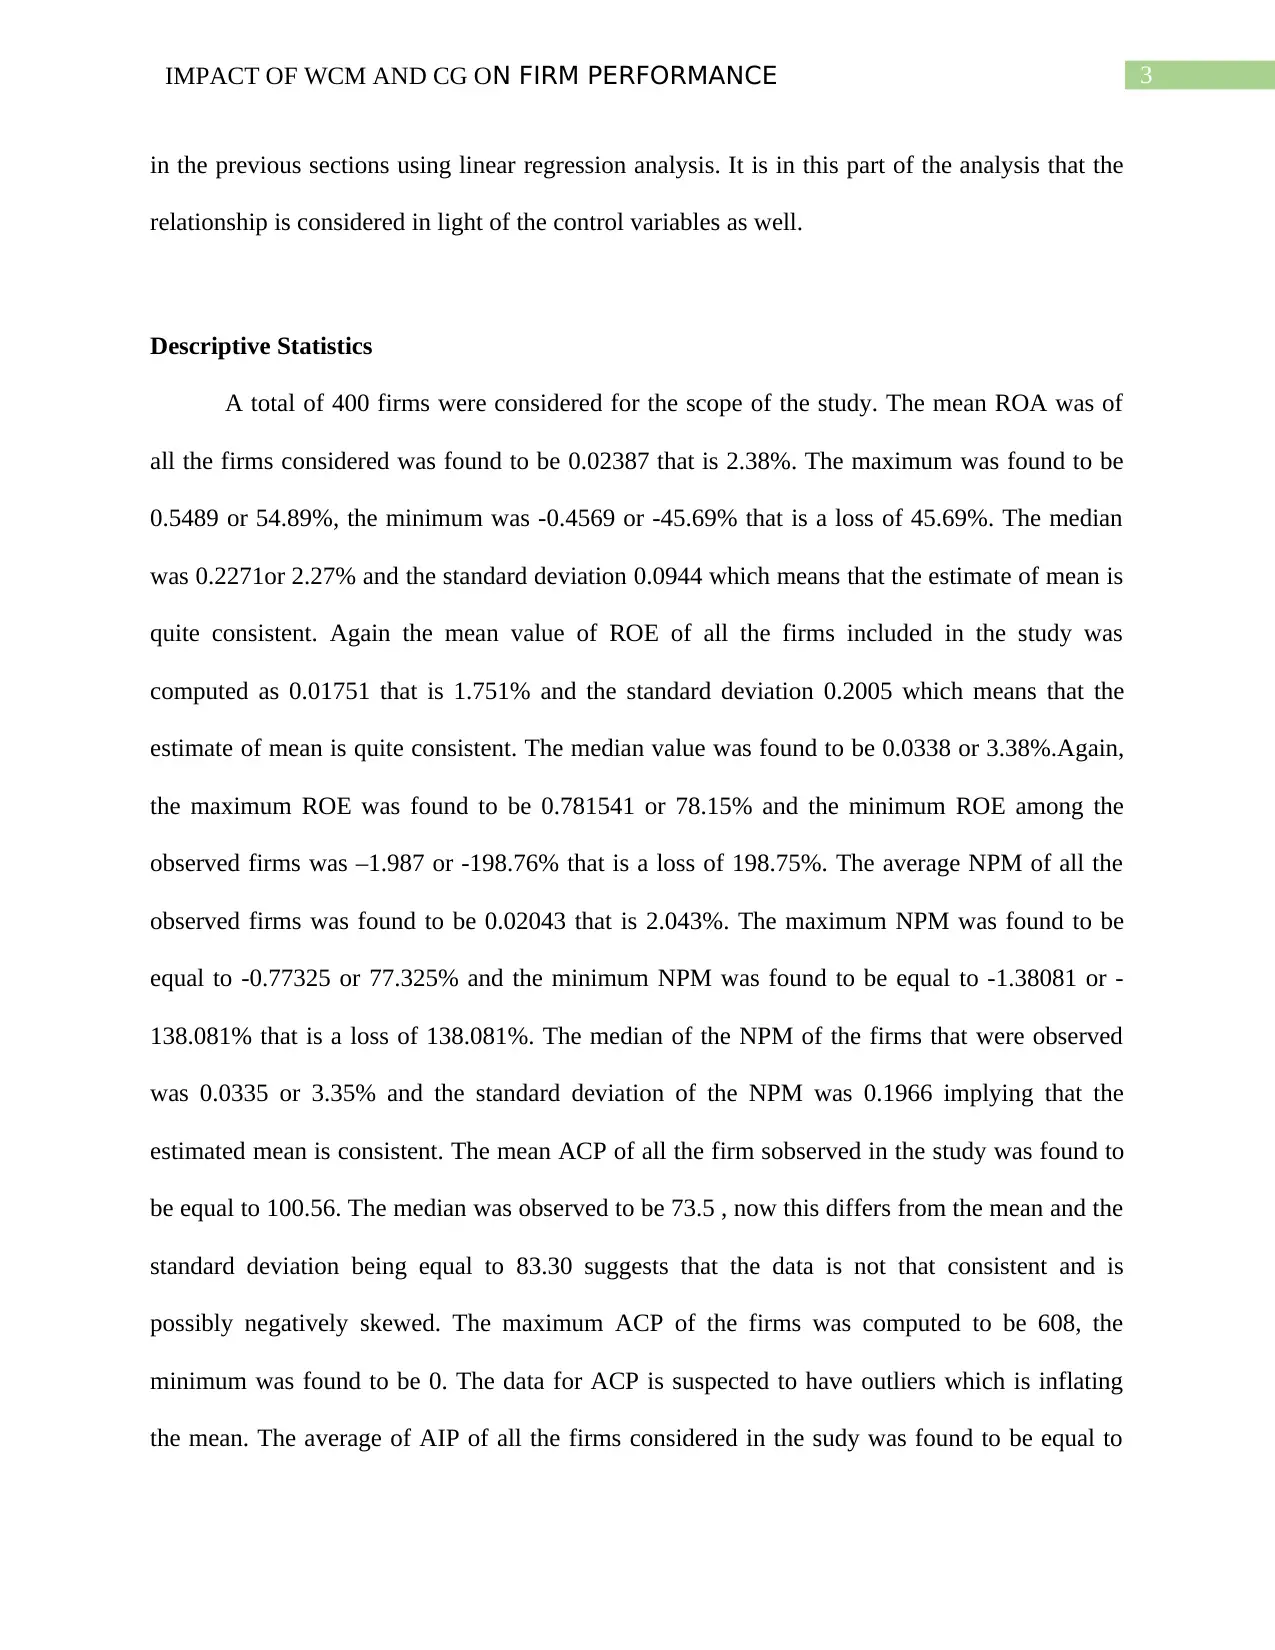
A total of 400 firms were considered for the scope of the study. The mean ROA was of
all the firms considered was found to be 0.02387 that is 2.38%. The maximum was found to be
0.5489 or 54.89%, the minimum was -0.4569 or -45.69% that is a loss of 45.69%. The median
was 0.2271or 2.27% and the standard deviation 0.0944 which means that the estimate of mean is
quite consistent. Again the mean value of ROE of all the firms included in the study was
computed as 0.01751 that is 1.751% and the standard deviation 0.2005 which means that the
estimate of mean is quite consistent. The median value was found to be 0.0338 or 3.38%.Again,
the maximum ROE was found to be 0.781541 or 78.15% and the minimum ROE among the
observed firms was –1.987 or -198.76% that is a loss of 198.75%. The average NPM of all the
observed firms was found to be 0.02043 that is 2.043%. The maximum NPM was found to be
equal to -0.77325 or 77.325% and the minimum NPM was found to be equal to -1.38081 or -
138.081% that is a loss of 138.081%. The median of the NPM of the firms that were observed
was 0.0335 or 3.35% and the standard deviation of the NPM was 0.1966 implying that the
estimated mean is consistent. The mean ACP of all the firm sobserved in the study was found to
be equal to 100.56. The median was observed to be 73.5 , now this differs from the mean and the
standard deviation being equal to 83.30 suggests that the data is not that consistent and is
possibly negatively skewed. The maximum ACP of the firms was computed to be 608, the
minimum was found to be 0. The data for ACP is suspected to have outliers which is inflating
the mean. The average of AIP of all the firms considered in the sudy was found to be equal to
in the previous sections using linear regression analysis. It is in this part of the analysis that the
relationship is considered in light of the control variables as well.
Descriptive Statistics
A total of 400 firms were considered for the scope of the study. The mean ROA was of
all the firms considered was found to be 0.02387 that is 2.38%. The maximum was found to be
0.5489 or 54.89%, the minimum was -0.4569 or -45.69% that is a loss of 45.69%. The median
was 0.2271or 2.27% and the standard deviation 0.0944 which means that the estimate of mean is
quite consistent. Again the mean value of ROE of all the firms included in the study was
computed as 0.01751 that is 1.751% and the standard deviation 0.2005 which means that the
estimate of mean is quite consistent. The median value was found to be 0.0338 or 3.38%.Again,
the maximum ROE was found to be 0.781541 or 78.15% and the minimum ROE among the
observed firms was –1.987 or -198.76% that is a loss of 198.75%. The average NPM of all the
observed firms was found to be 0.02043 that is 2.043%. The maximum NPM was found to be
equal to -0.77325 or 77.325% and the minimum NPM was found to be equal to -1.38081 or -
138.081% that is a loss of 138.081%. The median of the NPM of the firms that were observed
was 0.0335 or 3.35% and the standard deviation of the NPM was 0.1966 implying that the
estimated mean is consistent. The mean ACP of all the firm sobserved in the study was found to
be equal to 100.56. The median was observed to be 73.5 , now this differs from the mean and the
standard deviation being equal to 83.30 suggests that the data is not that consistent and is
possibly negatively skewed. The maximum ACP of the firms was computed to be 608, the
minimum was found to be 0. The data for ACP is suspected to have outliers which is inflating
the mean. The average of AIP of all the firms considered in the sudy was found to be equal to
Paraphrase This Document
Need a fresh take? Get an instant paraphrase of this document with our AI Paraphraser
4IMPACT OF WCM AND CG ON FIRM PERFORMANCE
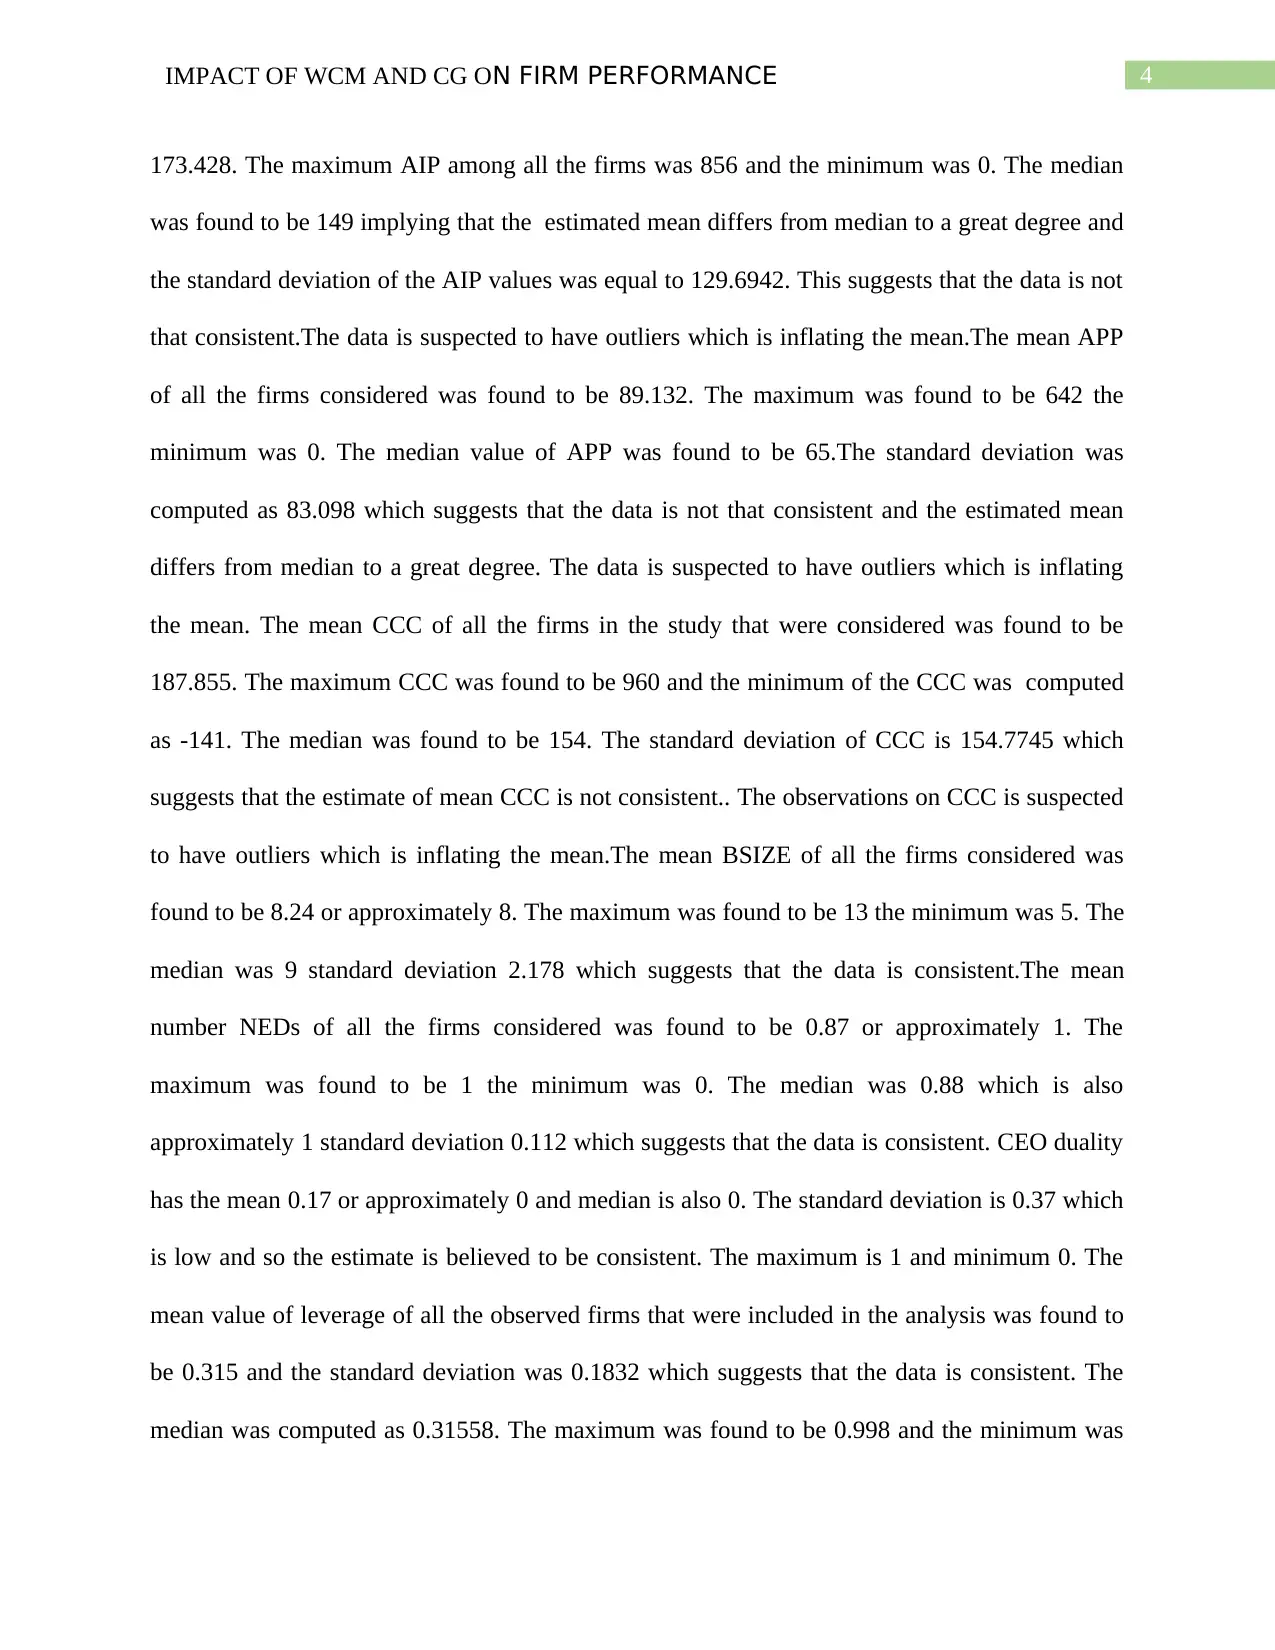
173.428. The maximum AIP among all the firms was 856 and the minimum was 0. The median
was found to be 149 implying that the estimated mean differs from median to a great degree and
the standard deviation of the AIP values was equal to 129.6942. This suggests that the data is not
that consistent.The data is suspected to have outliers which is inflating the mean.The mean APP
of all the firms considered was found to be 89.132. The maximum was found to be 642 the
minimum was 0. The median value of APP was found to be 65.The standard deviation was
computed as 83.098 which suggests that the data is not that consistent and the estimated mean
differs from median to a great degree. The data is suspected to have outliers which is inflating
the mean. The mean CCC of all the firms in the study that were considered was found to be
187.855. The maximum CCC was found to be 960 and the minimum of the CCC was computed
as -141. The median was found to be 154. The standard deviation of CCC is 154.7745 which
suggests that the estimate of mean CCC is not consistent.. The observations on CCC is suspected
to have outliers which is inflating the mean.The mean BSIZE of all the firms considered was
found to be 8.24 or approximately 8. The maximum was found to be 13 the minimum was 5. The
median was 9 standard deviation 2.178 which suggests that the data is consistent.The mean
number NEDs of all the firms considered was found to be 0.87 or approximately 1. The
maximum was found to be 1 the minimum was 0. The median was 0.88 which is also
approximately 1 standard deviation 0.112 which suggests that the data is consistent. CEO duality
has the mean 0.17 or approximately 0 and median is also 0. The standard deviation is 0.37 which
is low and so the estimate is believed to be consistent. The maximum is 1 and minimum 0. The
mean value of leverage of all the observed firms that were included in the analysis was found to
be 0.315 and the standard deviation was 0.1832 which suggests that the data is consistent. The
median was computed as 0.31558. The maximum was found to be 0.998 and the minimum was
5IMPACT OF WCM AND CG ON FIRM PERFORMANCE
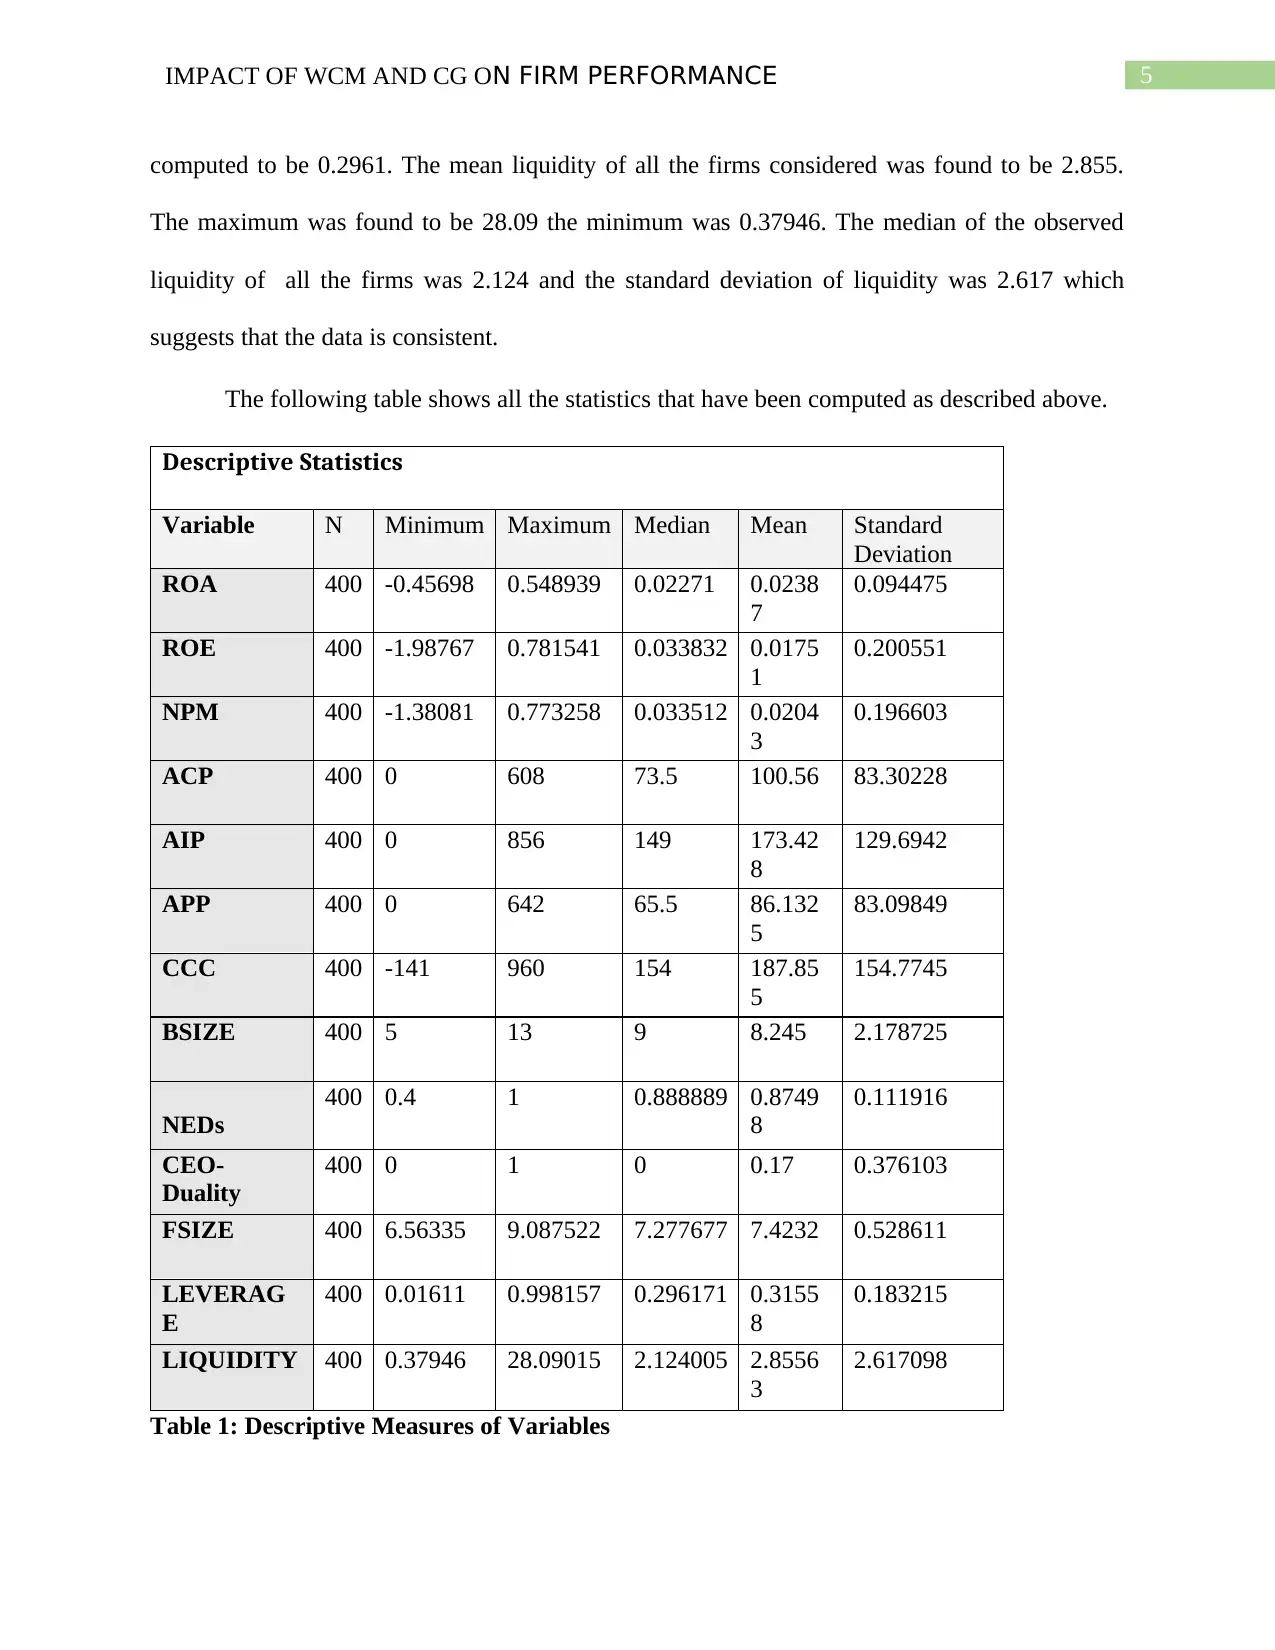
computed to be 0.2961. The mean liquidity of all the firms considered was found to be 2.855.
The maximum was found to be 28.09 the minimum was 0.37946. The median of the observed
liquidity of all the firms was 2.124 and the standard deviation of liquidity was 2.617 which
suggests that the data is consistent.
The following table shows all the statistics that have been computed as described above.
Descriptive Statistics
Variable N Minimum Maximum Median Mean Standard
Deviation
ROA 400 -0.45698 0.548939 0.02271 0.0238
7
0.094475
ROE 400 -1.98767 0.781541 0.033832 0.0175
1
0.200551
NPM 400 -1.38081 0.773258 0.033512 0.0204
3
0.196603
ACP 400 0 608 73.5 100.56 83.30228
AIP 400 0 856 149 173.42
8
129.6942
APP 400 0 642 65.5 86.132
5
83.09849
CCC 400 -141 960 154 187.85
5
154.7745
BSIZE 400 5 13 9 8.245 2.178725
NEDs
400 0.4 1 0.888889 0.8749
8
0.111916
CEO-
Duality
400 0 1 0 0.17 0.376103
FSIZE 400 6.56335 9.087522 7.277677 7.4232 0.528611
LEVERAG
E
400 0.01611 0.998157 0.296171 0.3155
8
0.183215
LIQUIDITY 400 0.37946 28.09015 2.124005 2.8556
3
2.617098
Table 1: Descriptive Measures of Variables
⊘ This is a preview!⊘
Do you want full access?
Subscribe today to unlock all pages.
Trusted by 1+ million students worldwide
6IMPACT OF WCM AND CG ON FIRM PERFORMANCE
Correlation
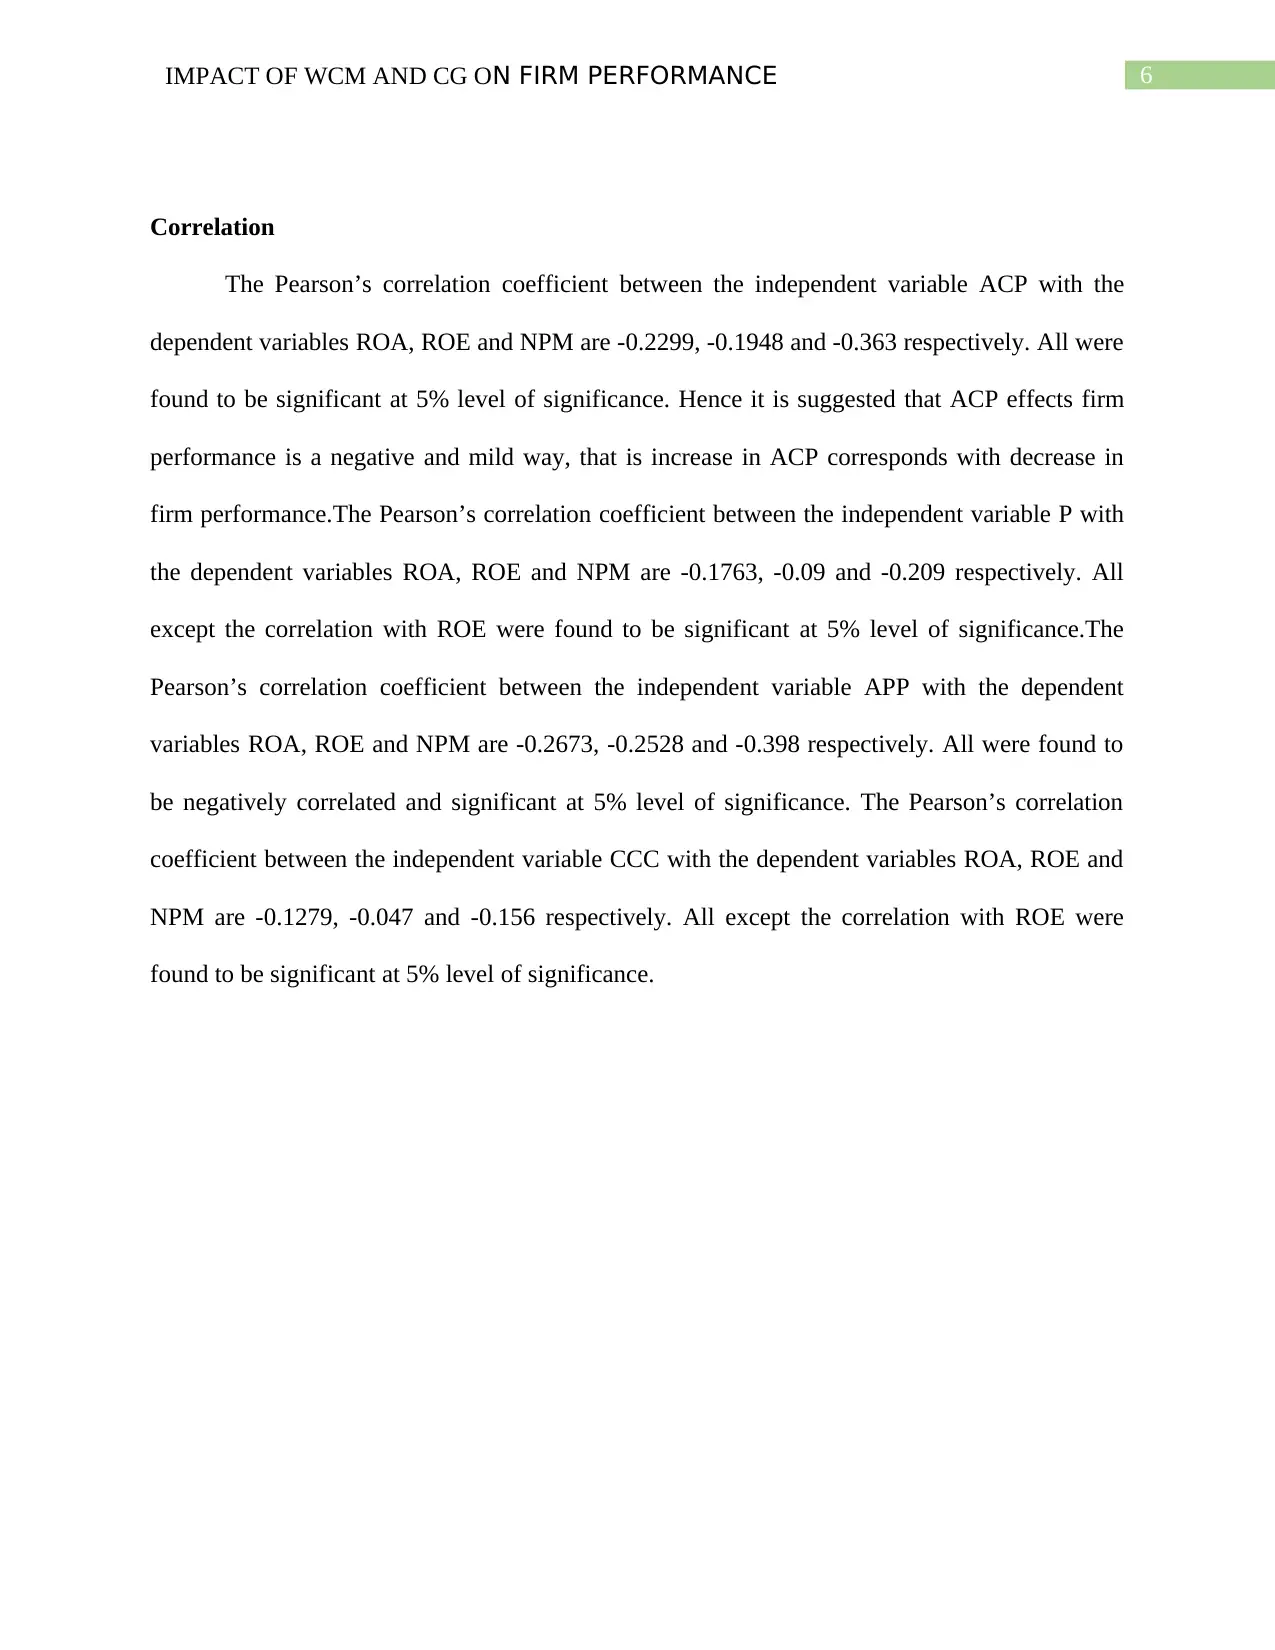
The Pearson’s correlation coefficient between the independent variable ACP with the
dependent variables ROA, ROE and NPM are -0.2299, -0.1948 and -0.363 respectively. All were
found to be significant at 5% level of significance. Hence it is suggested that ACP effects firm
performance is a negative and mild way, that is increase in ACP corresponds with decrease in
firm performance.The Pearson’s correlation coefficient between the independent variable P with
the dependent variables ROA, ROE and NPM are -0.1763, -0.09 and -0.209 respectively. All
except the correlation with ROE were found to be significant at 5% level of significance.The
Pearson’s correlation coefficient between the independent variable APP with the dependent
variables ROA, ROE and NPM are -0.2673, -0.2528 and -0.398 respectively. All were found to
be negatively correlated and significant at 5% level of significance. The Pearson’s correlation
coefficient between the independent variable CCC with the dependent variables ROA, ROE and
NPM are -0.1279, -0.047 and -0.156 respectively. All except the correlation with ROE were
found to be significant at 5% level of significance.
Correlation
The Pearson’s correlation coefficient between the independent variable ACP with the
dependent variables ROA, ROE and NPM are -0.2299, -0.1948 and -0.363 respectively. All were
found to be significant at 5% level of significance. Hence it is suggested that ACP effects firm
performance is a negative and mild way, that is increase in ACP corresponds with decrease in
firm performance.The Pearson’s correlation coefficient between the independent variable P with
the dependent variables ROA, ROE and NPM are -0.1763, -0.09 and -0.209 respectively. All
except the correlation with ROE were found to be significant at 5% level of significance.The
Pearson’s correlation coefficient between the independent variable APP with the dependent
variables ROA, ROE and NPM are -0.2673, -0.2528 and -0.398 respectively. All were found to
be negatively correlated and significant at 5% level of significance. The Pearson’s correlation
coefficient between the independent variable CCC with the dependent variables ROA, ROE and
NPM are -0.1279, -0.047 and -0.156 respectively. All except the correlation with ROE were
found to be significant at 5% level of significance.
Paraphrase This Document
Need a fresh take? Get an instant paraphrase of this document with our AI Paraphraser
7IMPACT OF WCM AND CG ON FIRM PERFORMANCE
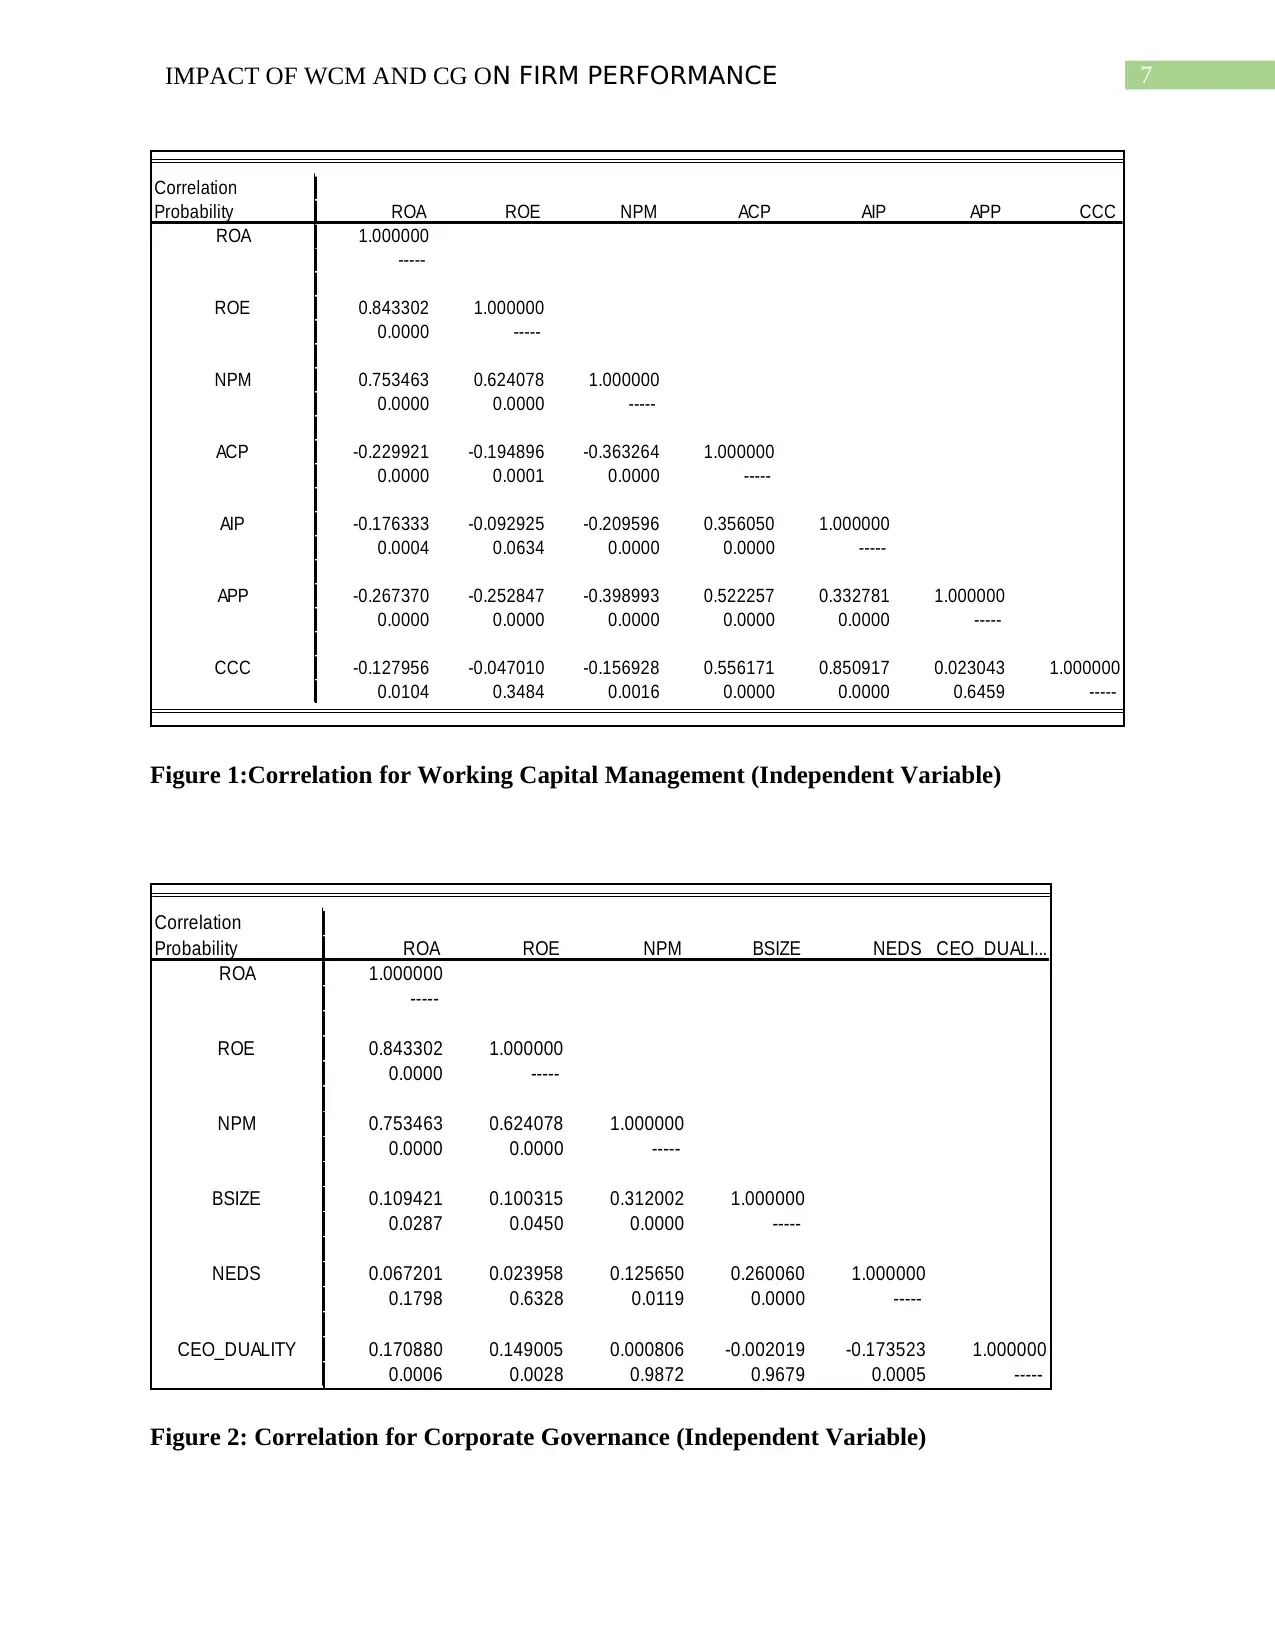
Correlation
Probability ROA ROE NPM ACP AIP APP CCC
ROA 1.000000
-----
ROE 0.843302 1.000000
0.0000 -----
NPM 0.753463 0.624078 1.000000
0.0000 0.0000 -----
ACP -0.229921 -0.194896 -0.363264 1.000000
0.0000 0.0001 0.0000 -----
AIP -0.176333 -0.092925 -0.209596 0.356050 1.000000
0.0004 0.0634 0.0000 0.0000 -----
APP -0.267370 -0.252847 -0.398993 0.522257 0.332781 1.000000
0.0000 0.0000 0.0000 0.0000 0.0000 -----
CCC -0.127956 -0.047010 -0.156928 0.556171 0.850917 0.023043 1.000000
0.0104 0.3484 0.0016 0.0000 0.0000 0.6459 -----
Figure 1:Correlation for Working Capital Management (Independent Variable)
Correlation
Probability ROA ROE NPM BSIZE NEDS CEO_DUALI...
ROA 1.000000
-----
ROE 0.843302 1.000000
0.0000 -----
NPM 0.753463 0.624078 1.000000
0.0000 0.0000 -----
BSIZE 0.109421 0.100315 0.312002 1.000000
0.0287 0.0450 0.0000 -----
NEDS 0.067201 0.023958 0.125650 0.260060 1.000000
0.1798 0.6328 0.0119 0.0000 -----
CEO_DUALITY 0.170880 0.149005 0.000806 -0.002019 -0.173523 1.000000
0.0006 0.0028 0.9872 0.9679 0.0005 -----
Figure 2: Correlation for Corporate Governance (Independent Variable)
Correlation
Probability ROA ROE NPM ACP AIP APP CCC
ROA 1.000000
-----
ROE 0.843302 1.000000
0.0000 -----
NPM 0.753463 0.624078 1.000000
0.0000 0.0000 -----
ACP -0.229921 -0.194896 -0.363264 1.000000
0.0000 0.0001 0.0000 -----
AIP -0.176333 -0.092925 -0.209596 0.356050 1.000000
0.0004 0.0634 0.0000 0.0000 -----
APP -0.267370 -0.252847 -0.398993 0.522257 0.332781 1.000000
0.0000 0.0000 0.0000 0.0000 0.0000 -----
CCC -0.127956 -0.047010 -0.156928 0.556171 0.850917 0.023043 1.000000
0.0104 0.3484 0.0016 0.0000 0.0000 0.6459 -----
Figure 1:Correlation for Working Capital Management (Independent Variable)
Correlation
Probability ROA ROE NPM BSIZE NEDS CEO_DUALI...
ROA 1.000000
-----
ROE 0.843302 1.000000
0.0000 -----
NPM 0.753463 0.624078 1.000000
0.0000 0.0000 -----
BSIZE 0.109421 0.100315 0.312002 1.000000
0.0287 0.0450 0.0000 -----
NEDS 0.067201 0.023958 0.125650 0.260060 1.000000
0.1798 0.6328 0.0119 0.0000 -----
CEO_DUALITY 0.170880 0.149005 0.000806 -0.002019 -0.173523 1.000000
0.0006 0.0028 0.9872 0.9679 0.0005 -----
Figure 2: Correlation for Corporate Governance (Independent Variable)
8IMPACT OF WCM AND CG ON FIRM PERFORMANCE
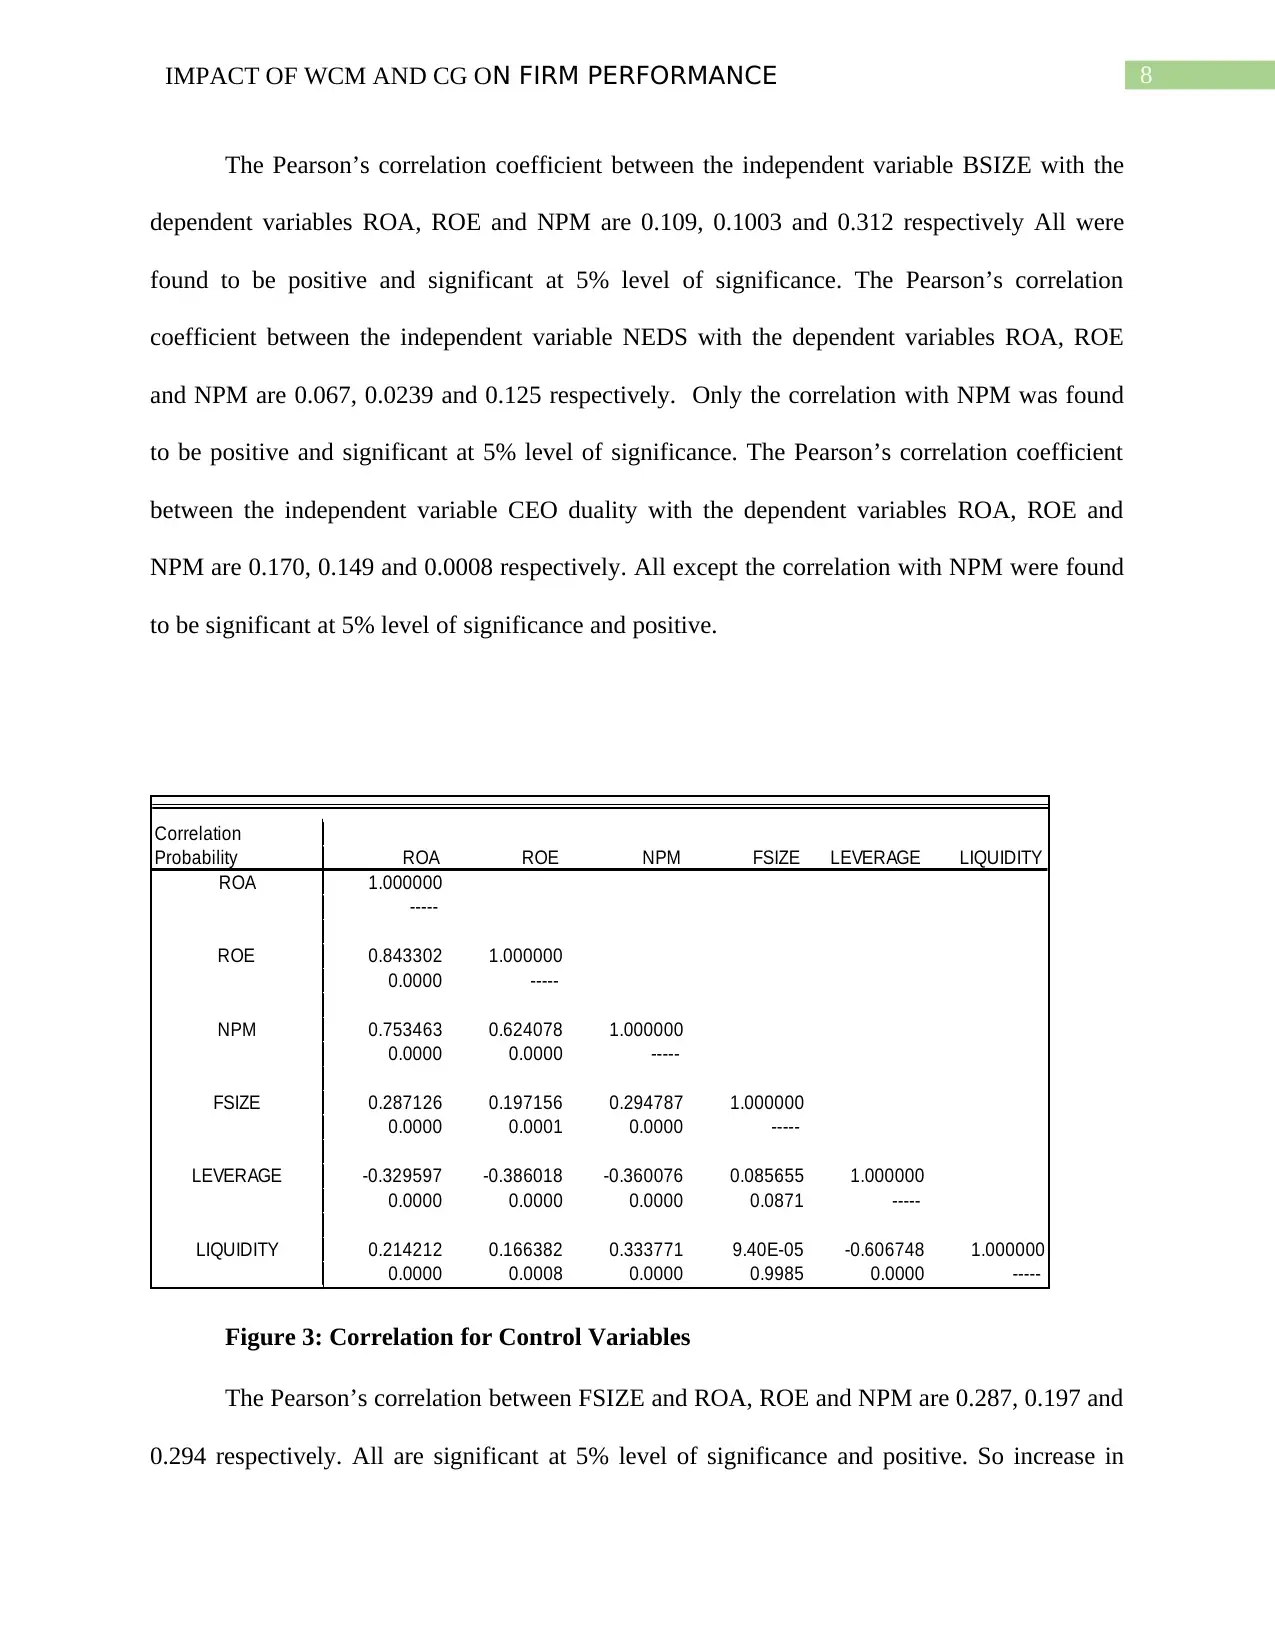
The Pearson’s correlation coefficient between the independent variable BSIZE with the
dependent variables ROA, ROE and NPM are 0.109, 0.1003 and 0.312 respectively All were
found to be positive and significant at 5% level of significance. The Pearson’s correlation
coefficient between the independent variable NEDS with the dependent variables ROA, ROE
and NPM are 0.067, 0.0239 and 0.125 respectively. Only the correlation with NPM was found
to be positive and significant at 5% level of significance. The Pearson’s correlation coefficient
between the independent variable CEO duality with the dependent variables ROA, ROE and
NPM are 0.170, 0.149 and 0.0008 respectively. All except the correlation with NPM were found
to be significant at 5% level of significance and positive.
Correlation
Probability ROA ROE NPM FSIZE LEVERAGE LIQUIDITY
ROA 1.000000
-----
ROE 0.843302 1.000000
0.0000 -----
NPM 0.753463 0.624078 1.000000
0.0000 0.0000 -----
FSIZE 0.287126 0.197156 0.294787 1.000000
0.0000 0.0001 0.0000 -----
LEVERAGE -0.329597 -0.386018 -0.360076 0.085655 1.000000
0.0000 0.0000 0.0000 0.0871 -----
LIQUIDITY 0.214212 0.166382 0.333771 9.40E-05 -0.606748 1.000000
0.0000 0.0008 0.0000 0.9985 0.0000 -----
Figure 3: Correlation for Control Variables
The Pearson’s correlation between FSIZE and ROA, ROE and NPM are 0.287, 0.197 and
0.294 respectively. All are significant at 5% level of significance and positive. So increase in
⊘ This is a preview!⊘
Do you want full access?
Subscribe today to unlock all pages.
Trusted by 1+ million students worldwide
9IMPACT OF WCM AND CG ON FIRM PERFORMANCE
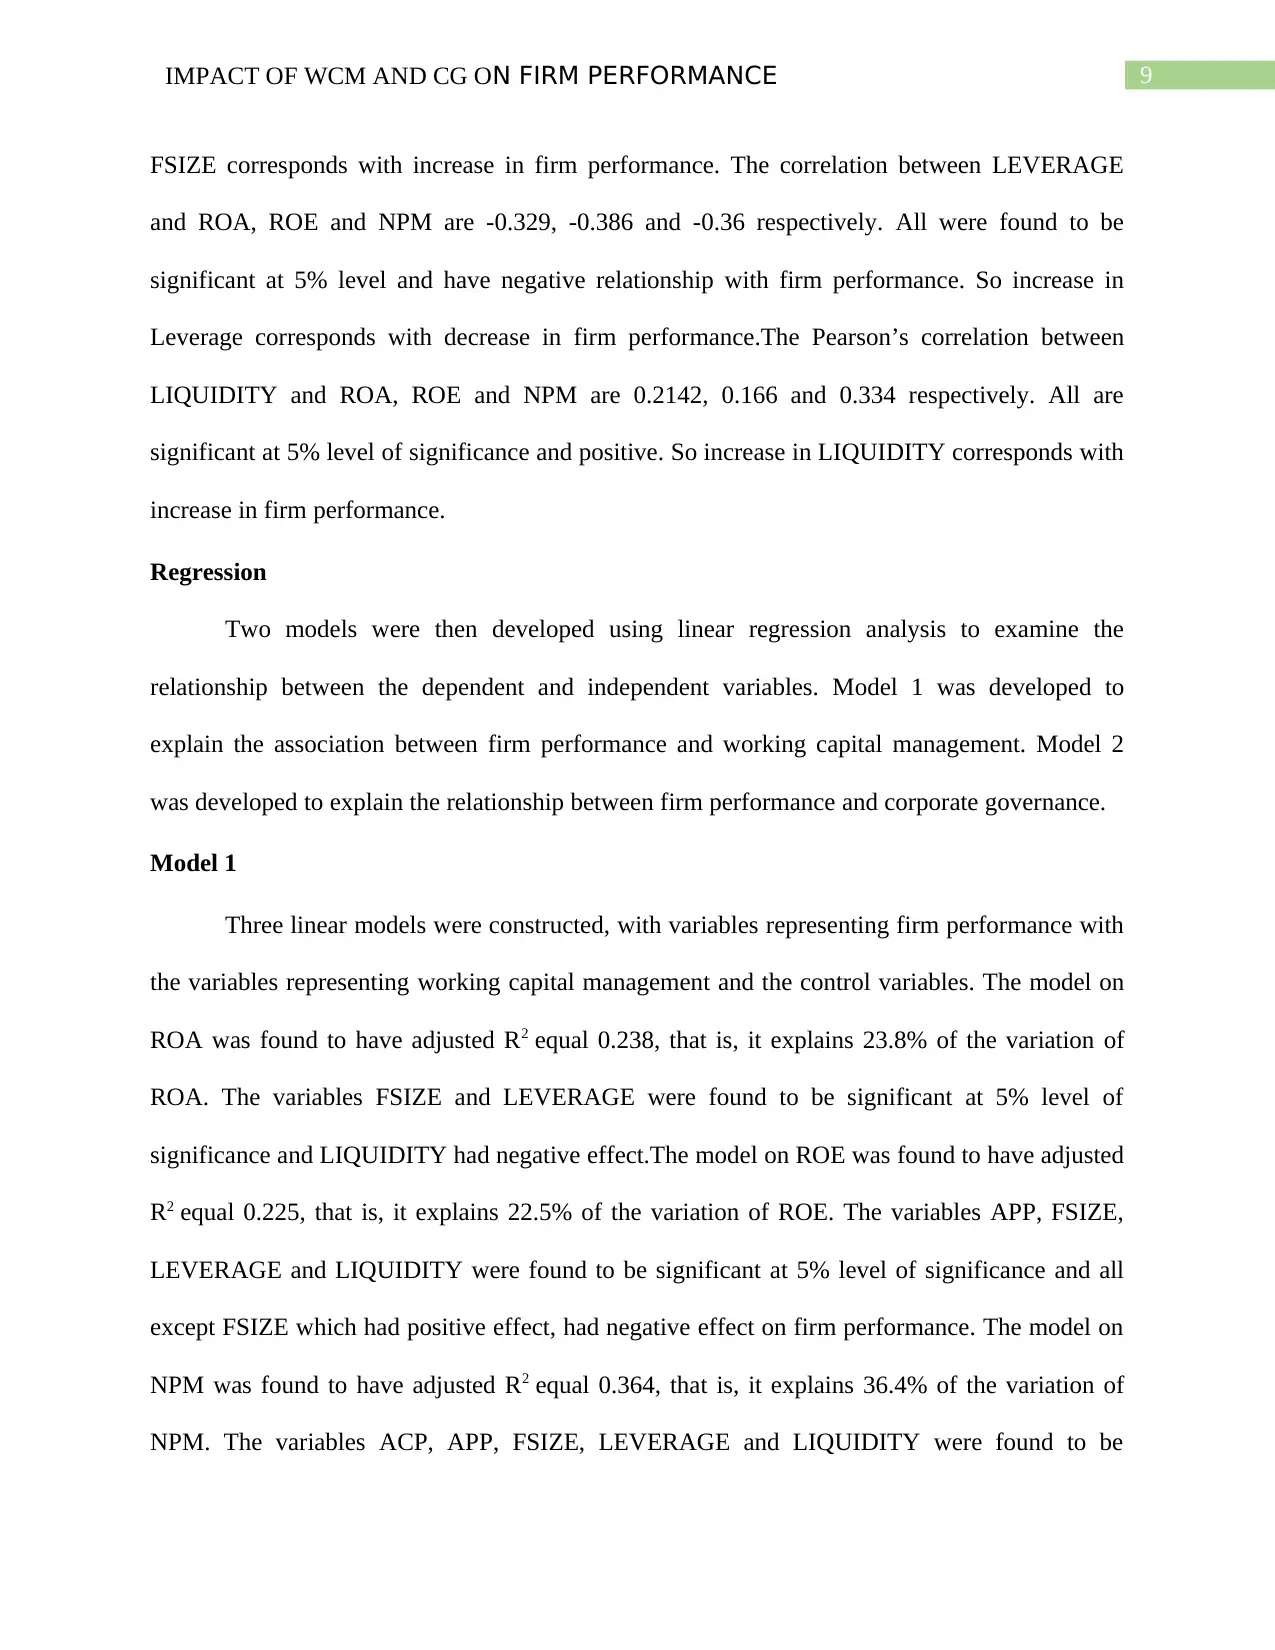
FSIZE corresponds with increase in firm performance. The correlation between LEVERAGE
and ROA, ROE and NPM are -0.329, -0.386 and -0.36 respectively. All were found to be
significant at 5% level and have negative relationship with firm performance. So increase in
Leverage corresponds with decrease in firm performance.The Pearson’s correlation between
LIQUIDITY and ROA, ROE and NPM are 0.2142, 0.166 and 0.334 respectively. All are
significant at 5% level of significance and positive. So increase in LIQUIDITY corresponds with
increase in firm performance.
Regression
Two models were then developed using linear regression analysis to examine the
relationship between the dependent and independent variables. Model 1 was developed to
explain the association between firm performance and working capital management. Model 2
was developed to explain the relationship between firm performance and corporate governance.
Model 1
Three linear models were constructed, with variables representing firm performance with
the variables representing working capital management and the control variables. The model on
ROA was found to have adjusted R2 equal 0.238, that is, it explains 23.8% of the variation of
ROA. The variables FSIZE and LEVERAGE were found to be significant at 5% level of
significance and LIQUIDITY had negative effect.The model on ROE was found to have adjusted
R2 equal 0.225, that is, it explains 22.5% of the variation of ROE. The variables APP, FSIZE,
LEVERAGE and LIQUIDITY were found to be significant at 5% level of significance and all
except FSIZE which had positive effect, had negative effect on firm performance. The model on
NPM was found to have adjusted R2 equal 0.364, that is, it explains 36.4% of the variation of
NPM. The variables ACP, APP, FSIZE, LEVERAGE and LIQUIDITY were found to be
Paraphrase This Document
Need a fresh take? Get an instant paraphrase of this document with our AI Paraphraser
10IMPACT OF WCM AND CG ON FIRM PERFORMANCE
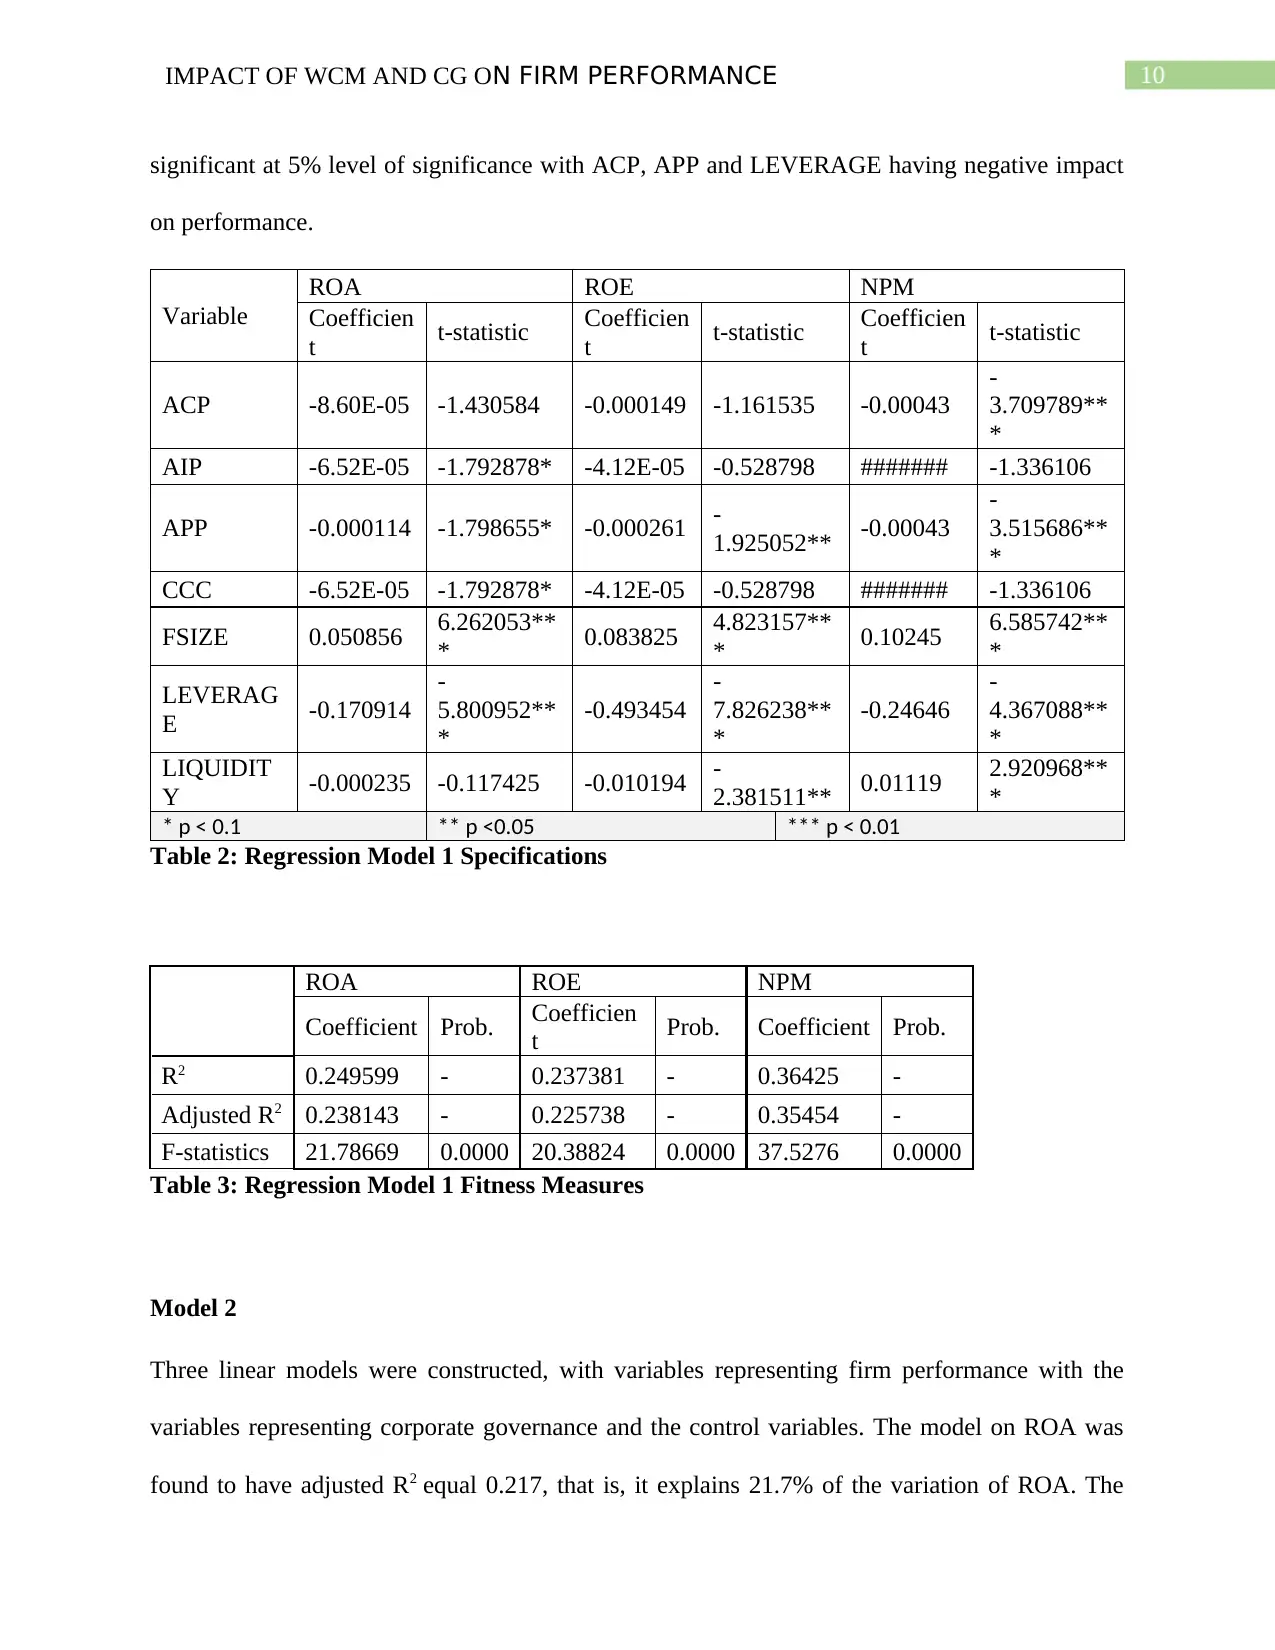
significant at 5% level of significance with ACP, APP and LEVERAGE having negative impact
on performance.
Variable
ROA ROE NPM
Coefficien
t t-statistic Coefficien
t t-statistic Coefficien
t t-statistic
ACP -8.60E-05 -1.430584 -0.000149 -1.161535 -0.00043
-
3.709789**
*
AIP -6.52E-05 -1.792878* -4.12E-05 -0.528798 ####### -1.336106
APP -0.000114 -1.798655* -0.000261 -
1.925052** -0.00043
-
3.515686**
*
CCC -6.52E-05 -1.792878* -4.12E-05 -0.528798 ####### -1.336106
FSIZE 0.050856 6.262053**
* 0.083825 4.823157**
* 0.10245 6.585742**
*
LEVERAG
E -0.170914
-
5.800952**
*
-0.493454
-
7.826238**
*
-0.24646
-
4.367088**
*
LIQUIDIT
Y -0.000235 -0.117425 -0.010194 -
2.381511** 0.01119 2.920968**
*
* p < 0.1 ** p <0.05 *** p < 0.01
Table 2: Regression Model 1 Specifications
ROA ROE NPM
Coefficient Prob. Coefficien
t Prob. Coefficient Prob.
R2 0.249599 - 0.237381 - 0.36425 -
Adjusted R2 0.238143 - 0.225738 - 0.35454 -
F-statistics 21.78669 0.0000 20.38824 0.0000 37.5276 0.0000
Table 3: Regression Model 1 Fitness Measures
Model 2
Three linear models were constructed, with variables representing firm performance with the
variables representing corporate governance and the control variables. The model on ROA was
found to have adjusted R2 equal 0.217, that is, it explains 21.7% of the variation of ROA. The
11IMPACT OF WCM AND CG ON FIRM PERFORMANCE
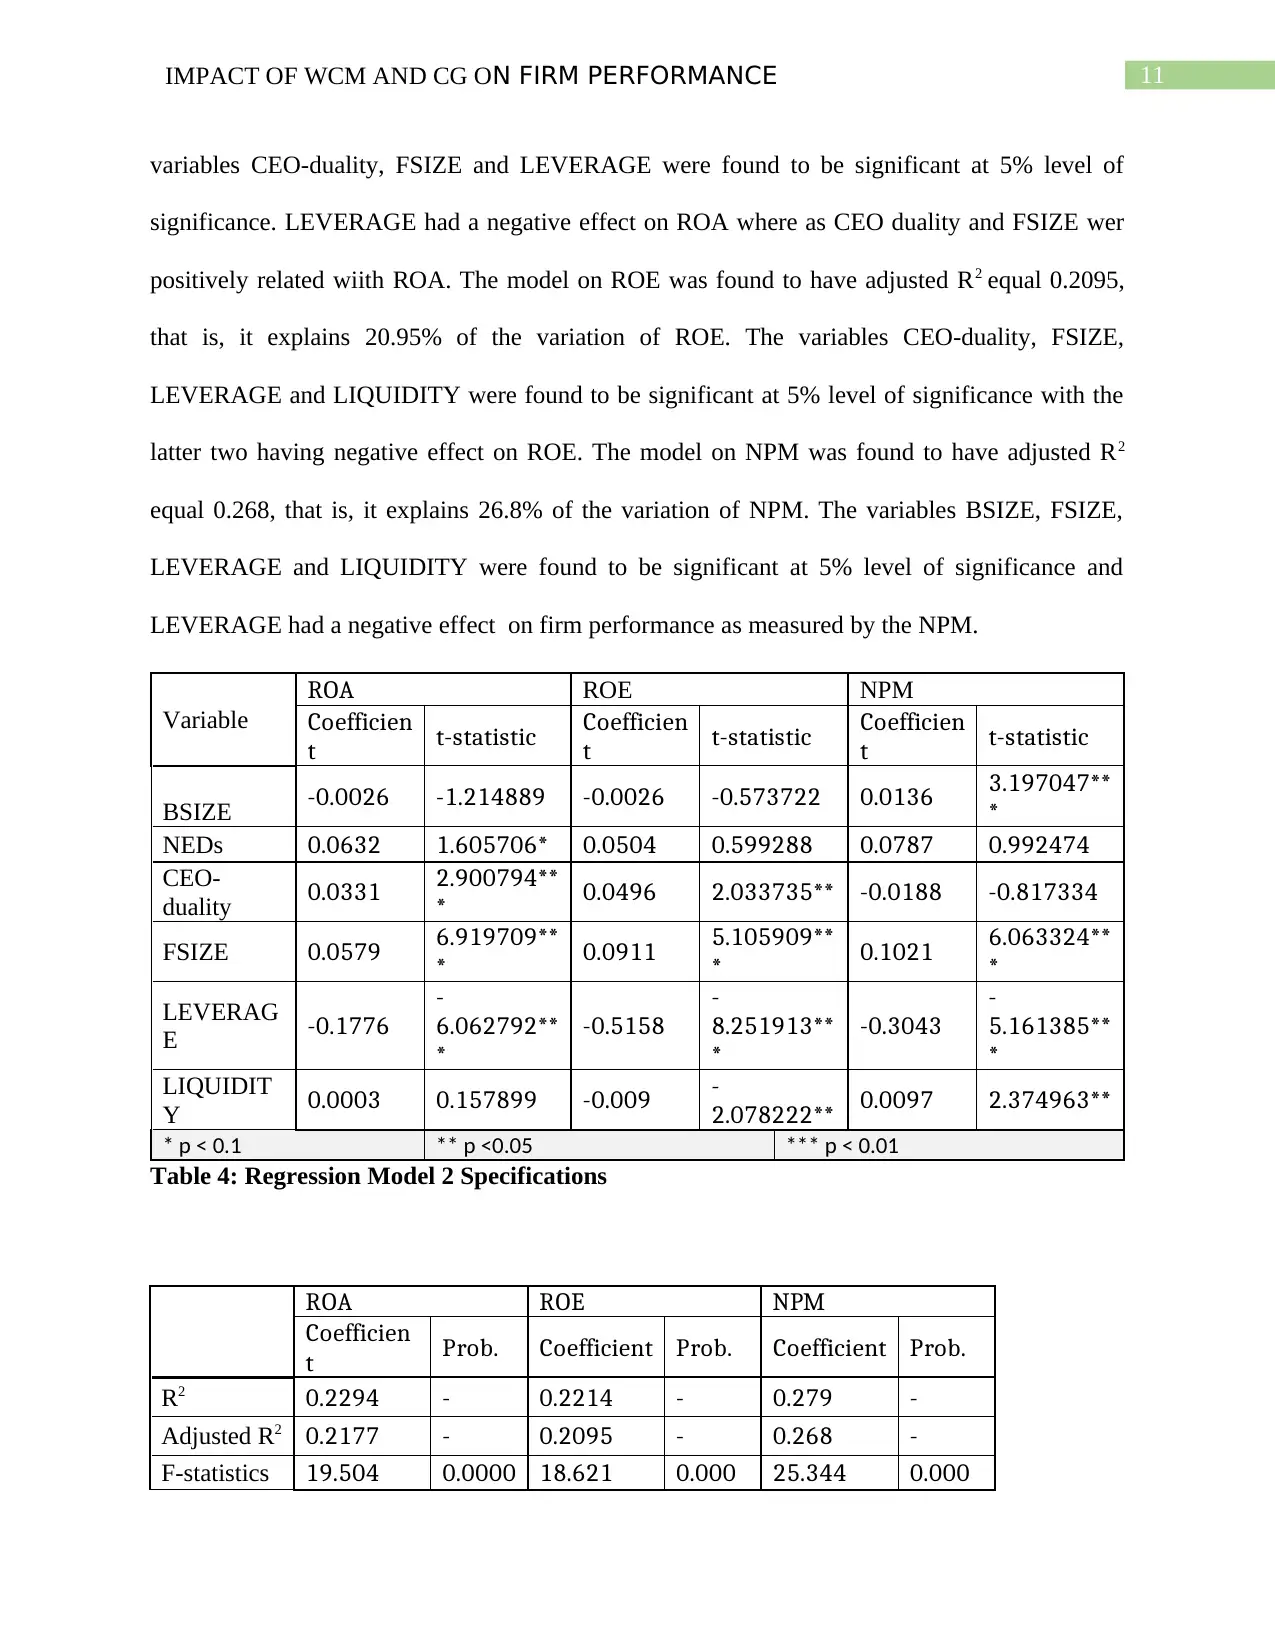
variables CEO-duality, FSIZE and LEVERAGE were found to be significant at 5% level of
significance. LEVERAGE had a negative effect on ROA where as CEO duality and FSIZE wer
positively related wiith ROA. The model on ROE was found to have adjusted R2 equal 0.2095,
that is, it explains 20.95% of the variation of ROE. The variables CEO-duality, FSIZE,
LEVERAGE and LIQUIDITY were found to be significant at 5% level of significance with the
latter two having negative effect on ROE. The model on NPM was found to have adjusted R2
equal 0.268, that is, it explains 26.8% of the variation of NPM. The variables BSIZE, FSIZE,
LEVERAGE and LIQUIDITY were found to be significant at 5% level of significance and
LEVERAGE had a negative effect on firm performance as measured by the NPM.
Variable
ROA ROE NPM
Coefficien
t t-statistic Coefficien
t t-statistic Coefficien
t t-statistic
BSIZE -0.0026 -1.214889 -0.0026 -0.573722 0.0136 3.197047**
*
NEDs 0.0632 1.605706* 0.0504 0.599288 0.0787 0.992474
CEO-
duality 0.0331 2.900794**
* 0.0496 2.033735** -0.0188 -0.817334
FSIZE 0.0579 6.919709**
* 0.0911 5.105909**
* 0.1021 6.063324**
*
LEVERAG
E -0.1776
-
6.062792**
*
-0.5158
-
8.251913**
*
-0.3043
-
5.161385**
*
LIQUIDIT
Y 0.0003 0.157899 -0.009 -
2.078222** 0.0097 2.374963**
* p < 0.1 ** p <0.05 *** p < 0.01
Table 4: Regression Model 2 Specifications
ROA ROE NPM
Coefficien
t Prob. Coefficient Prob. Coefficient Prob.
R2 0.2294 - 0.2214 - 0.279 -
Adjusted R2 0.2177 - 0.2095 - 0.268 -
F-statistics 19.504 0.0000 18.621 0.000 25.344 0.000
⊘ This is a preview!⊘
Do you want full access?
Subscribe today to unlock all pages.
Trusted by 1+ million students worldwide
1 out of 24
Related Documents


Your All-in-One AI-Powered Toolkit for Academic Success.
+13062052269
info@desklib.com
Available 24*7 on WhatsApp / Email
![[object Object]](/_next/static/media/star-bottom.7253800d.svg)
Unlock your academic potential
Copyright © 2020–2026 A2Z Services. All Rights Reserved. Developed and managed by ZUCOL.