Strategic Analysis of WE Mobile: Market Position and Future Growth
VerifiedAdded on 2023/06/10
|16
|2497
|383
Report
AI Summary
This report provides a comprehensive strategic analysis of WE Mobile, a global mobile phone company. It begins with an introduction to the company's current market position, highlighting its strengths in sales and promotion but weaknesses in R&D investment. The external analysis includes a PESTEL analysis, focusing on political and economic factors affecting the industry, and Porter's Five Forces, assessing competitive pressures. The report also examines the mobile phone market, industry lifecycle, and competition, including market share data. An internal VRIO analysis assesses the company's resources and capabilities, followed by a SWOT analysis identifying strengths, weaknesses, opportunities, and threats. The critical analysis focuses on WE Mobile's capabilities and resources, particularly its high promotional spending versus low R&D investment. The report concludes with a proposed strategy for WE Mobile to pursue a global standardization approach based on Tech 3 and Tech 4, emphasizing value pricing, strategic technology investments, and efficient manufacturing planning.

Running head: STRATEGY
Strategy
Name of the Student:
Name of the University:
Authors Note:
Strategy
Name of the Student:
Name of the University:
Authors Note:
Paraphrase This Document
Need a fresh take? Get an instant paraphrase of this document with our AI Paraphraser
1STRATEGY
Table of Contents
Strategy for WE mobile.............................................................................................................2
Introduction:...............................................................................................................................2
External Analysis:......................................................................................................................3
VRIO Analysis...........................................................................................................................7
SWOT Analysis:........................................................................................................................8
Critical Analysis- WE Mobile:...................................................................................................9
Proposed Strategy.....................................................................................................................10
Reference..................................................................................................................................12
Appendices...............................................................................................................................13
2STRATEGY
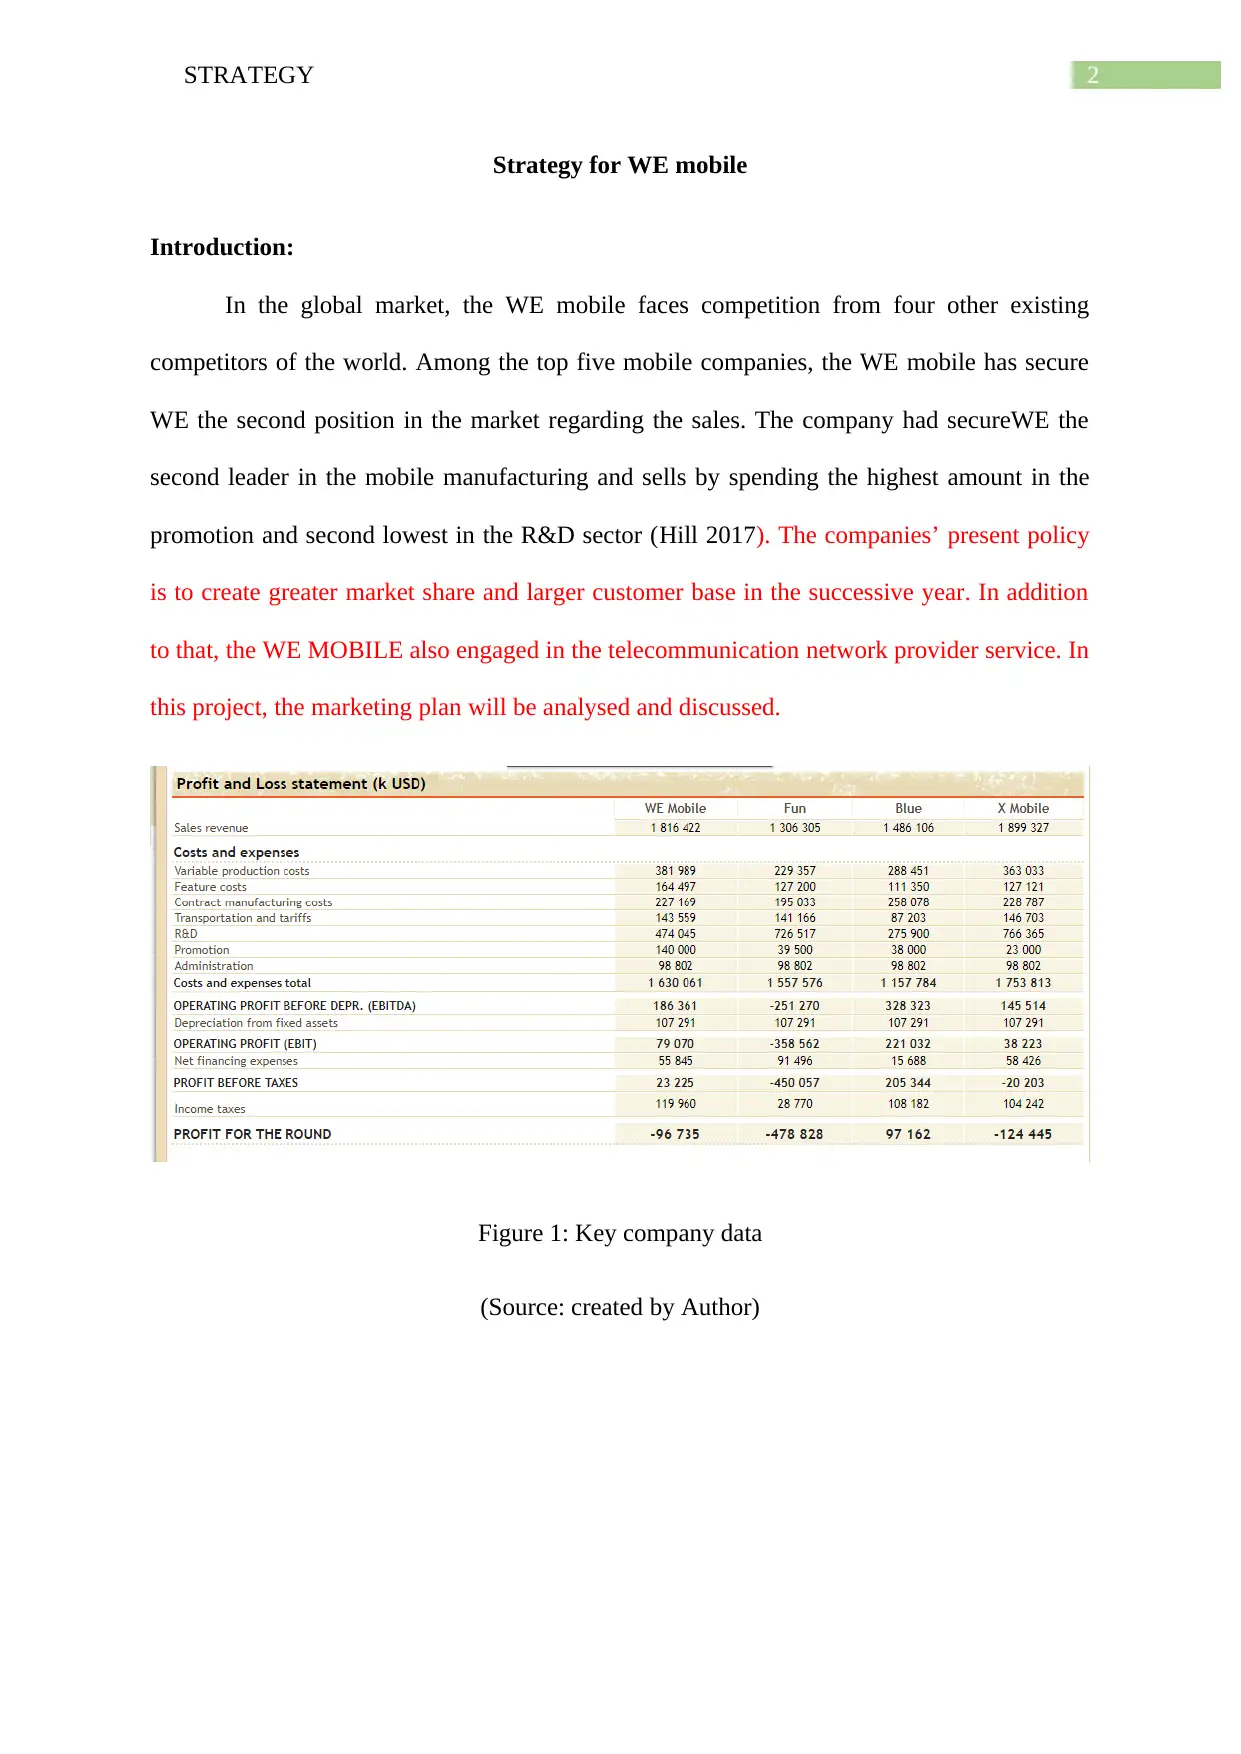
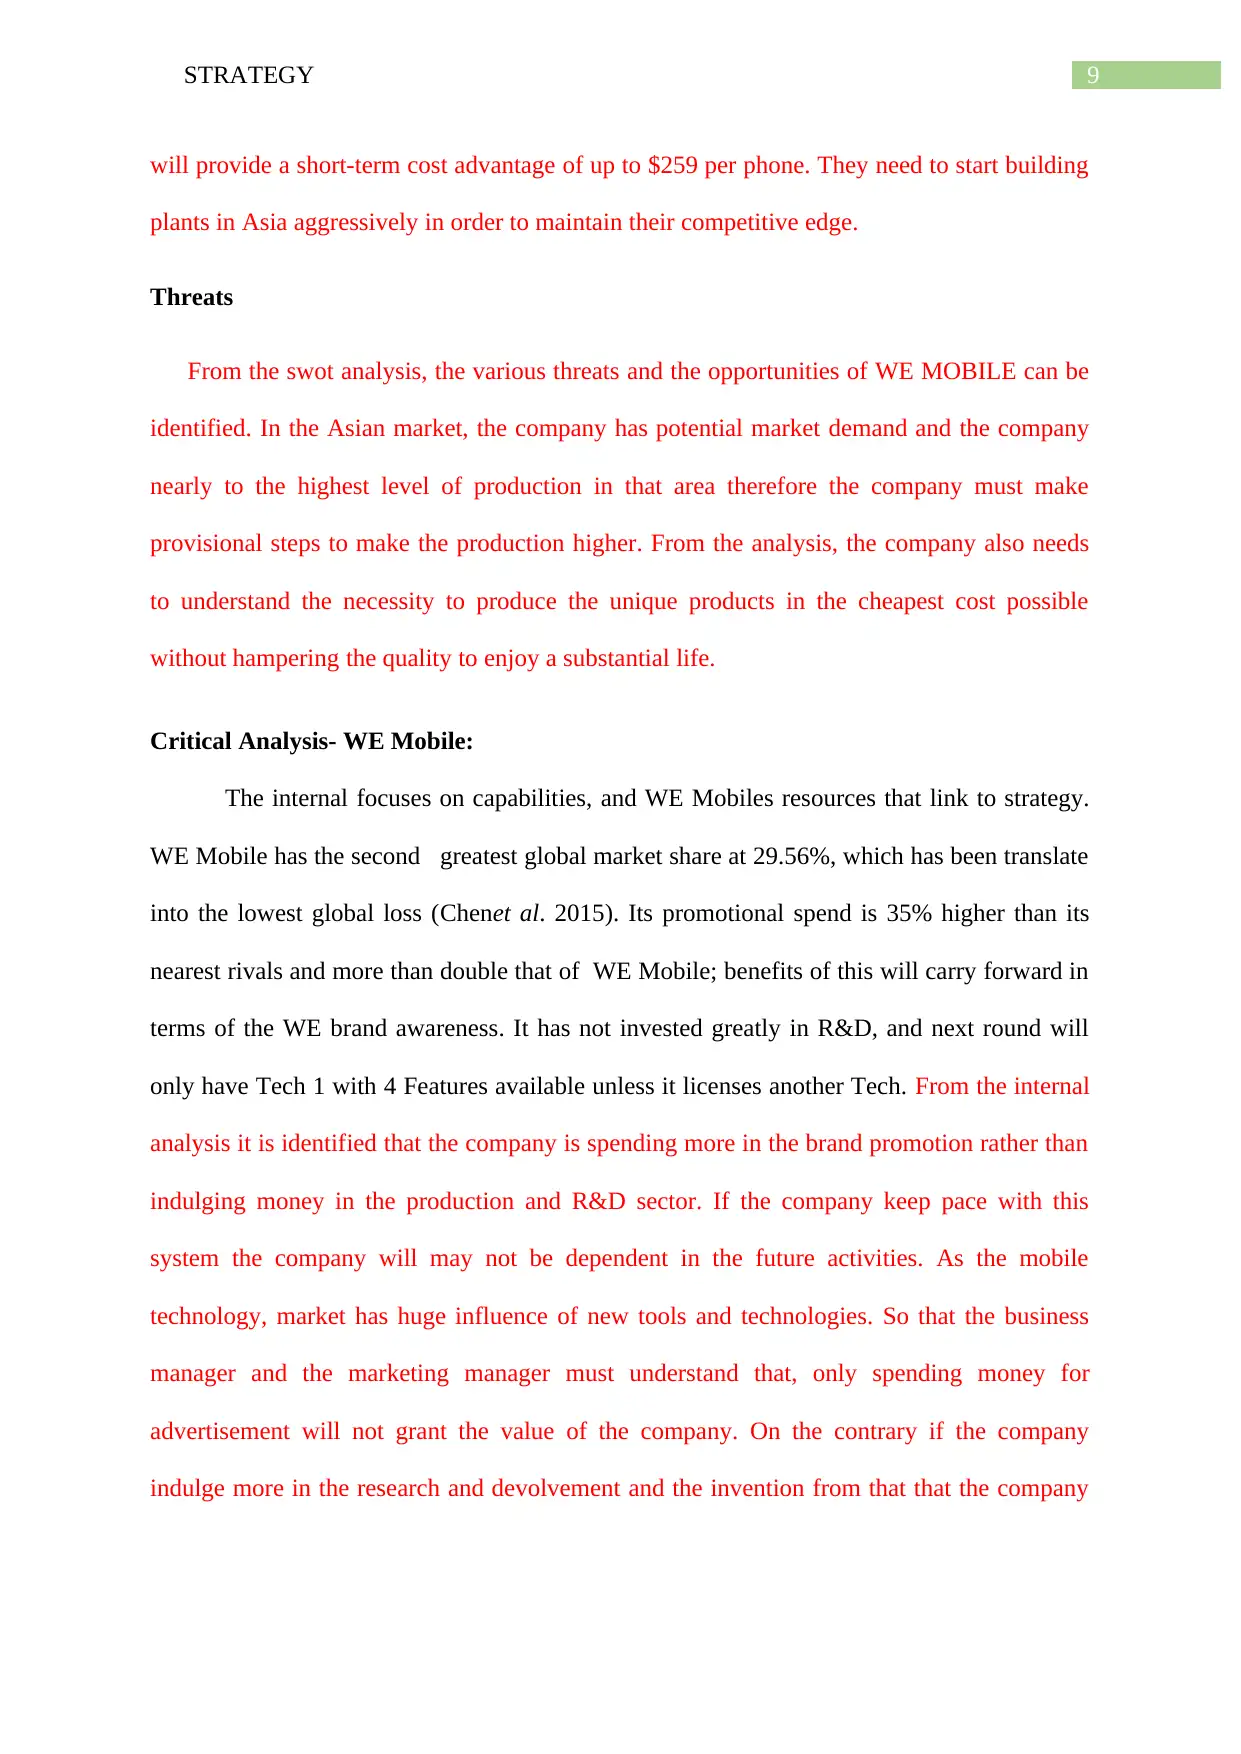
Strategy for WE mobile
Introduction:
In the global market, the WE mobile faces competition from four other existing
competitors of the world. Among the top five mobile companies, the WE mobile has secure
WE the second position in the market regarding the sales. The company had secureWE the
second leader in the mobile manufacturing and sells by spending the highest amount in the
promotion and second lowest in the R&D sector (Hill 2017). The companies’ present policy
is to create greater market share and larger customer base in the successive year. In addition
to that, the WE MOBILE also engaged in the telecommunication network provider service. In
this project, the marketing plan will be analysed and discussed.
Figure 1: Key company data
(Source: created by Author)
⊘ This is a preview!⊘
Do you want full access?
Subscribe today to unlock all pages.
Trusted by 1+ million students worldwide
3STRATEGY
External Analysis:
PESTEL Analysis:
In the current scenario, thePolitical tensions between two government of USA and
China have resulted in the increase in tariffs for American goods that are exported to the
Asian continent. This has resulted the price to almost double from $7 per handset last year to
$12 in the current year. There are no notable changes in production costs.Further, in Asia the
growth is projected to 25-30%.
Moreover,a common tax agreement has been made in the European Union that has
unified the corporate tax rates at 31% throughout Europe. It is believed by different
Economists believe that Europe is tend to loss its global market place in by further increasing
its high tax level. It will resulted the fall in the euro (Hillet al. 2014).
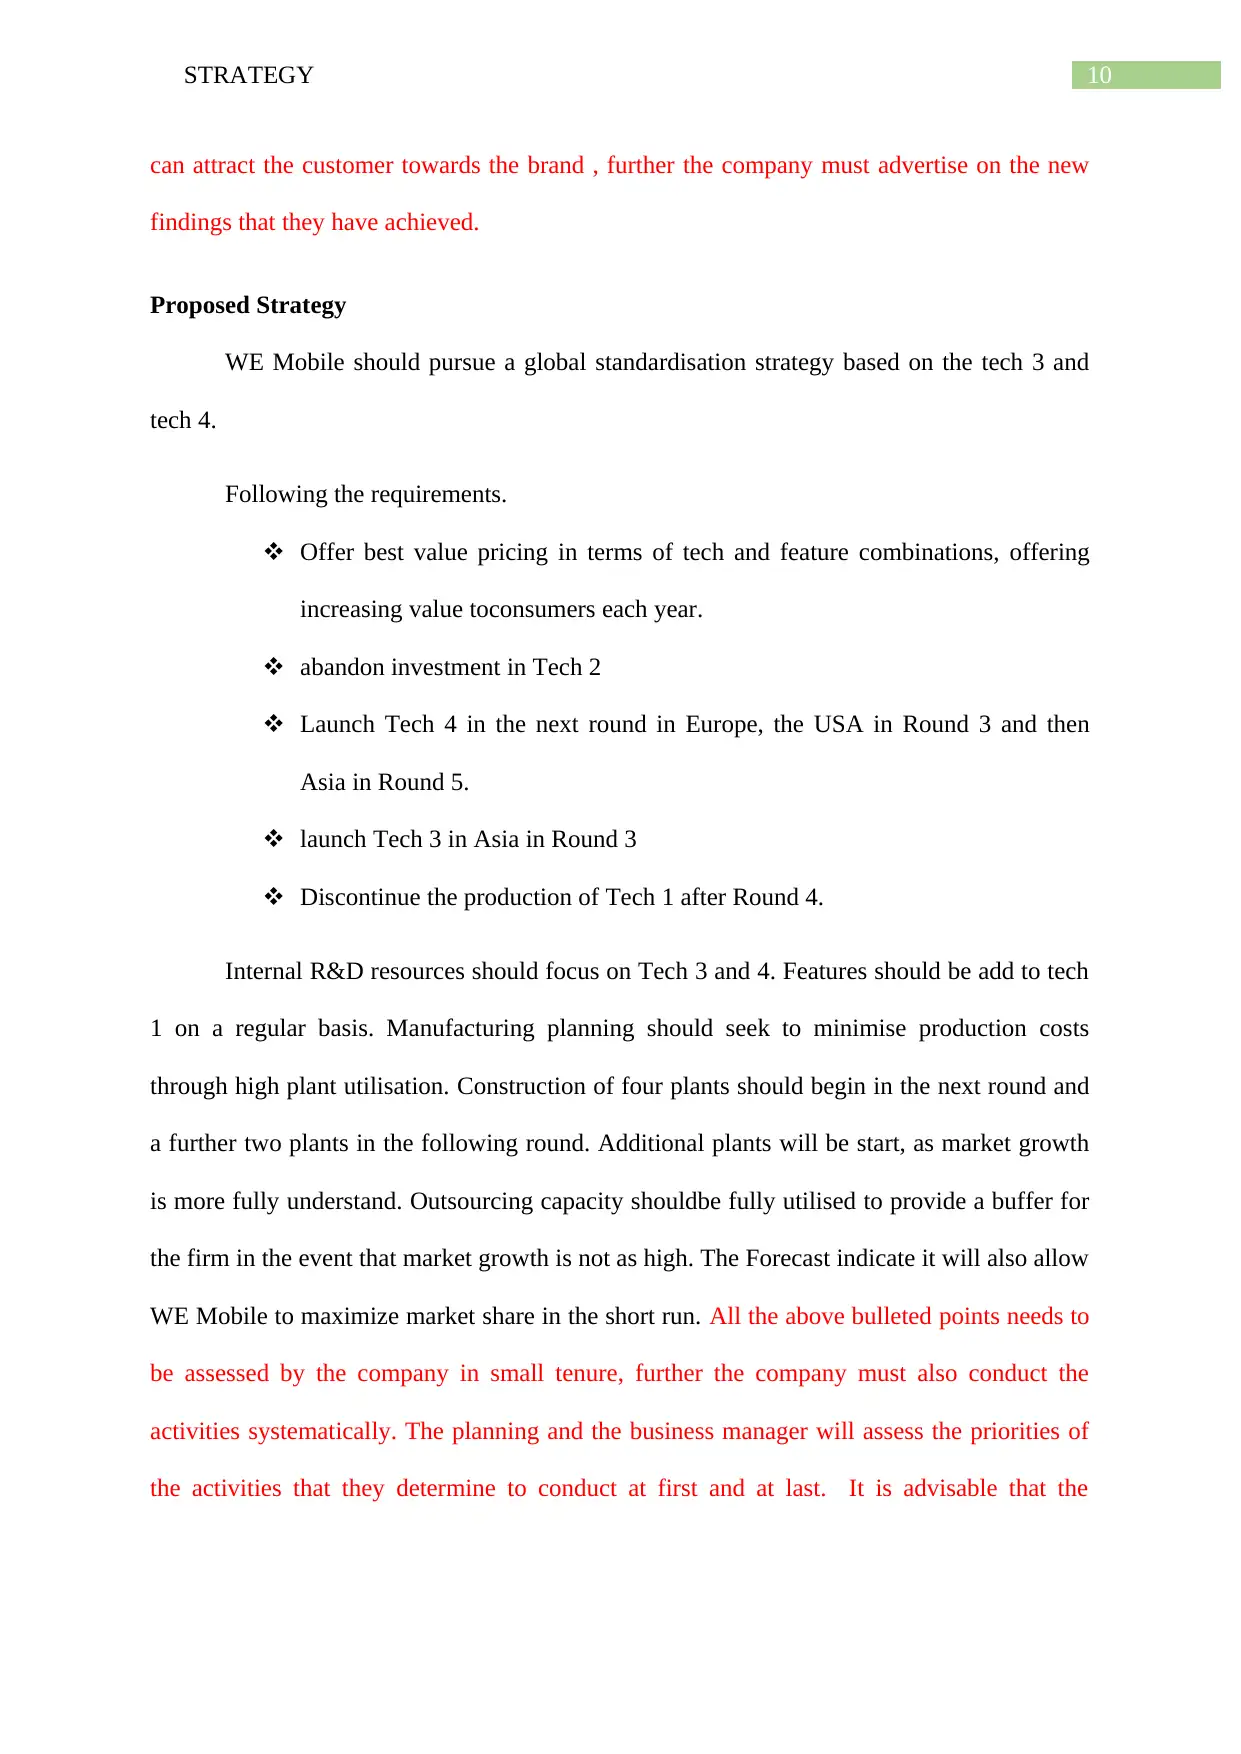
Five Force Analysis:
The Porter’s five forces model provides an analysis of the competitive pressure. That
helps in determining the profitability of an industry.The range of company profitability is
from -$1.5m to $1.9m, however this range is a result of managerial Decisions rather than
industry forces.The objective of this analysis are to determine the competition that may
increase and the effect it has on the profitability of the company (Chenget al. 2014).
Moreover, there are high possibilities that the attractive one to enter in the market and that
from the outsourcing manufacturers there is high threat of additional competition:
Level of competitive rivalry is moderate but may increase as the industry matures:
demand is growing sustainably making this an attractive industry
o industry capacity exceeds demand (acting as a source of increased competition
and a
External Analysis:
PESTEL Analysis:
In the current scenario, thePolitical tensions between two government of USA and
China have resulted in the increase in tariffs for American goods that are exported to the
Asian continent. This has resulted the price to almost double from $7 per handset last year to
$12 in the current year. There are no notable changes in production costs.Further, in Asia the
growth is projected to 25-30%.
Moreover,a common tax agreement has been made in the European Union that has
unified the corporate tax rates at 31% throughout Europe. It is believed by different
Economists believe that Europe is tend to loss its global market place in by further increasing
its high tax level. It will resulted the fall in the euro (Hillet al. 2014).
Five Force Analysis:
The Porter’s five forces model provides an analysis of the competitive pressure. That
helps in determining the profitability of an industry.The range of company profitability is
from -$1.5m to $1.9m, however this range is a result of managerial Decisions rather than
industry forces.The objective of this analysis are to determine the competition that may
increase and the effect it has on the profitability of the company (Chenget al. 2014).
Moreover, there are high possibilities that the attractive one to enter in the market and that
from the outsourcing manufacturers there is high threat of additional competition:
Level of competitive rivalry is moderate but may increase as the industry matures:
demand is growing sustainably making this an attractive industry
o industry capacity exceeds demand (acting as a source of increased competition
and a
Paraphrase This Document
Need a fresh take? Get an instant paraphrase of this document with our AI Paraphraser
4STRATEGY
o deterrence to new entrants)
o plant capacity in the US faces high tariff and logistic costs when exporting to
Asia, increasingthe pressure to add global capacity in Asia
Threat of entry particularly from the outsourced manufacturers is high and moderate
from other. Therefor the cost of outsourcing has increased by 9%.
firms
threat of substation is low
There is insufficient data to draw clear conclusions regarding buyer and supplier
power.
Figure 2: Porters Five Force Model
(Source: Created by Author)
5STRATEGY
With the help of the above Five points model and the PESTEL analysis of the
company the business and the marketing manager can utilises the sources of deficiency and
work collaborate to work on the emerging issues of the company. Further from the above
analysis, the planning and marketing managers have identified the probable market threats in
the European Continental due to the increase in the Corporate Tax rate to 31%. Therefore, the
market of that region will be demolish for this emerging company.
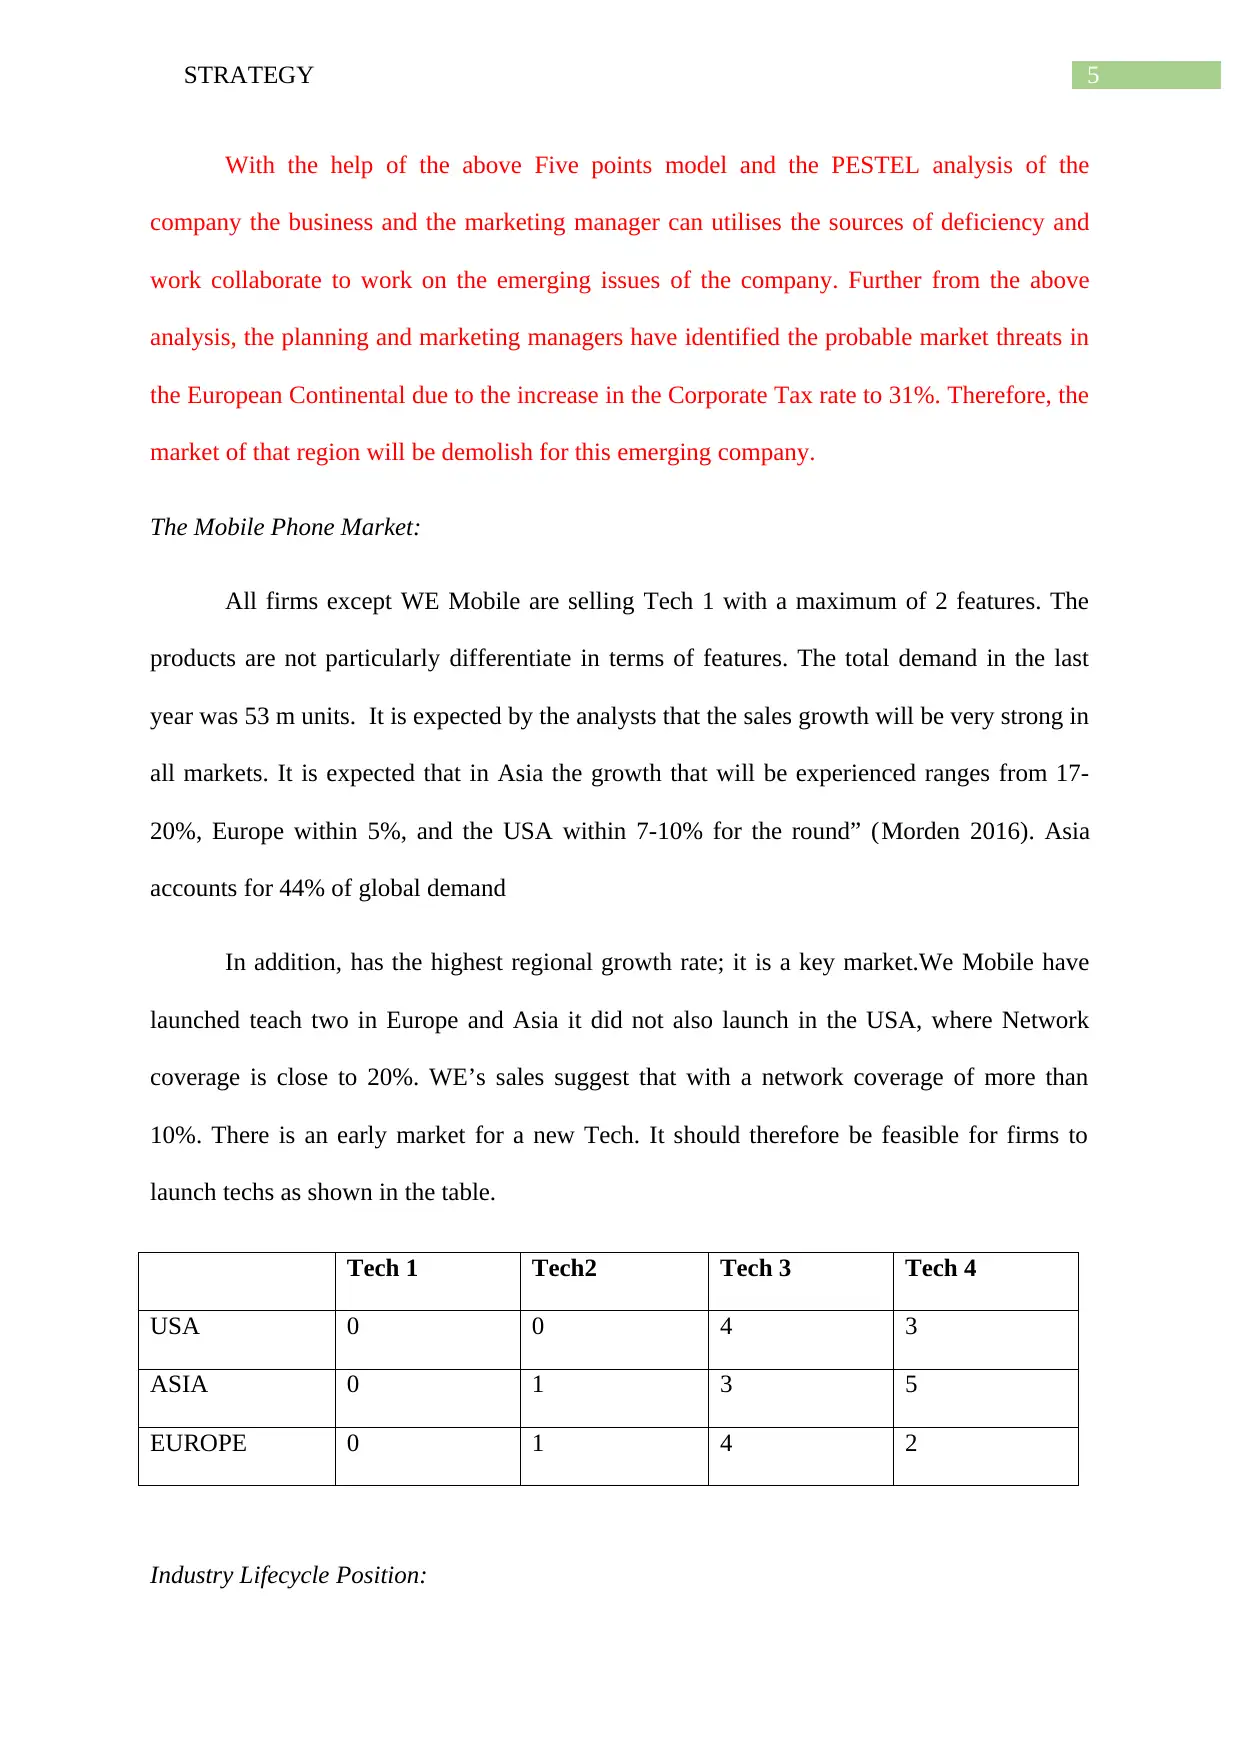
The Mobile Phone Market:
All firms except WE Mobile are selling Tech 1 with a maximum of 2 features. The
products are not particularly differentiate in terms of features. The total demand in the last
year was 53 m units. It is expected by the analysts that the sales growth will be very strong in
all markets. It is expected that in Asia the growth that will be experienced ranges from 17-
20%, Europe within 5%, and the USA within 7-10% for the round” (Morden 2016). Asia
accounts for 44% of global demand
In addition, has the highest regional growth rate; it is a key market.We Mobile have
launched teach two in Europe and Asia it did not also launch in the USA, where Network
coverage is close to 20%. WE’s sales suggest that with a network coverage of more than
10%. There is an early market for a new Tech. It should therefore be feasible for firms to
launch techs as shown in the table.
Tech 1 Tech2 Tech 3 Tech 4
USA 0 0 4 3
ASIA 0 1 3 5
EUROPE 0 1 4 2
Industry Lifecycle Position:
With the help of the above Five points model and the PESTEL analysis of the
company the business and the marketing manager can utilises the sources of deficiency and
work collaborate to work on the emerging issues of the company. Further from the above
analysis, the planning and marketing managers have identified the probable market threats in
the European Continental due to the increase in the Corporate Tax rate to 31%. Therefore, the
market of that region will be demolish for this emerging company.
The Mobile Phone Market:
All firms except WE Mobile are selling Tech 1 with a maximum of 2 features. The
products are not particularly differentiate in terms of features. The total demand in the last
year was 53 m units. It is expected by the analysts that the sales growth will be very strong in
all markets. It is expected that in Asia the growth that will be experienced ranges from 17-
20%, Europe within 5%, and the USA within 7-10% for the round” (Morden 2016). Asia
accounts for 44% of global demand
In addition, has the highest regional growth rate; it is a key market.We Mobile have
launched teach two in Europe and Asia it did not also launch in the USA, where Network
coverage is close to 20%. WE’s sales suggest that with a network coverage of more than
10%. There is an early market for a new Tech. It should therefore be feasible for firms to
launch techs as shown in the table.
Tech 1 Tech2 Tech 3 Tech 4
USA 0 0 4 3
ASIA 0 1 3 5
EUROPE 0 1 4 2
Industry Lifecycle Position:
⊘ This is a preview!⊘
Do you want full access?
Subscribe today to unlock all pages.
Trusted by 1+ million students worldwide
6STRATEGY
The Current rates of growth suggest the industry is in the growth period as with no
indication as to the likely time to maturity. Firm pricing and Promotion, as well as the cost of
network services, the key complement, will influence industry demand (Trigeorgis and Reuer
2017).
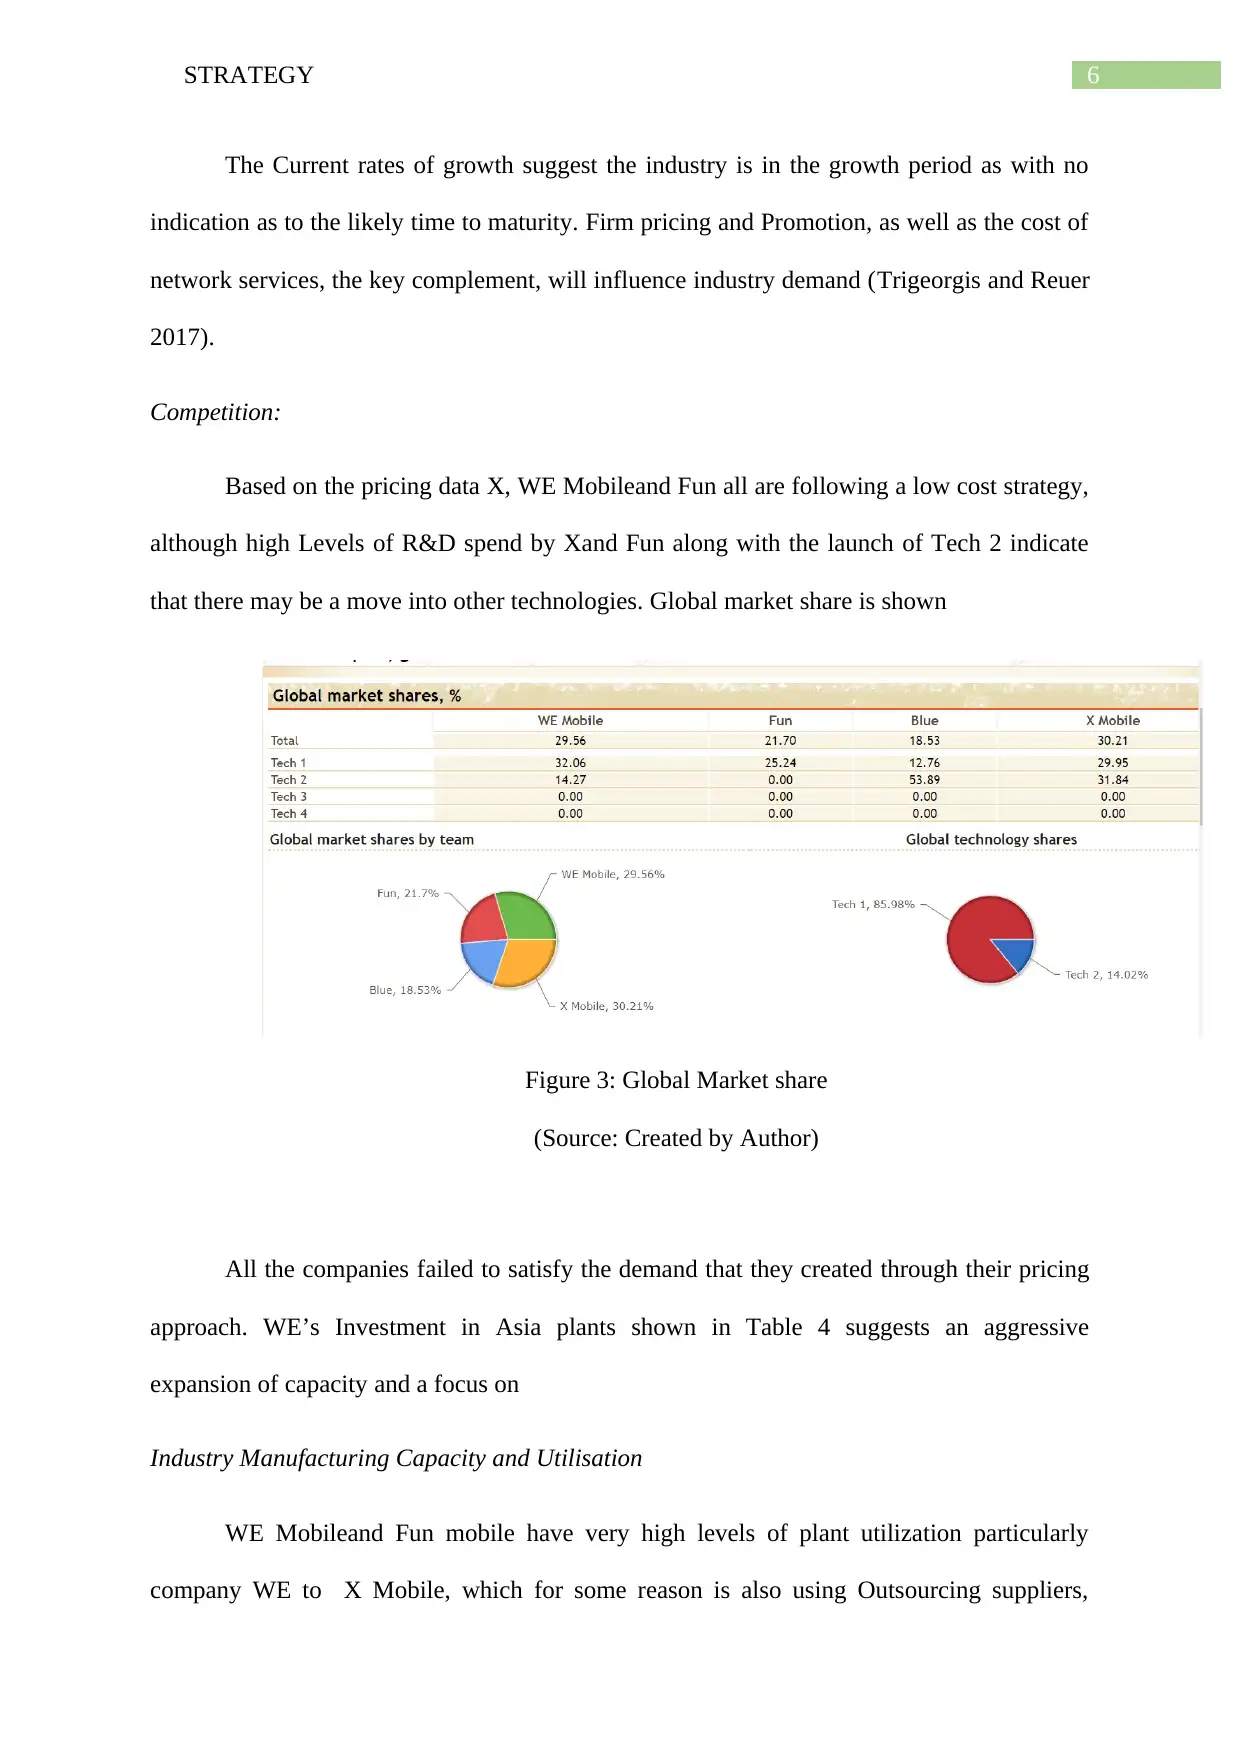
Competition:
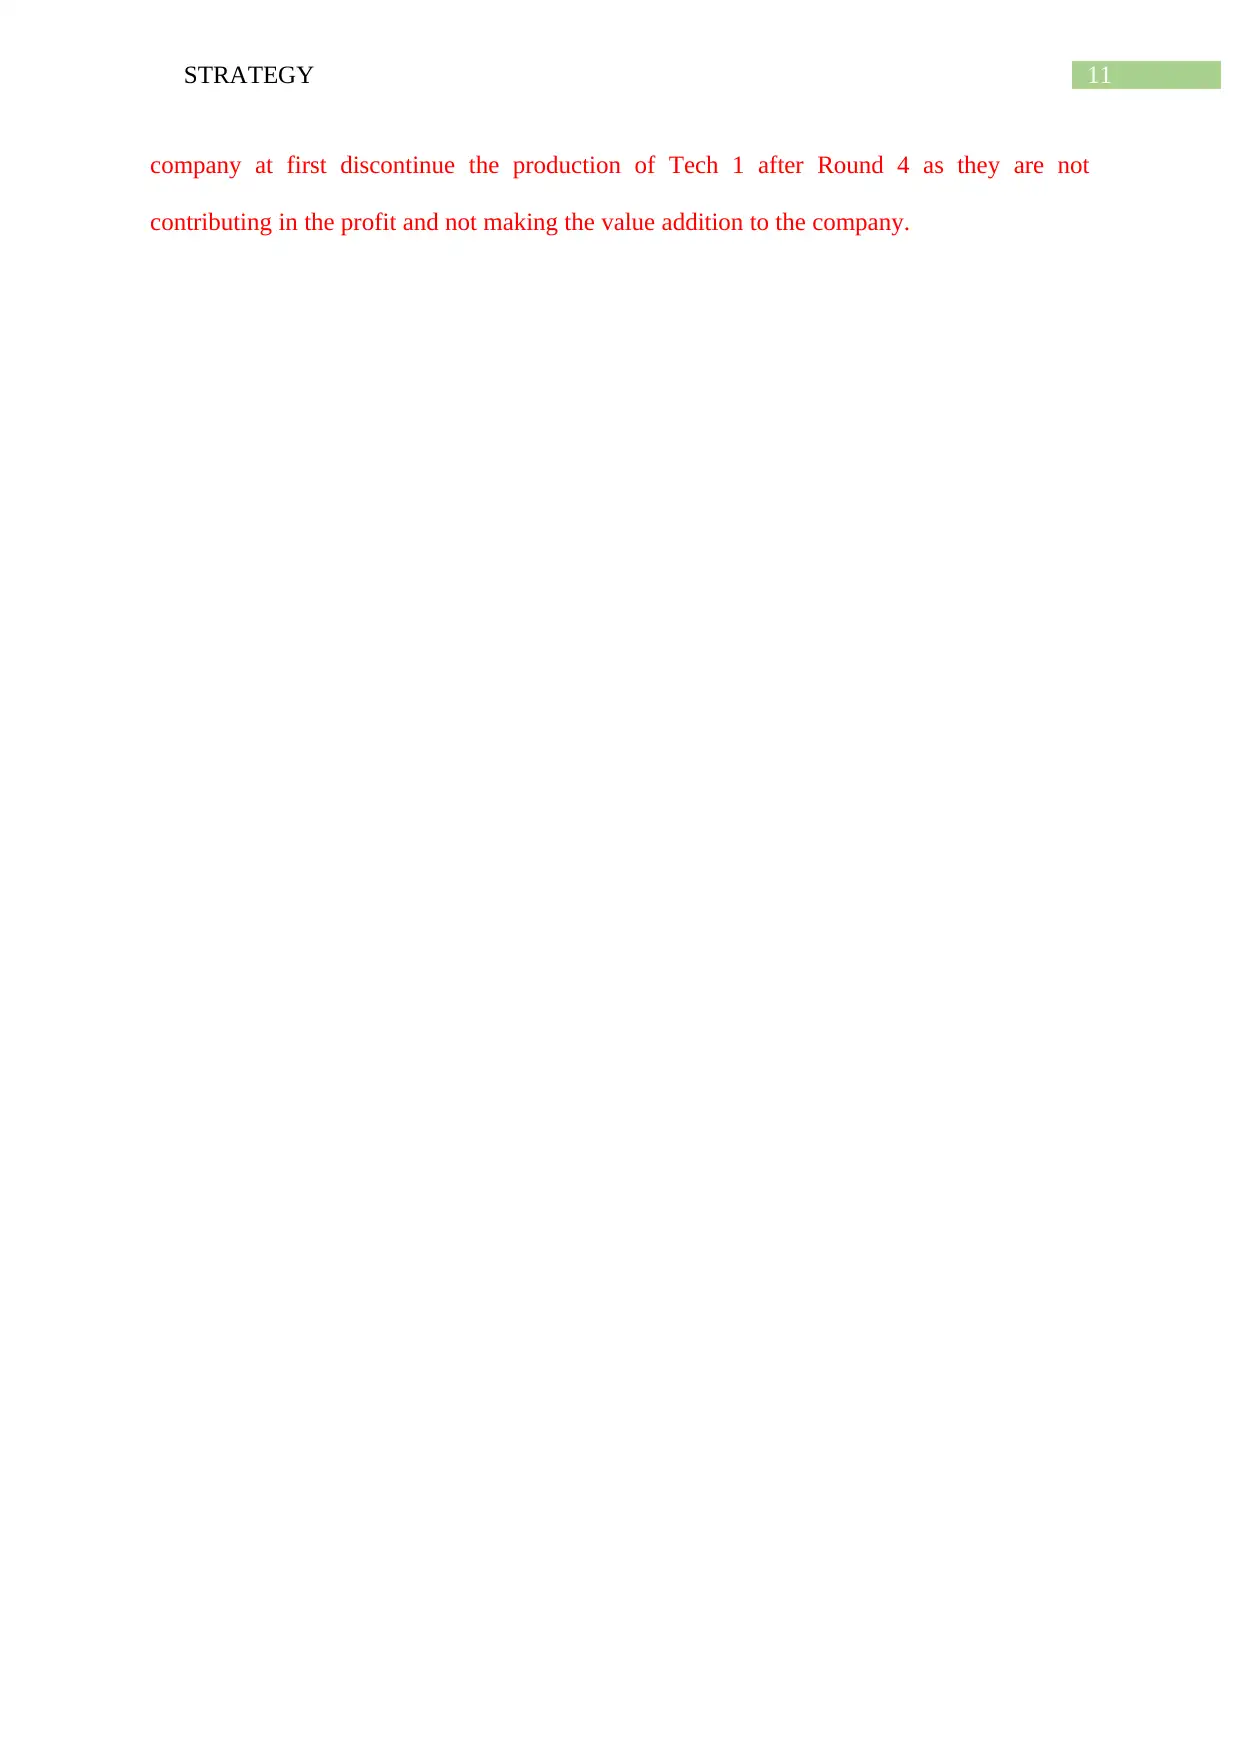
Based on the pricing data X, WE Mobileand Fun all are following a low cost strategy,
although high Levels of R&D spend by Xand Fun along with the launch of Tech 2 indicate
that there may be a move into other technologies. Global market share is shown
Figure 3: Global Market share
(Source: Created by Author)
All the companies failed to satisfy the demand that they created through their pricing
approach. WE’s Investment in Asia plants shown in Table 4 suggests an aggressive
expansion of capacity and a focus on
Industry Manufacturing Capacity and Utilisation
WE Mobileand Fun mobile have very high levels of plant utilization particularly
company WE to X Mobile, which for some reason is also using Outsourcing suppliers,
The Current rates of growth suggest the industry is in the growth period as with no
indication as to the likely time to maturity. Firm pricing and Promotion, as well as the cost of
network services, the key complement, will influence industry demand (Trigeorgis and Reuer
2017).
Competition:
Based on the pricing data X, WE Mobileand Fun all are following a low cost strategy,
although high Levels of R&D spend by Xand Fun along with the launch of Tech 2 indicate
that there may be a move into other technologies. Global market share is shown
Figure 3: Global Market share
(Source: Created by Author)
All the companies failed to satisfy the demand that they created through their pricing
approach. WE’s Investment in Asia plants shown in Table 4 suggests an aggressive
expansion of capacity and a focus on
Industry Manufacturing Capacity and Utilisation
WE Mobileand Fun mobile have very high levels of plant utilization particularly
company WE to X Mobile, which for some reason is also using Outsourcing suppliers,
Paraphrase This Document
Need a fresh take? Get an instant paraphrase of this document with our AI Paraphraser
7STRATEGY
presumably to source Tech 2 at a Lower cost than manufacturing internally. This denies X the
benefits of the experience curve but does allow a lower initial price (Frynas and Mellahi
2015).
Network Coverage:
The network is a key complement to the mobile phone. Network coverage varies globally
suggests that in each region different combinations of phone Techs may be requi WE over
Time. IN the USA, for example, Tech 1 and 2 have the best coverage initially, but both Tech
3 and 4 will be Viable in the longer run.
VRIO Analysis
This is known to be a complement towards PESTEL Analysis and this looks to
evaluate the macro-environment. This analysis is utilised in order to evaluate the scenario
inside the company with respect to their competitive implication, their resources and the
probable potential for the development. VRIO stands for Value, Rare, Imitability and
Organization.
Value: The value of the company is low and therefore the company outsources their
resources in order to manufacture the finished product.
Rareness: The resources that are used are not rare and therefore are very easy to find.
Imitate: The extent of imitation is reasonably high and therefore the resources have
alternatives that can be used by the company in order to reduce the extent of cost and
dependency on others.
Organization: The Company has its own share of manufacturing units and departments that
takes care of all the resources that have been accumulated and accordingly takes the initiation
of manufacturing the finished product and delivering it in the market.
8STRATEGY
SWOT Analysis:
Strength
The current global market is 29.56 m units of which 11m are in Asia. With a market share
of 30.21% and total demand of 6.25m units X Mobile has a manufacturing capacity of 7.8m
units. It can purchase up to 2 m units from outsourcers giving a total capacity of 7.5m units.
Given the high forecast, growth rates WE needs to build plants in Asia both to meet demand
and to WE use tariff and logistic costs (Burns and Dewhurst 2016).
Weakness
The weakness that has been identified has been their dependence on the suppliers and the
lack of motivation of the employees. This has indicated the fact that the rate of turnover in the
company is high and this has an impact on the extent of manufacturing as well.
Opportunity
The current market of 6.25 units can be expect to grow to 35 – 40m units over the next 5
years, with much of this growth in Asia. Demand for WE Mobile products if the firm
maintains its leadership position in 5 years will be in the region of 9 – 12m units, requiring 16
– 22 plants in total, with 7-10 plants in Asia. X has three plants under construction, which
⊘ This is a preview!⊘
Do you want full access?
Subscribe today to unlock all pages.
Trusted by 1+ million students worldwide
9STRATEGY
will provide a short-term cost advantage of up to $259 per phone. They need to start building
plants in Asia aggressively in order to maintain their competitive edge.
Threats
From the swot analysis, the various threats and the opportunities of WE MOBILE can be
identified. In the Asian market, the company has potential market demand and the company
nearly to the highest level of production in that area therefore the company must make
provisional steps to make the production higher. From the analysis, the company also needs
to understand the necessity to produce the unique products in the cheapest cost possible
without hampering the quality to enjoy a substantial life.
Critical Analysis- WE Mobile:
The internal focuses on capabilities, and WE Mobiles resources that link to strategy.
WE Mobile has the second greatest global market share at 29.56%, which has been translate
into the lowest global loss (Chenet al. 2015). Its promotional spend is 35% higher than its
nearest rivals and more than double that of WE Mobile; benefits of this will carry forward in
terms of the WE brand awareness. It has not invested greatly in R&D, and next round will
only have Tech 1 with 4 Features available unless it licenses another Tech. From the internal
analysis it is identified that the company is spending more in the brand promotion rather than
indulging money in the production and R&D sector. If the company keep pace with this
system the company will may not be dependent in the future activities. As the mobile
technology, market has huge influence of new tools and technologies. So that the business
manager and the marketing manager must understand that, only spending money for
advertisement will not grant the value of the company. On the contrary if the company
indulge more in the research and devolvement and the invention from that that the company
Paraphrase This Document
Need a fresh take? Get an instant paraphrase of this document with our AI Paraphraser
10STRATEGY
can attract the customer towards the brand , further the company must advertise on the new
findings that they have achieved.
Proposed Strategy
WE Mobile should pursue a global standardisation strategy based on the tech 3 and
tech 4.
Following the requirements.
Offer best value pricing in terms of tech and feature combinations, offering
increasing value toconsumers each year.
abandon investment in Tech 2
Launch Tech 4 in the next round in Europe, the USA in Round 3 and then
Asia in Round 5.
launch Tech 3 in Asia in Round 3
Discontinue the production of Tech 1 after Round 4.
Internal R&D resources should focus on Tech 3 and 4. Features should be add to tech
1 on a regular basis. Manufacturing planning should seek to minimise production costs
through high plant utilisation. Construction of four plants should begin in the next round and
a further two plants in the following round. Additional plants will be start, as market growth
is more fully understand. Outsourcing capacity shouldbe fully utilised to provide a buffer for
the firm in the event that market growth is not as high. The Forecast indicate it will also allow
WE Mobile to maximize market share in the short run. All the above bulleted points needs to
be assessed by the company in small tenure, further the company must also conduct the
activities systematically. The planning and the business manager will assess the priorities of
the activities that they determine to conduct at first and at last. It is advisable that the
11STRATEGY
company at first discontinue the production of Tech 1 after Round 4 as they are not
contributing in the profit and not making the value addition to the company.
company at first discontinue the production of Tech 1 after Round 4 as they are not
contributing in the profit and not making the value addition to the company.
⊘ This is a preview!⊘
Do you want full access?
Subscribe today to unlock all pages.
Trusted by 1+ million students worldwide
1 out of 16
Related Documents


Your All-in-One AI-Powered Toolkit for Academic Success.
+13062052269
info@desklib.com
Available 24*7 on WhatsApp / Email
![[object Object]](/_next/static/media/star-bottom.7253800d.svg)
Unlock your academic potential
Copyright © 2020–2026 A2Z Services. All Rights Reserved. Developed and managed by ZUCOL.