Business Decision Making: Report for Ann's College, Oxford, UK
VerifiedAdded on 2020/01/16
|22
|4390
|311
Report
AI Summary
This report analyzes the business decision-making process at Ann's College, focusing on addressing declining student numbers and revenue. It begins with an introduction to the college and the problem, followed by an examination of primary and secondary data collection methods, including questionnaires and sampling techniques. Statistical tools such as mean, median, mode, standard deviation, and quartiles are applied to analyze student performance and attendance data. The report also assesses the relationship between training expenses and student grades, concluding with an analysis of student feedback regarding class attendance and satisfaction levels. The findings provide insights into areas for improvement, supporting data-driven decision-making for the college's management.

Business Decision Making
Paraphrase This Document
Need a fresh take? Get an instant paraphrase of this document with our AI Paraphraser
Table of Contents
INTRODUCTION ...............................................................................................................................3
TASK 1.................................................................................................................................................3
1.1....................................................................................................................................................3
1.2....................................................................................................................................................3
1.3....................................................................................................................................................5
1.4....................................................................................................................................................6
TASK 2.................................................................................................................................................7
2.1....................................................................................................................................................7
2.2....................................................................................................................................................8
2.3....................................................................................................................................................9
TASK 3 ................................................................................................................................................9
3.1....................................................................................................................................................9
3.2..................................................................................................................................................11
3.3..................................................................................................................................................13
TASK 4...............................................................................................................................................13
4.1..................................................................................................................................................13
4.2..................................................................................................................................................13
4.3..................................................................................................................................................15
4.4..................................................................................................................................................17
CONCLUSION .................................................................................................................................17
REFERENCES ..................................................................................................................................19
INTRODUCTION
In the present time, it is the responsibility of manager to take decision by reviewing the
performance of the firm on a periodical basis. Moreover, monitoring helps manager in assessing the
deviations which take place in organizational performance. In this, by collecting data and evaluating
it on the basis of statistical tools business entity can determine the suitable solution of the issue
identified. The present report is based on the case scenario of Ann's college which is facing problem
in relation to the poor student numbers and declining sales revenue. In this, the present report will
describe the manner through which university can investigate the issue through the means of
primary and secondary data. Besides this, it will also shed light on the ways in which financial and
statistical tools help in decision making.
TASK 1
1.1
St. Ann's college is one of the main constituents of the University of Oxford in England. On
initial level it started as women college and now it offers educational facility to both male and
female. It has achieved the status of larger colleges in Oxford and offering educational services to
450 undergraduate and 200 graduate students. Progressive outlook, architecture and well-
established library is one of the main strengths of such college. With the aim to expand the services
Ann's college has employed the acquisition strategy. Annual review of 2013-14 entails that college
endowment was £37 million in such period. Cited case situation entails that numbers of the student
decreased to the large extent. Due to this, sales revenue of the college decreased to the significant
level which in turn hampers the overall performance of the institution.
1.2
Primary Data
To understand any issue or concern related to organisation primary data is preferred over
Secondary data in situation where sample size is manageable and reachable. Primary data collection
focusses on retrieving the data directly from the subject or individuals concerned (Sutherland and
Holstead, 2014). Ann's college should interview the existing students and those trying to seek
⊘ This is a preview!⊘
Do you want full access?
Subscribe today to unlock all pages.
Trusted by 1+ million students worldwide
admission into the college to get the feedback and reviews of students and incorporating reasonable
suggestions into the functioning and administration of college. Researchers should closely observe
the patterns and examine the behaviour of students pursuing into the college for better
understanding the issues. Action research is applied exclusively and mainly into education sector for
continuous improvement of the process and methods involved and improvise the approach involved
earlier (Popovič and et.al., 2012). Organisation should also critically examine the case study if any
about a similar kind of situation faced earlier in same industry background which will provide a
clear picture to entity to overcome the current business problem.
Questionnaire would act as an excellent method for gathering information from 20 students
around which should contain set of printed questions with multiple choices and should be free from
ambiguity and personal bias of students to test and examine the opinion and preferences of students
of college (Craft, 2013). Studying the culture of students and college and their interaction as per
Ethnography would lead to successful research to derive meaningful information for existing
business problem. Longitudinal data should be preferred and collected from previous students
qualified from ANN's college to derive their suggestions and feedback regarding quality of
education and services provided by organisation and comparing the results with services provided
now.
Secondary Data
Secondary data is the data which have already been collected by some other user and is
readily available to an organisation for further usage relying on the terms and conditions under
which such data and information was collected and interpreted (Zolfani and et.al., 2013). Ann's
college should firstly and for mostly refer the earlier researches conducted by them if any to derive
most relevant information related to current business problem however in absence of any such
previous research, official statistics published by UK government or any other public authorities
should be relied upon. Statistics and figures published by top newspapers regarding youth and
students interested in courses offered by Ann's College should be viewed in newspapers such as The
Sun, Daily Mail, Metro, The Times etc. (Isik, Jones and Sidorova, 2013). Retrieval of Historical
data and information may be preferred to understand the situation of decreasing revenues and
Paraphrase This Document
Need a fresh take? Get an instant paraphrase of this document with our AI Paraphraser
downfall in number of students as well. Government reports published on periodical basis should be
used as a tool by researchers to examine the drawbacks and streamlining the current situation and
Web based information should be used to convert the present threat into opportunity and grab the
maximum attention of students seeking career counselling and promoting courses offered by ANN's
college.
1.3
Questionnaire
Demographic information
Name ….........
Age ….........
Gender ….......
Type of course in which do you enrol
Graduate ()
Undergraduate ()
1. Do you regular attend the classes?
Yes ()
No ()
2. Do you agree that each and every concept is presented by the lecturers in a clear as well as
precise manner?
Agree ()
Strongly agree ()
Neutral ()
Disagree ()
Strongly disagree ()
3. Are you satisfied with the supporting notes or study material provided by the tutors?
Satisfied ()
Highly satisfied ()
Neutral ()
Dissatisfied ()
Highly dissatisfied ()
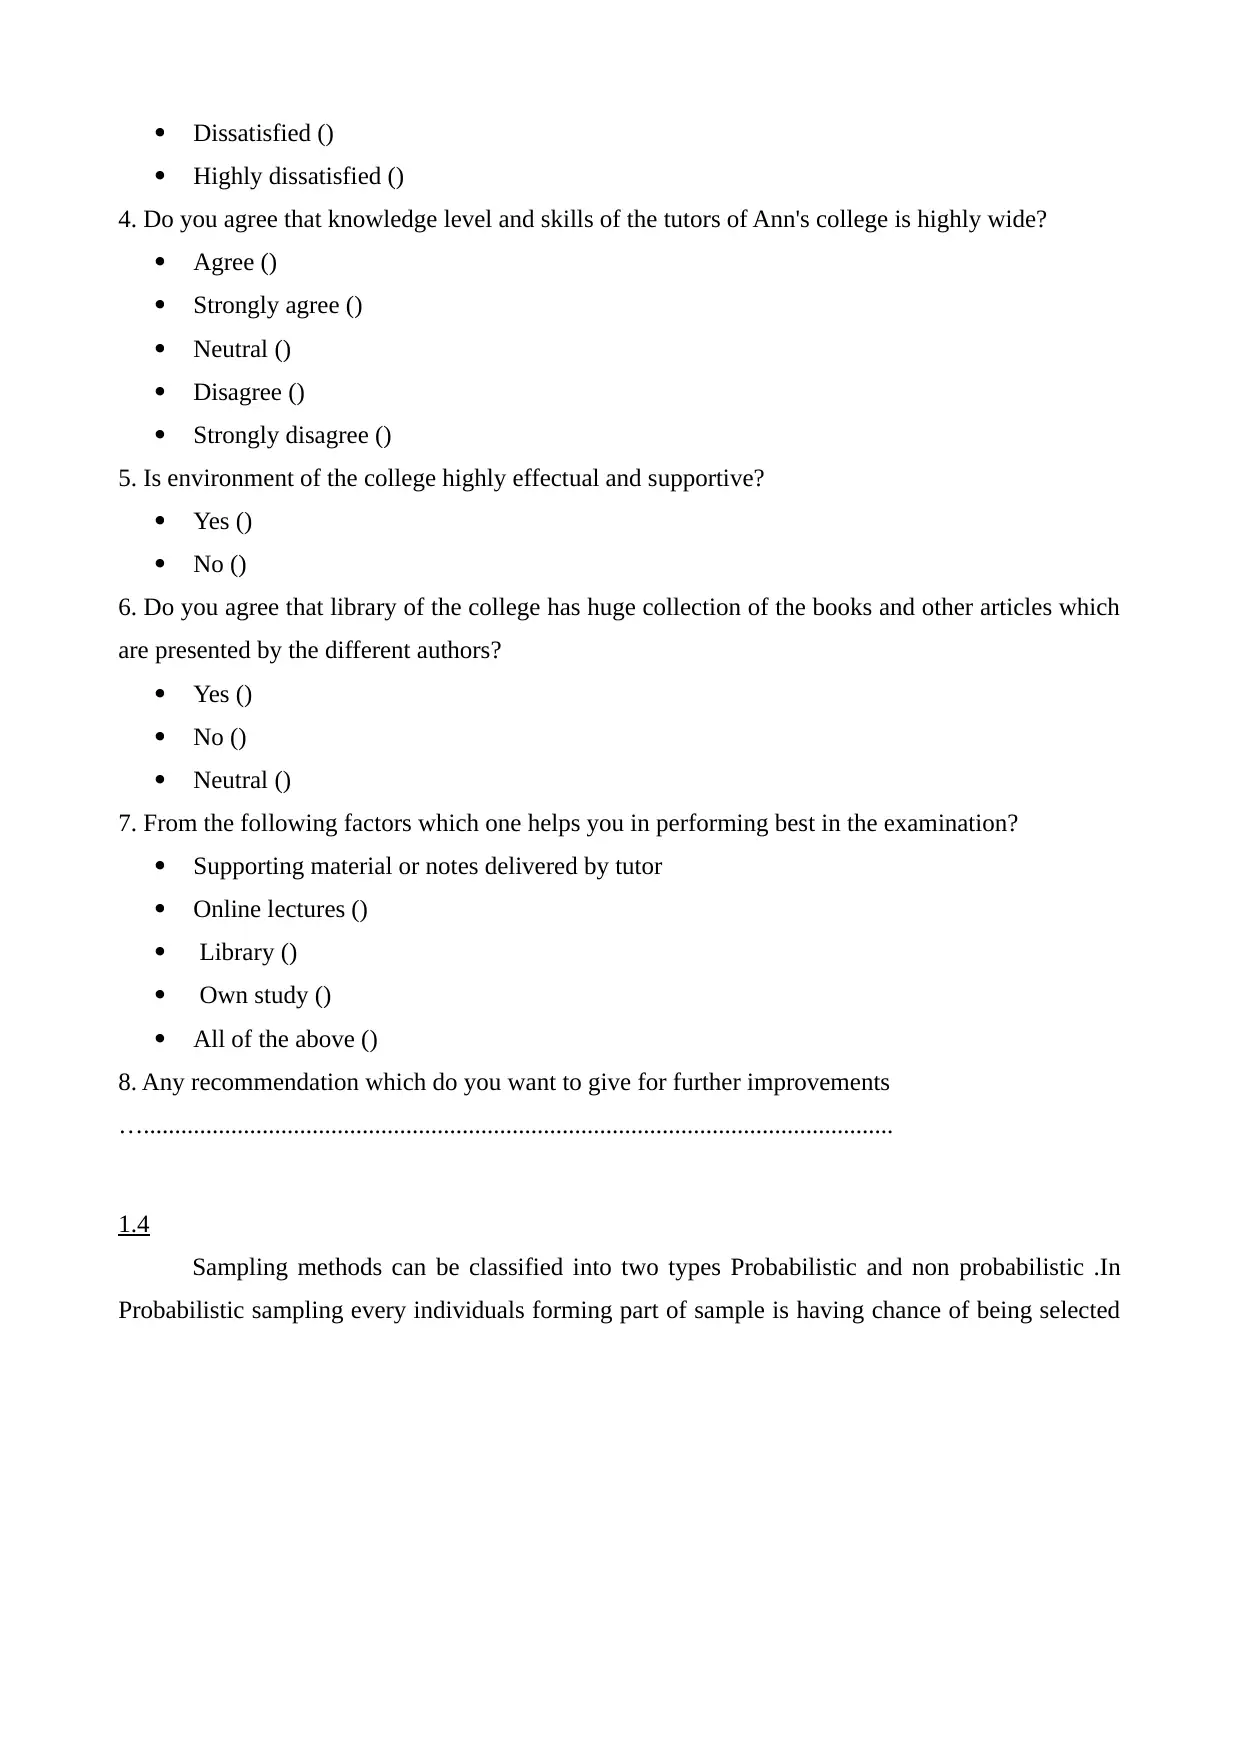
4. Do you agree that knowledge level and skills of the tutors of Ann's college is highly wide?
Agree ()
Strongly agree ()
Neutral ()
Disagree ()
Strongly disagree ()
5. Is environment of the college highly effectual and supportive?
Yes ()
No ()
6. Do you agree that library of the college has huge collection of the books and other articles which
are presented by the different authors?
Yes ()
No ()
Neutral ()
7. From the following factors which one helps you in performing best in the examination?
Supporting material or notes delivered by tutor
Online lectures ()
Library ()
Own study ()
All of the above ()
8. Any recommendation which do you want to give for further improvements
…........................................................................................................................
1.4
Sampling methods can be classified into two types Probabilistic and non probabilistic .In
Probabilistic sampling every individuals forming part of sample is having chance of being selected
Highly dissatisfied ()
4. Do you agree that knowledge level and skills of the tutors of Ann's college is highly wide?
Agree ()
Strongly agree ()
Neutral ()
Disagree ()
Strongly disagree ()
5. Is environment of the college highly effectual and supportive?
Yes ()
No ()
6. Do you agree that library of the college has huge collection of the books and other articles which
are presented by the different authors?
Yes ()
No ()
Neutral ()
7. From the following factors which one helps you in performing best in the examination?
Supporting material or notes delivered by tutor
Online lectures ()
Library ()
Own study ()
All of the above ()
8. Any recommendation which do you want to give for further improvements
…........................................................................................................................
1.4
Sampling methods can be classified into two types Probabilistic and non probabilistic .In
Probabilistic sampling every individuals forming part of sample is having chance of being selected
⊘ This is a preview!⊘
Do you want full access?
Subscribe today to unlock all pages.
Trusted by 1+ million students worldwide
through random sampling or systematic sampling or stratified sampling (Hacklin and Wallnöfer,
2012). Most appropriate method for ANN's college is random sampling according to which every
student is having equal chance of being selected therefore free from personal bias and would
provide accurate and reliable information to incorporate the changes suggested and preferred.
Researchers should select set (strata) of 20 students to perform research to closely
understand the issue of loss of revenue and lack of new admissions to the college enquiries and
interviews should be conducted on students to obtain information regarding their satisfaction level
and experience with the college (Sharma, Mithas and Kankanhalli, 2014). Random sampling is
preferred to choose a few students among the whole population of students pursuing education from
ANN's college to closely observe and derive information and finding out the way to enhance the
quality of services offered by the Institute and incorporating suggested feasible changes and
removing and outlining the competition by providing world class education and complimentary
services to students and faculties.
TASK 2
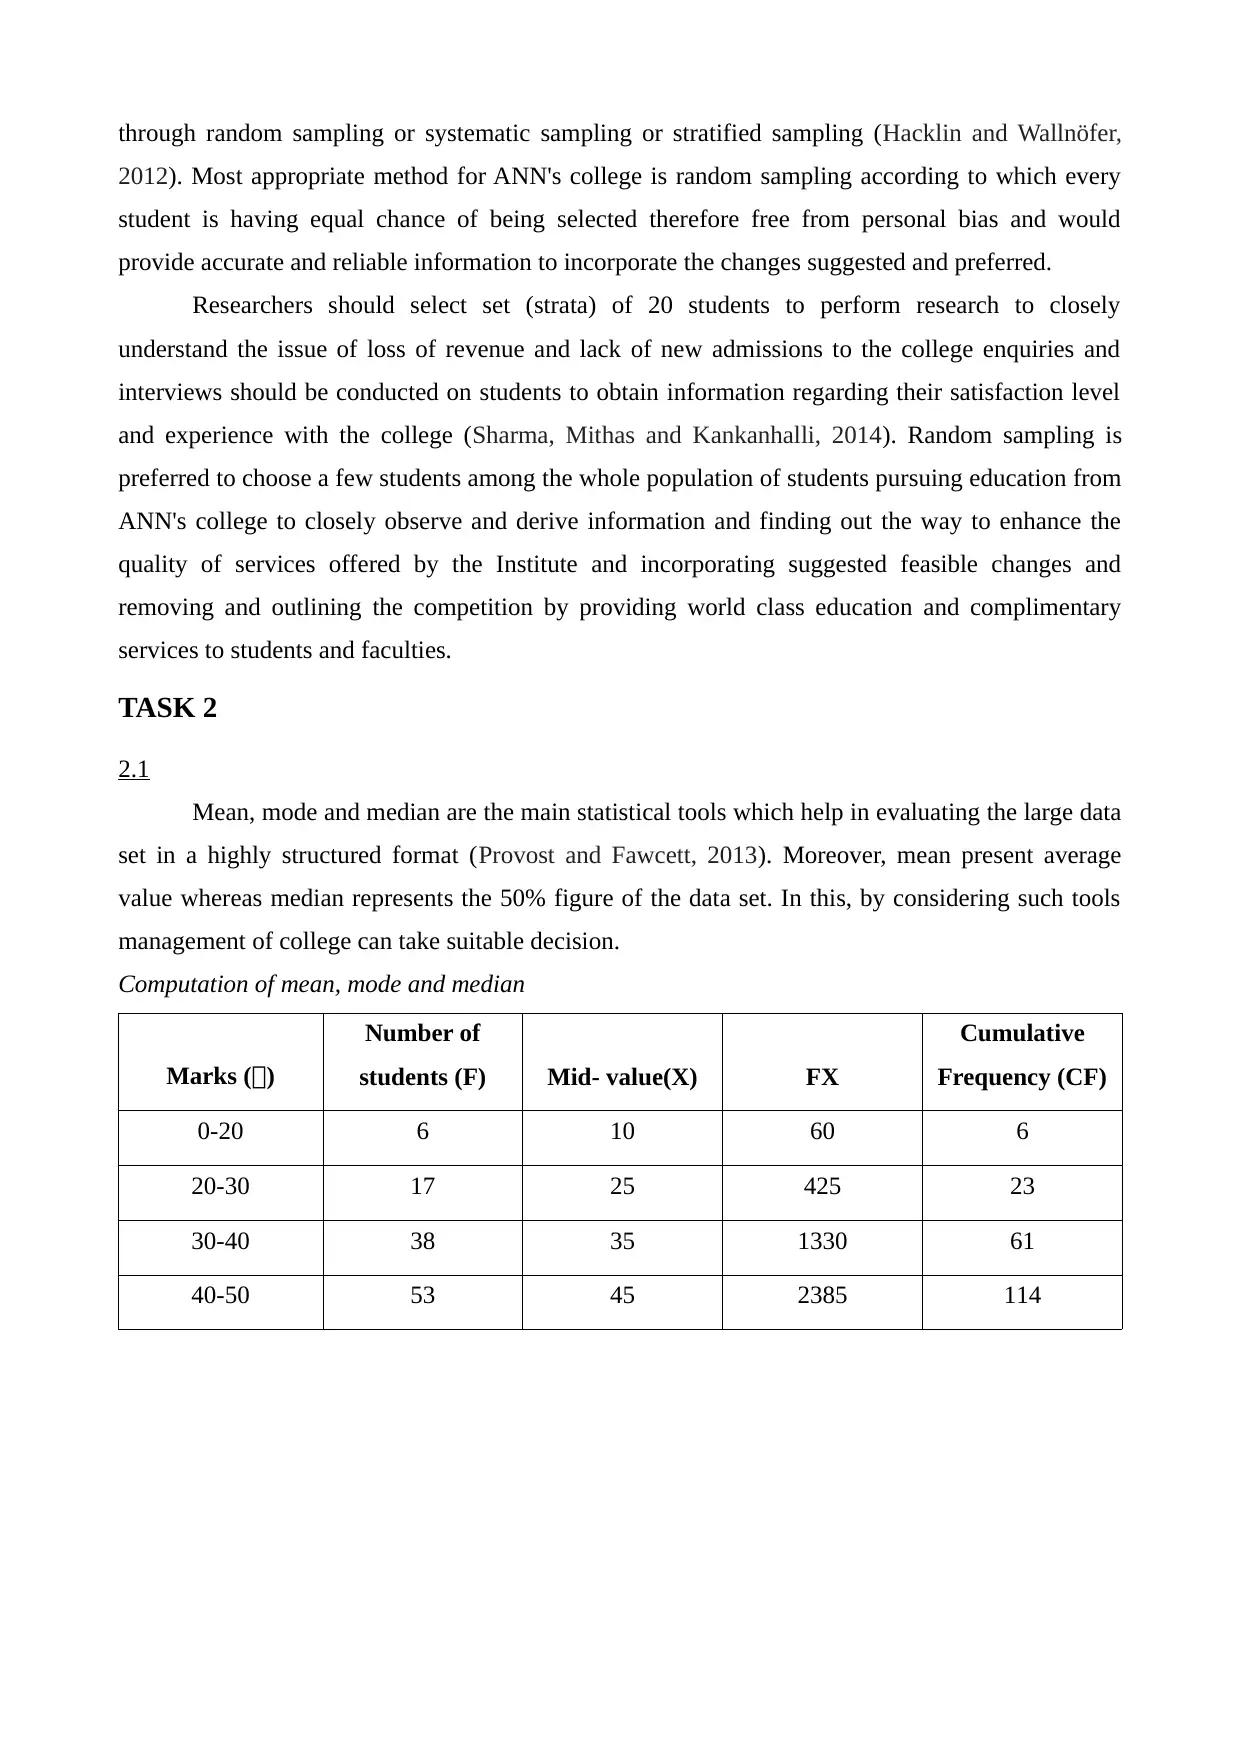
2.1
Mean, mode and median are the main statistical tools which help in evaluating the large data
set in a highly structured format (Provost and Fawcett, 2013). Moreover, mean present average
value whereas median represents the 50% figure of the data set. In this, by considering such tools
management of college can take suitable decision.
Computation of mean, mode and median
Marks (£)
Number of
students (F) Mid- value(X) FX
Cumulative
Frequency (CF)
0-20 6 10 60 6
20-30 17 25 425 23
30-40 38 35 1330 61
40-50 53 45 2385 114
2012). Most appropriate method for ANN's college is random sampling according to which every
student is having equal chance of being selected therefore free from personal bias and would
provide accurate and reliable information to incorporate the changes suggested and preferred.
Researchers should select set (strata) of 20 students to perform research to closely
understand the issue of loss of revenue and lack of new admissions to the college enquiries and
interviews should be conducted on students to obtain information regarding their satisfaction level
and experience with the college (Sharma, Mithas and Kankanhalli, 2014). Random sampling is
preferred to choose a few students among the whole population of students pursuing education from
ANN's college to closely observe and derive information and finding out the way to enhance the
quality of services offered by the Institute and incorporating suggested feasible changes and
removing and outlining the competition by providing world class education and complimentary
services to students and faculties.
TASK 2
2.1
Mean, mode and median are the main statistical tools which help in evaluating the large data
set in a highly structured format (Provost and Fawcett, 2013). Moreover, mean present average
value whereas median represents the 50% figure of the data set. In this, by considering such tools
management of college can take suitable decision.
Computation of mean, mode and median
Marks (£)
Number of
students (F) Mid- value(X) FX
Cumulative
Frequency (CF)
0-20 6 10 60 6
20-30 17 25 425 23
30-40 38 35 1330 61
40-50 53 45 2385 114
Paraphrase This Document
Need a fresh take? Get an instant paraphrase of this document with our AI Paraphraser
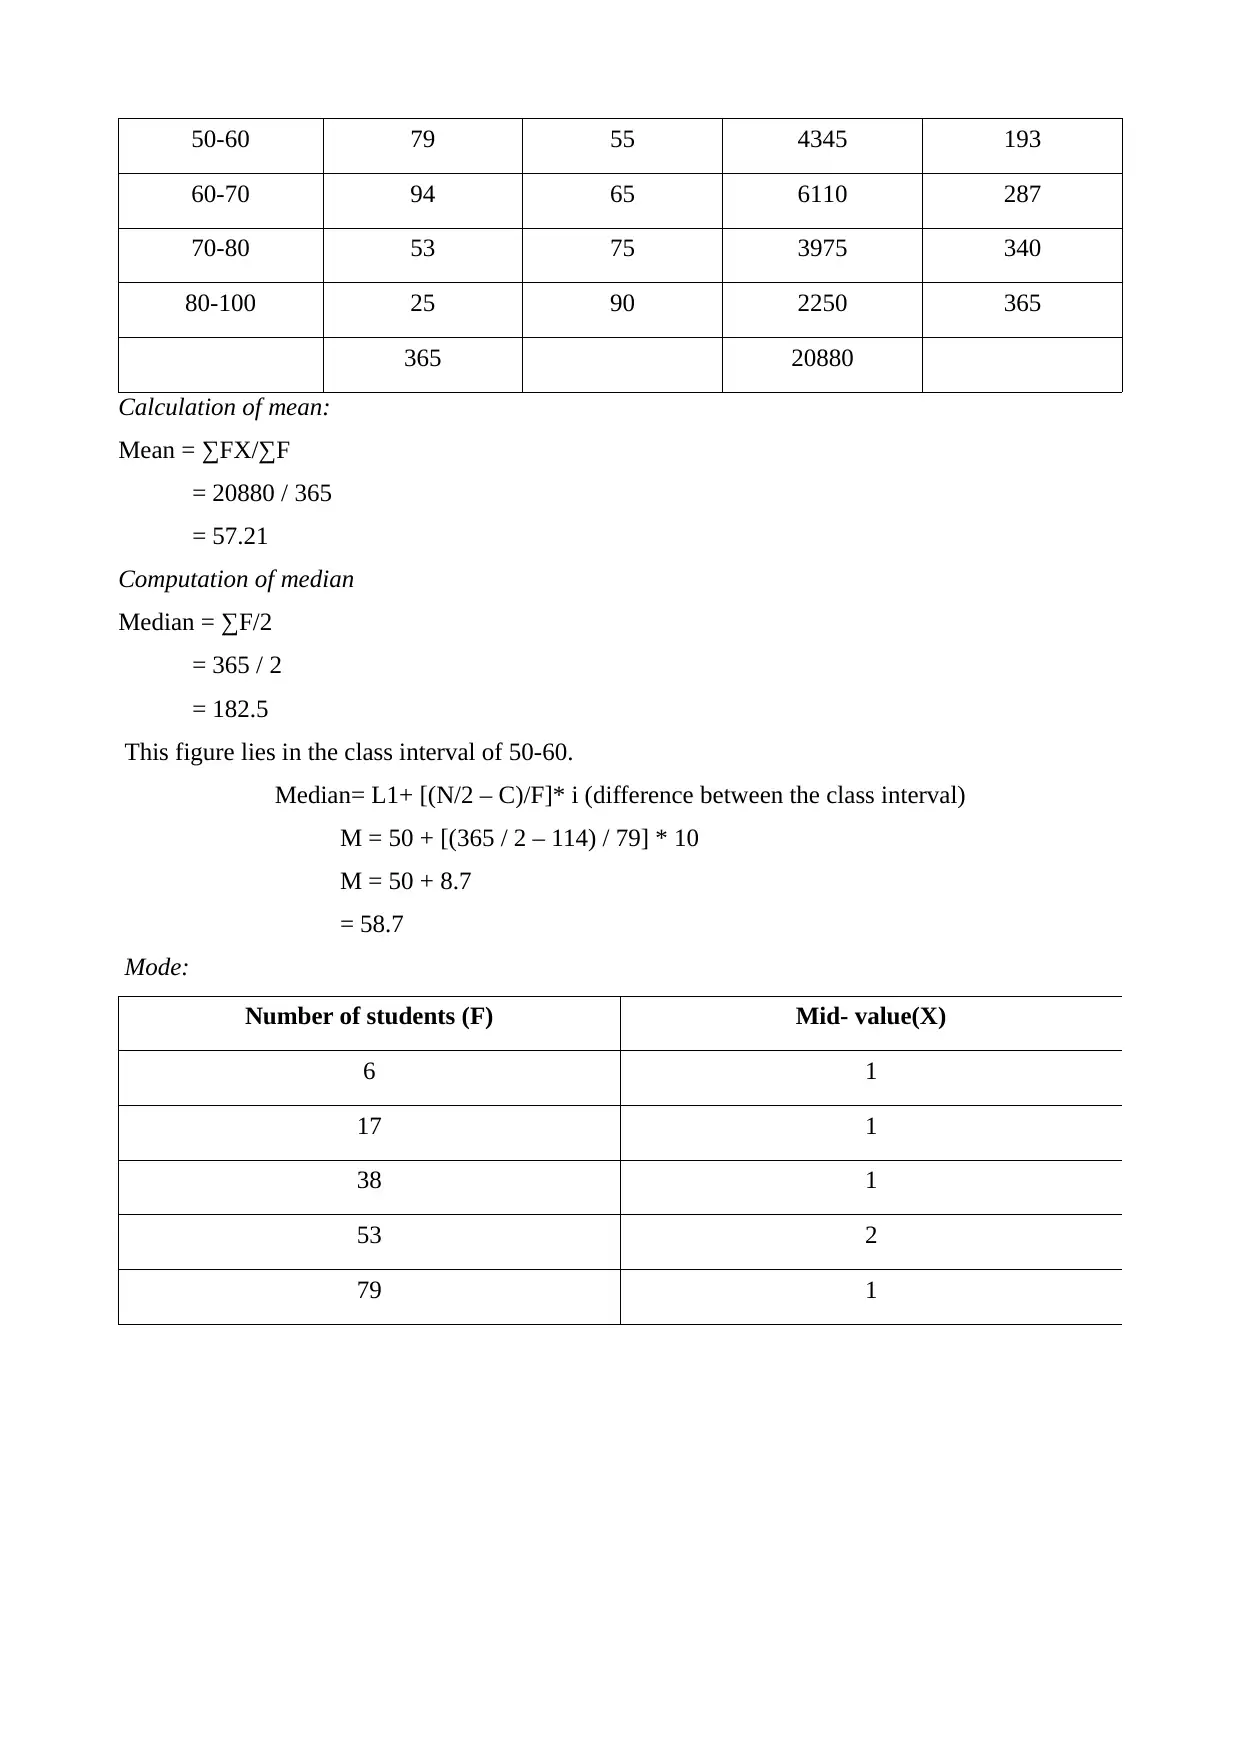
50-60 79 55 4345 193
60-70 94 65 6110 287
70-80 53 75 3975 340
80-100 25 90 2250 365
365 20880
Calculation of mean:
Mean = ∑FX/∑F
= 20880 / 365
= 57.21
Computation of median
Median = ∑F/2
= 365 / 2
= 182.5
This figure lies in the class interval of 50-60.
Median= L1+ [(N/2 – C)/F]* i (difference between the class interval)
M = 50 + [(365 / 2 – 114) / 79] * 10
M = 50 + 8.7
= 58.7
Mode:
Number of students (F) Mid- value(X)
6 1
17 1
38 1
53 2
79 1
94 1
25 1
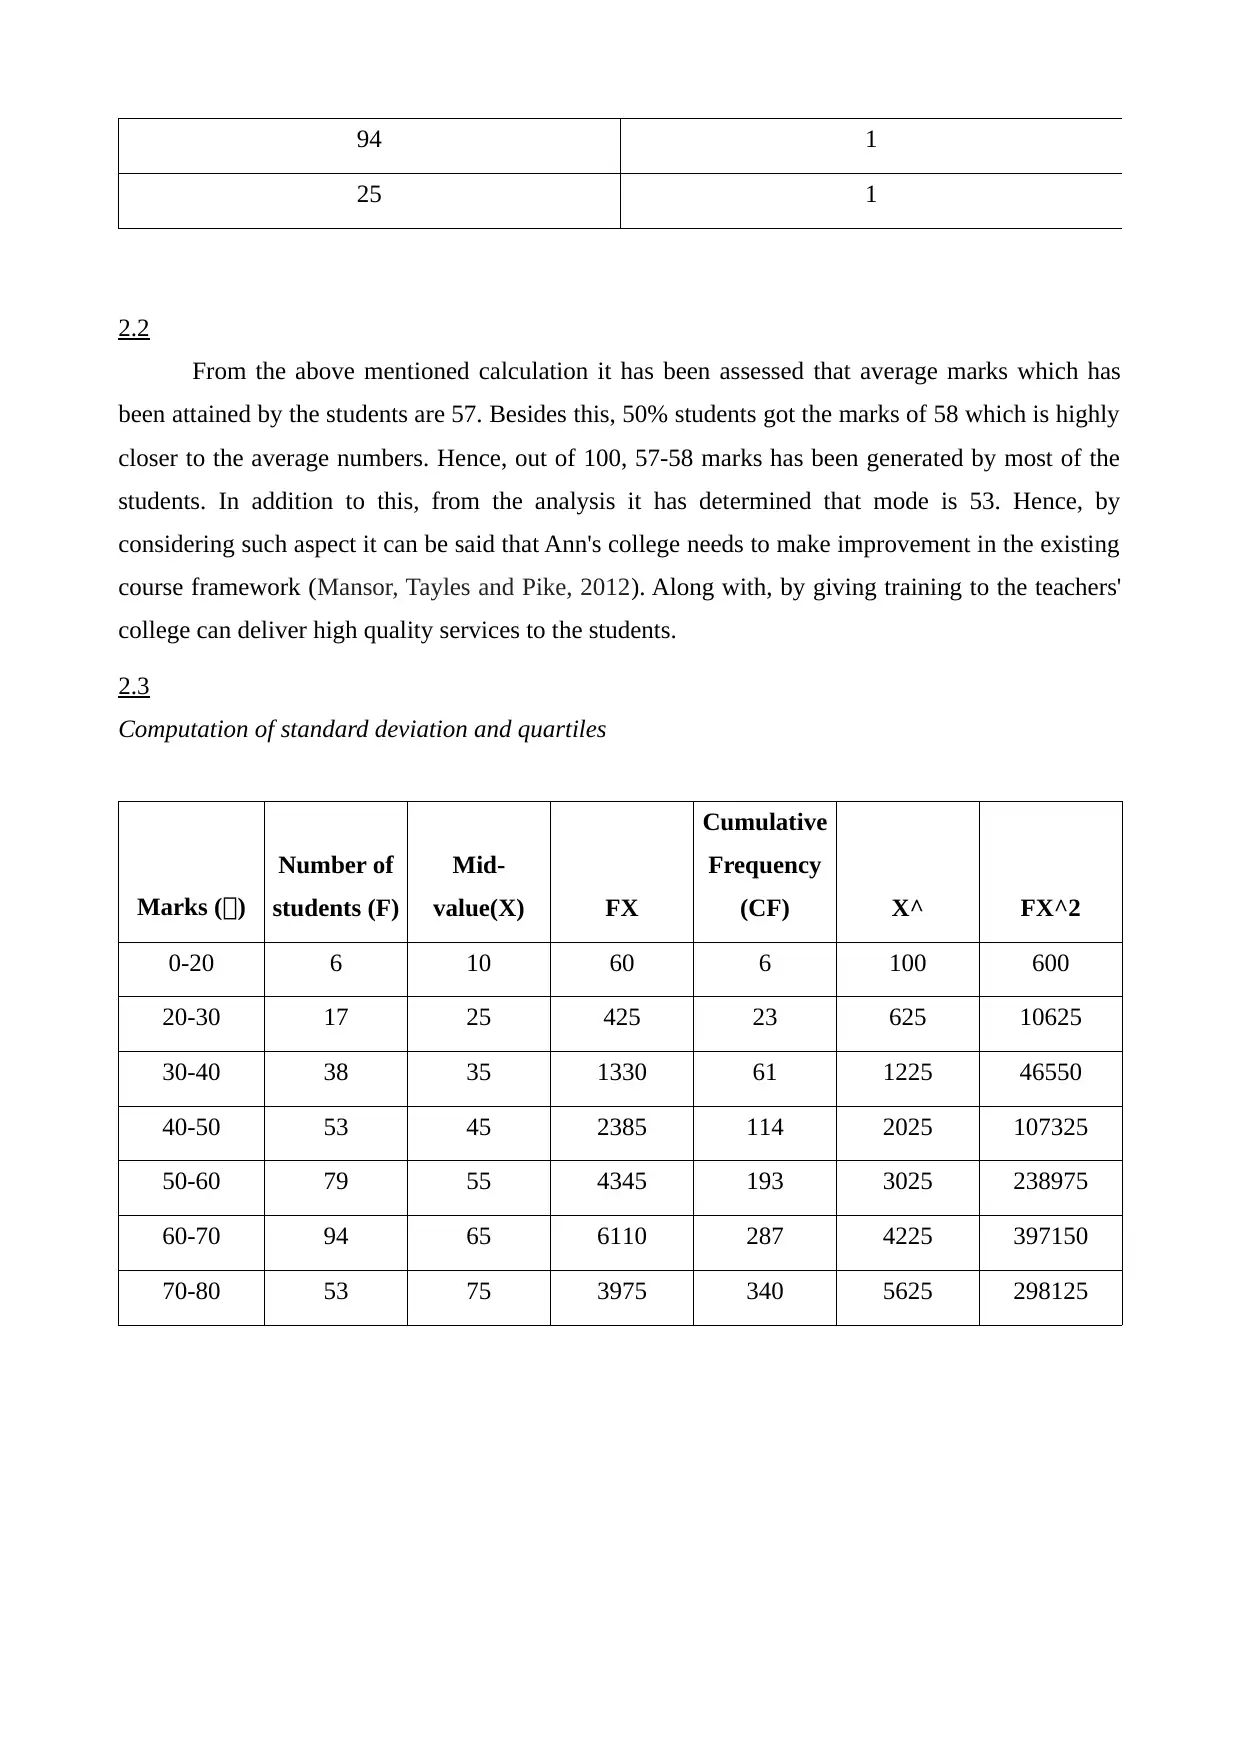
2.2
From the above mentioned calculation it has been assessed that average marks which has
been attained by the students are 57. Besides this, 50% students got the marks of 58 which is highly
closer to the average numbers. Hence, out of 100, 57-58 marks has been generated by most of the
students. In addition to this, from the analysis it has determined that mode is 53. Hence, by
considering such aspect it can be said that Ann's college needs to make improvement in the existing
course framework (Mansor, Tayles and Pike, 2012). Along with, by giving training to the teachers'
college can deliver high quality services to the students.
2.3
Computation of standard deviation and quartiles
Marks (£)
Number of
students (F)
Mid-
value(X) FX
Cumulative
Frequency
(CF) X^ FX^2
0-20 6 10 60 6 100 600
20-30 17 25 425 23 625 10625
30-40 38 35 1330 61 1225 46550
40-50 53 45 2385 114 2025 107325
50-60 79 55 4345 193 3025 238975
60-70 94 65 6110 287 4225 397150
70-80 53 75 3975 340 5625 298125
25 1
2.2
From the above mentioned calculation it has been assessed that average marks which has
been attained by the students are 57. Besides this, 50% students got the marks of 58 which is highly
closer to the average numbers. Hence, out of 100, 57-58 marks has been generated by most of the
students. In addition to this, from the analysis it has determined that mode is 53. Hence, by
considering such aspect it can be said that Ann's college needs to make improvement in the existing
course framework (Mansor, Tayles and Pike, 2012). Along with, by giving training to the teachers'
college can deliver high quality services to the students.
2.3
Computation of standard deviation and quartiles
Marks (£)
Number of
students (F)
Mid-
value(X) FX
Cumulative
Frequency
(CF) X^ FX^2
0-20 6 10 60 6 100 600
20-30 17 25 425 23 625 10625
30-40 38 35 1330 61 1225 46550
40-50 53 45 2385 114 2025 107325
50-60 79 55 4345 193 3025 238975
60-70 94 65 6110 287 4225 397150
70-80 53 75 3975 340 5625 298125
⊘ This is a preview!⊘
Do you want full access?
Subscribe today to unlock all pages.
Trusted by 1+ million students worldwide
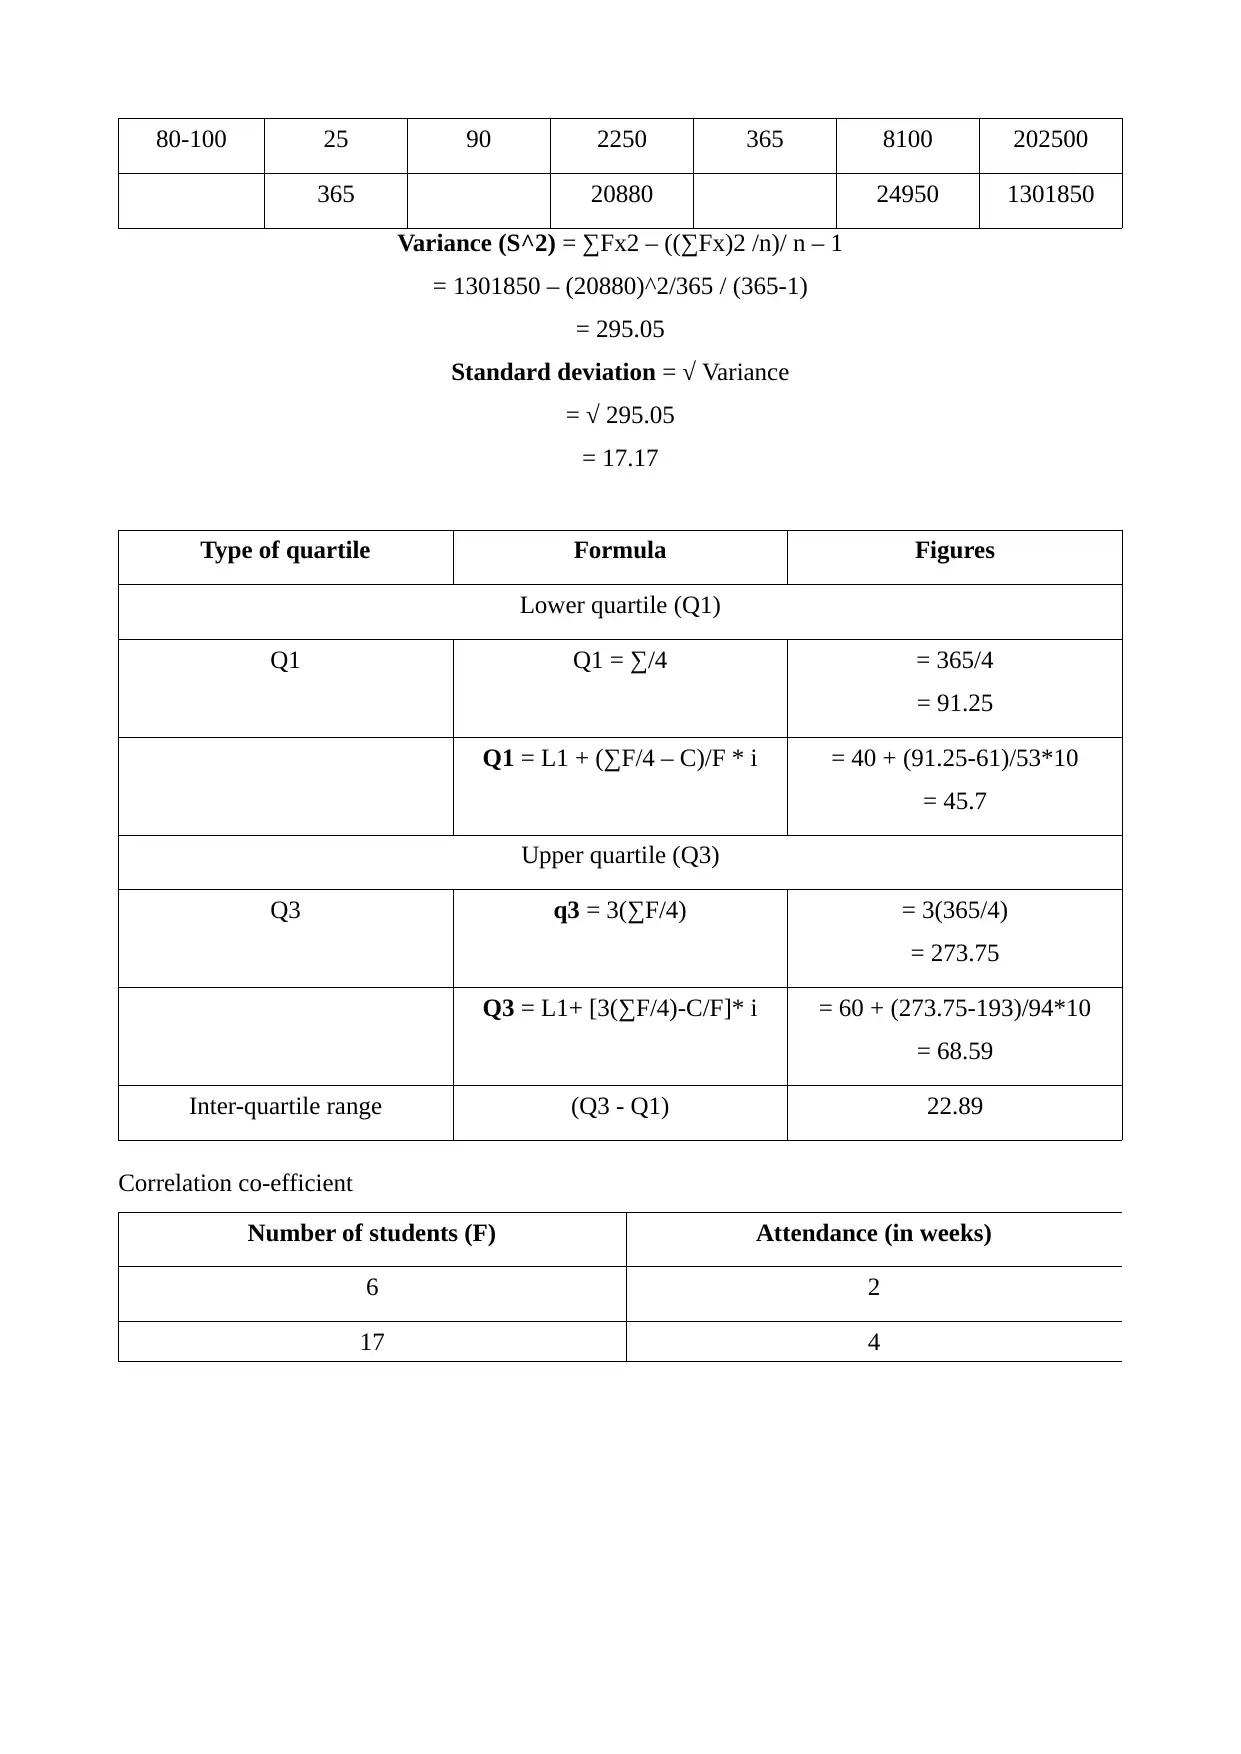
80-100 25 90 2250 365 8100 202500
365 20880 24950 1301850
Variance (S^2) = ∑Fx2 – ((∑Fx)2 /n)/ n – 1
= 1301850 – (20880)^2/365 / (365-1)
= 295.05
Standard deviation = √ Variance
= √ 295.05
= 17.17
Type of quartile Formula Figures
Lower quartile (Q1)
Q1 Q1 = ∑/4 = 365/4
= 91.25
Q1 = L1 + (∑F/4 – C)/F * i = 40 + (91.25-61)/53*10
= 45.7
Upper quartile (Q3)
Q3 q3 = 3(∑F/4) = 3(365/4)
= 273.75
Q3 = L1+ [3(∑F/4)-C/F]* i = 60 + (273.75-193)/94*10
= 68.59
Inter-quartile range (Q3 - Q1) 22.89
Correlation co-efficient
Number of students (F) Attendance (in weeks)
6 2
17 4
Paraphrase This Document
Need a fresh take? Get an instant paraphrase of this document with our AI Paraphraser
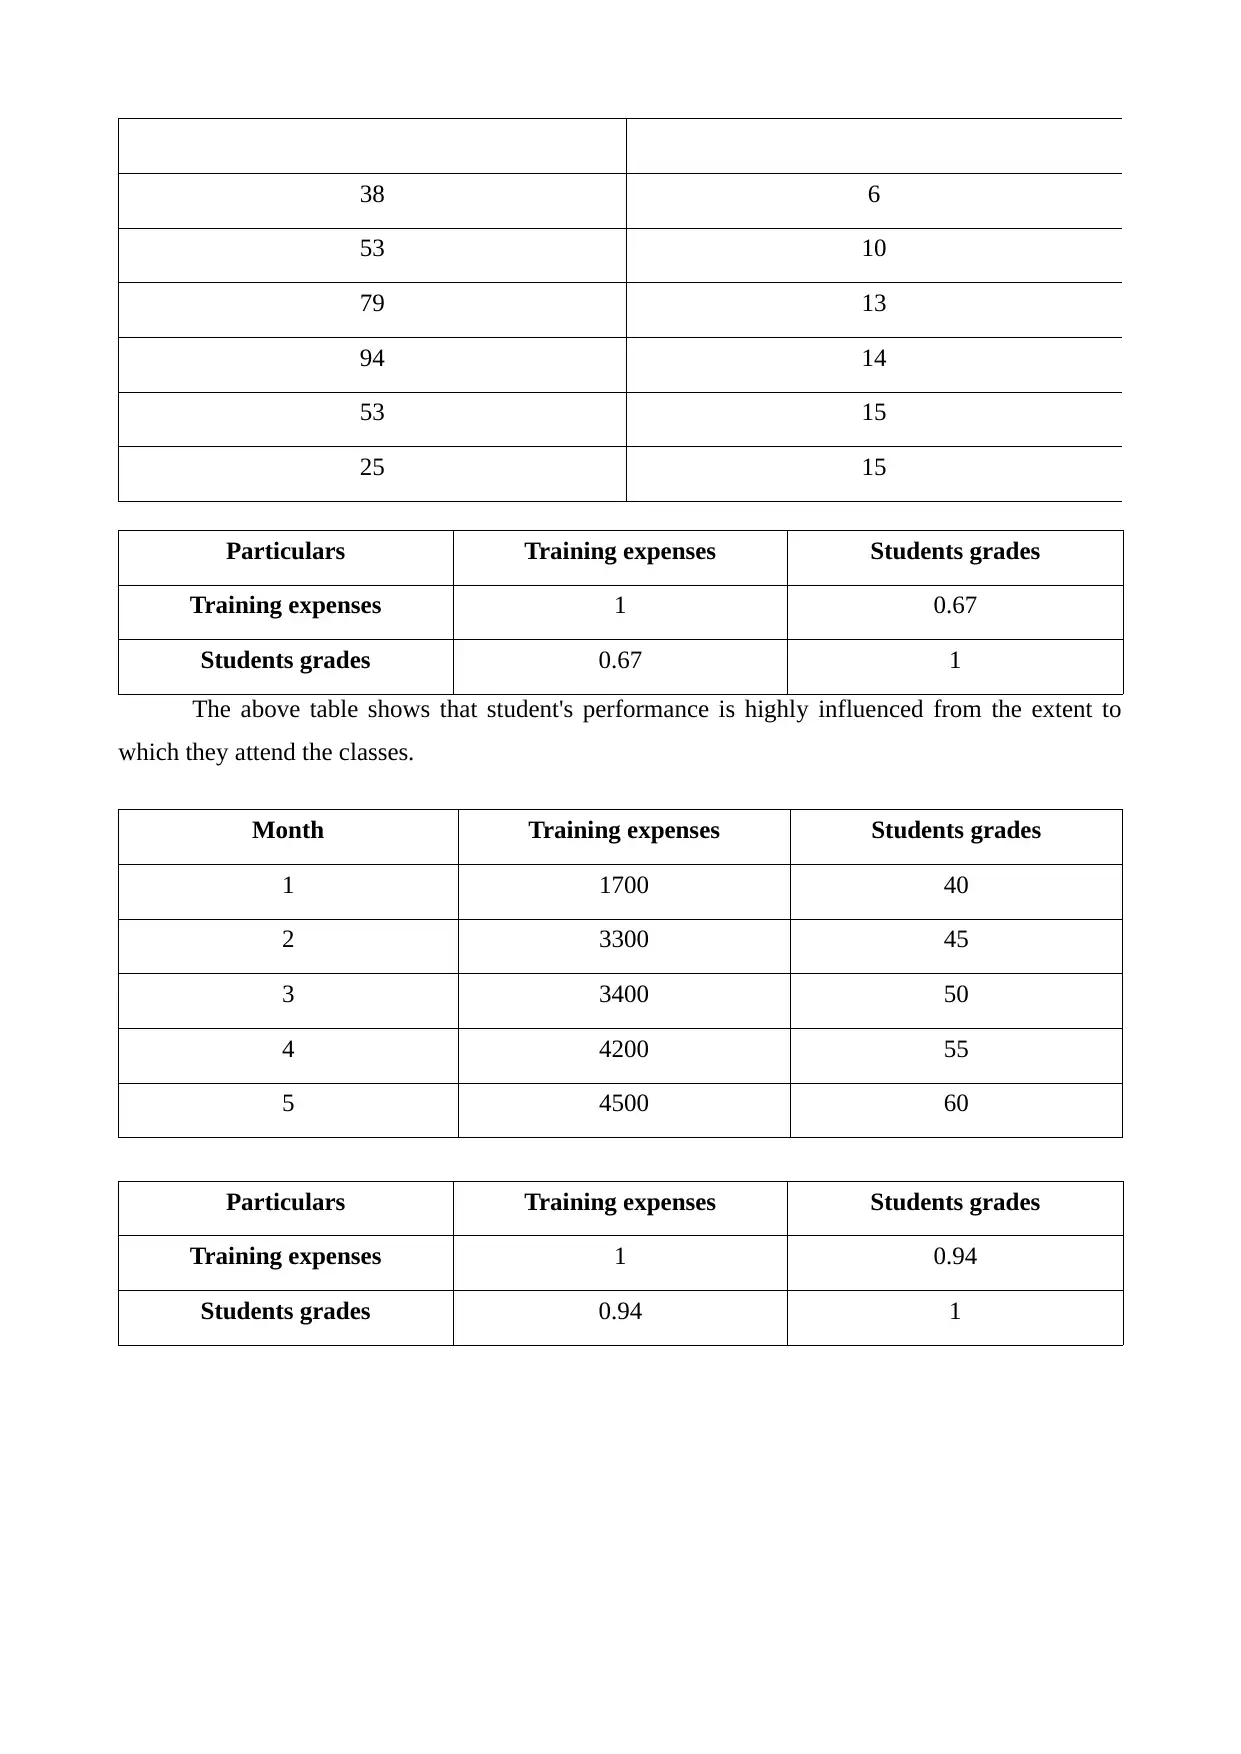
38 6
53 10
79 13
94 14
53 15
25 15
Particulars Training expenses Students grades
Training expenses 1 0.67
Students grades 0.67 1
The above table shows that student's performance is highly influenced from the extent to
which they attend the classes.
Month Training expenses Students grades
1 1700 40
2 3300 45
3 3400 50
4 4200 55
5 4500 60
Particulars Training expenses Students grades
Training expenses 1 0.94
Students grades 0.94 1
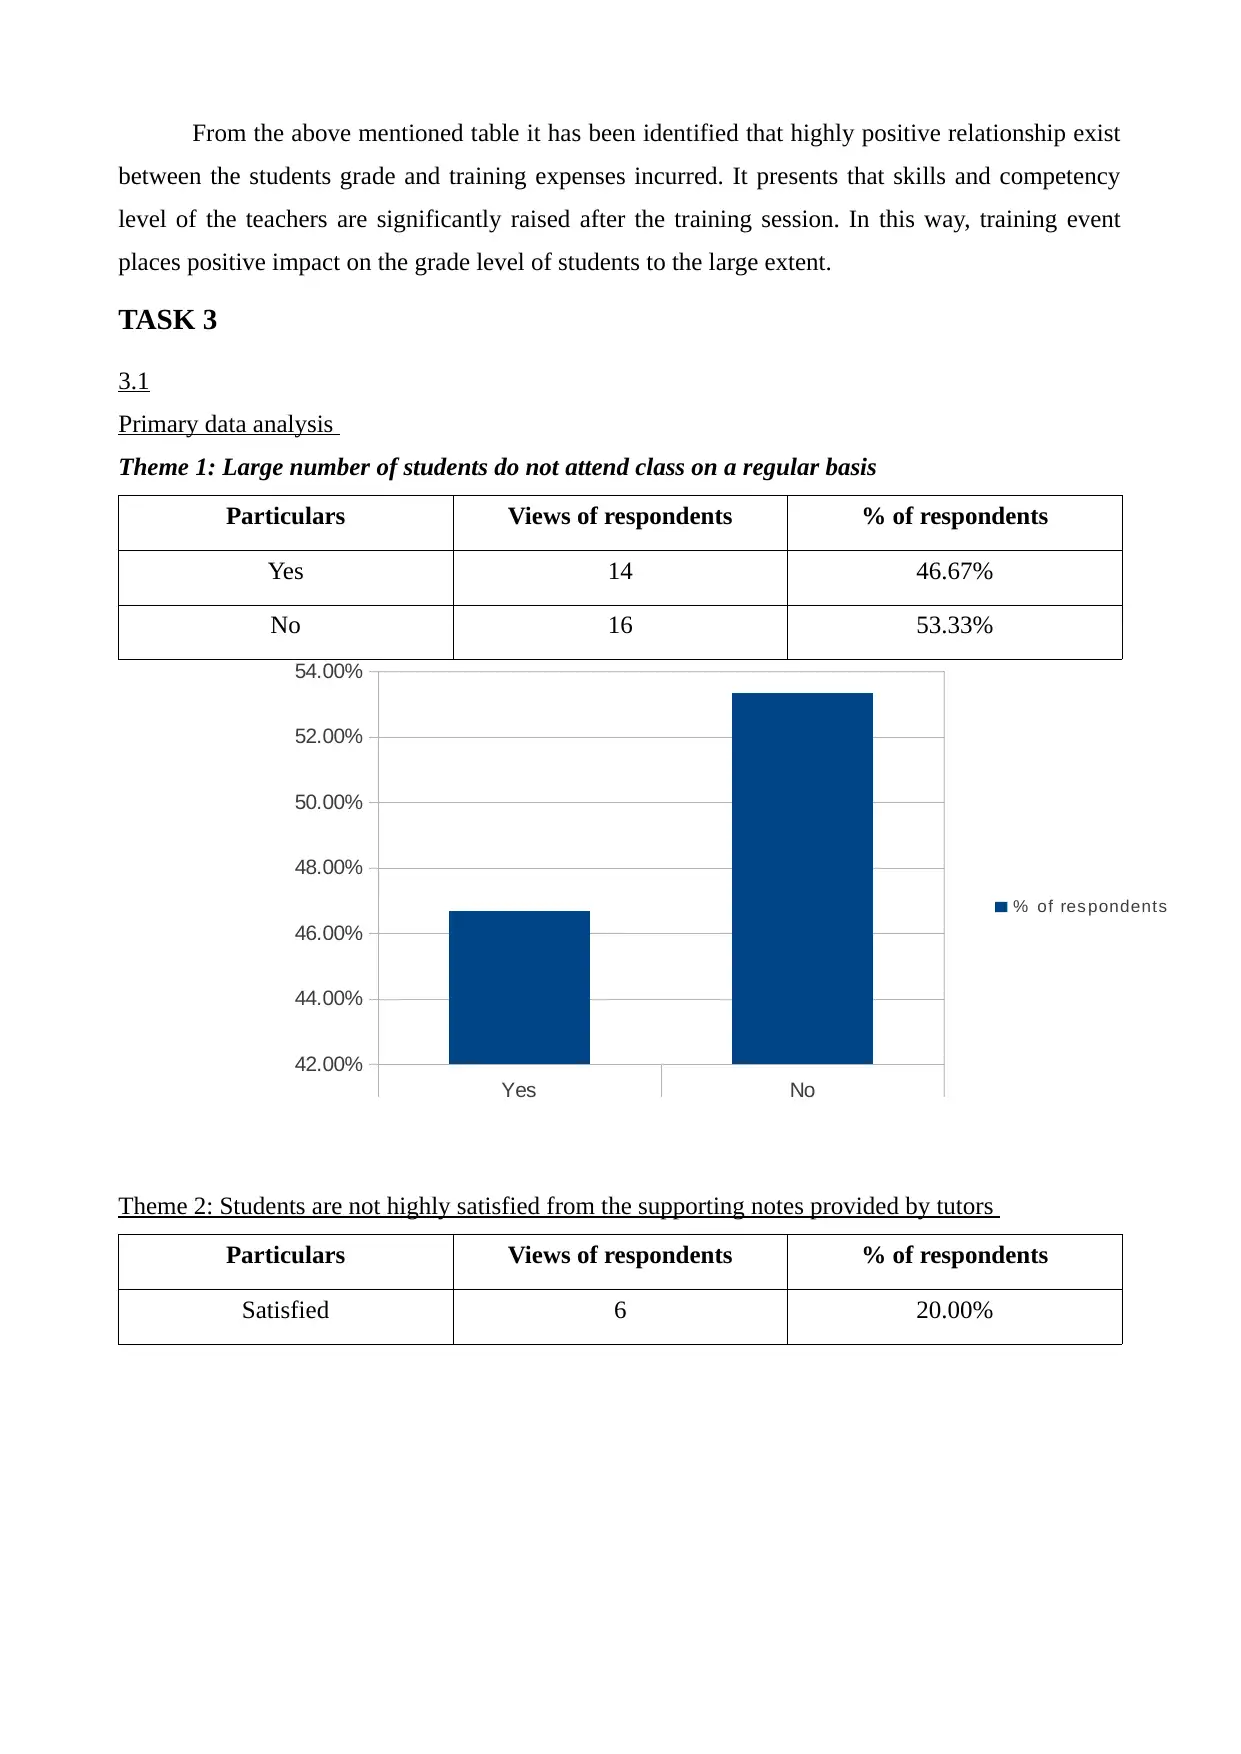
From the above mentioned table it has been identified that highly positive relationship exist
between the students grade and training expenses incurred. It presents that skills and competency
level of the teachers are significantly raised after the training session. In this way, training event
places positive impact on the grade level of students to the large extent.
TASK 3
3.1
Primary data analysis
Theme 1: Large number of students do not attend class on a regular basis
Particulars Views of respondents % of respondents
Yes 14 46.67%
No 16 53.33%
Theme 2: Students are not highly satisfied from the supporting notes provided by tutors
Particulars Views of respondents % of respondents
Satisfied 6 20.00%
Yes No
42.00%
44.00%
46.00%
48.00%
50.00%
52.00%
54.00%
% of res pondents
⊘ This is a preview!⊘
Do you want full access?
Subscribe today to unlock all pages.
Trusted by 1+ million students worldwide
1 out of 22
Related Documents


Your All-in-One AI-Powered Toolkit for Academic Success.
+13062052269
info@desklib.com
Available 24*7 on WhatsApp / Email
![[object Object]](/_next/static/media/star-bottom.7253800d.svg)
Unlock your academic potential
Copyright © 2020–2026 A2Z Services. All Rights Reserved. Developed and managed by ZUCOL.