University Data Analysis: SPSS ANOVA and Chi-Square Assignment
VerifiedAdded on 2022/11/15
|11
|1248
|420
Homework Assignment
AI Summary
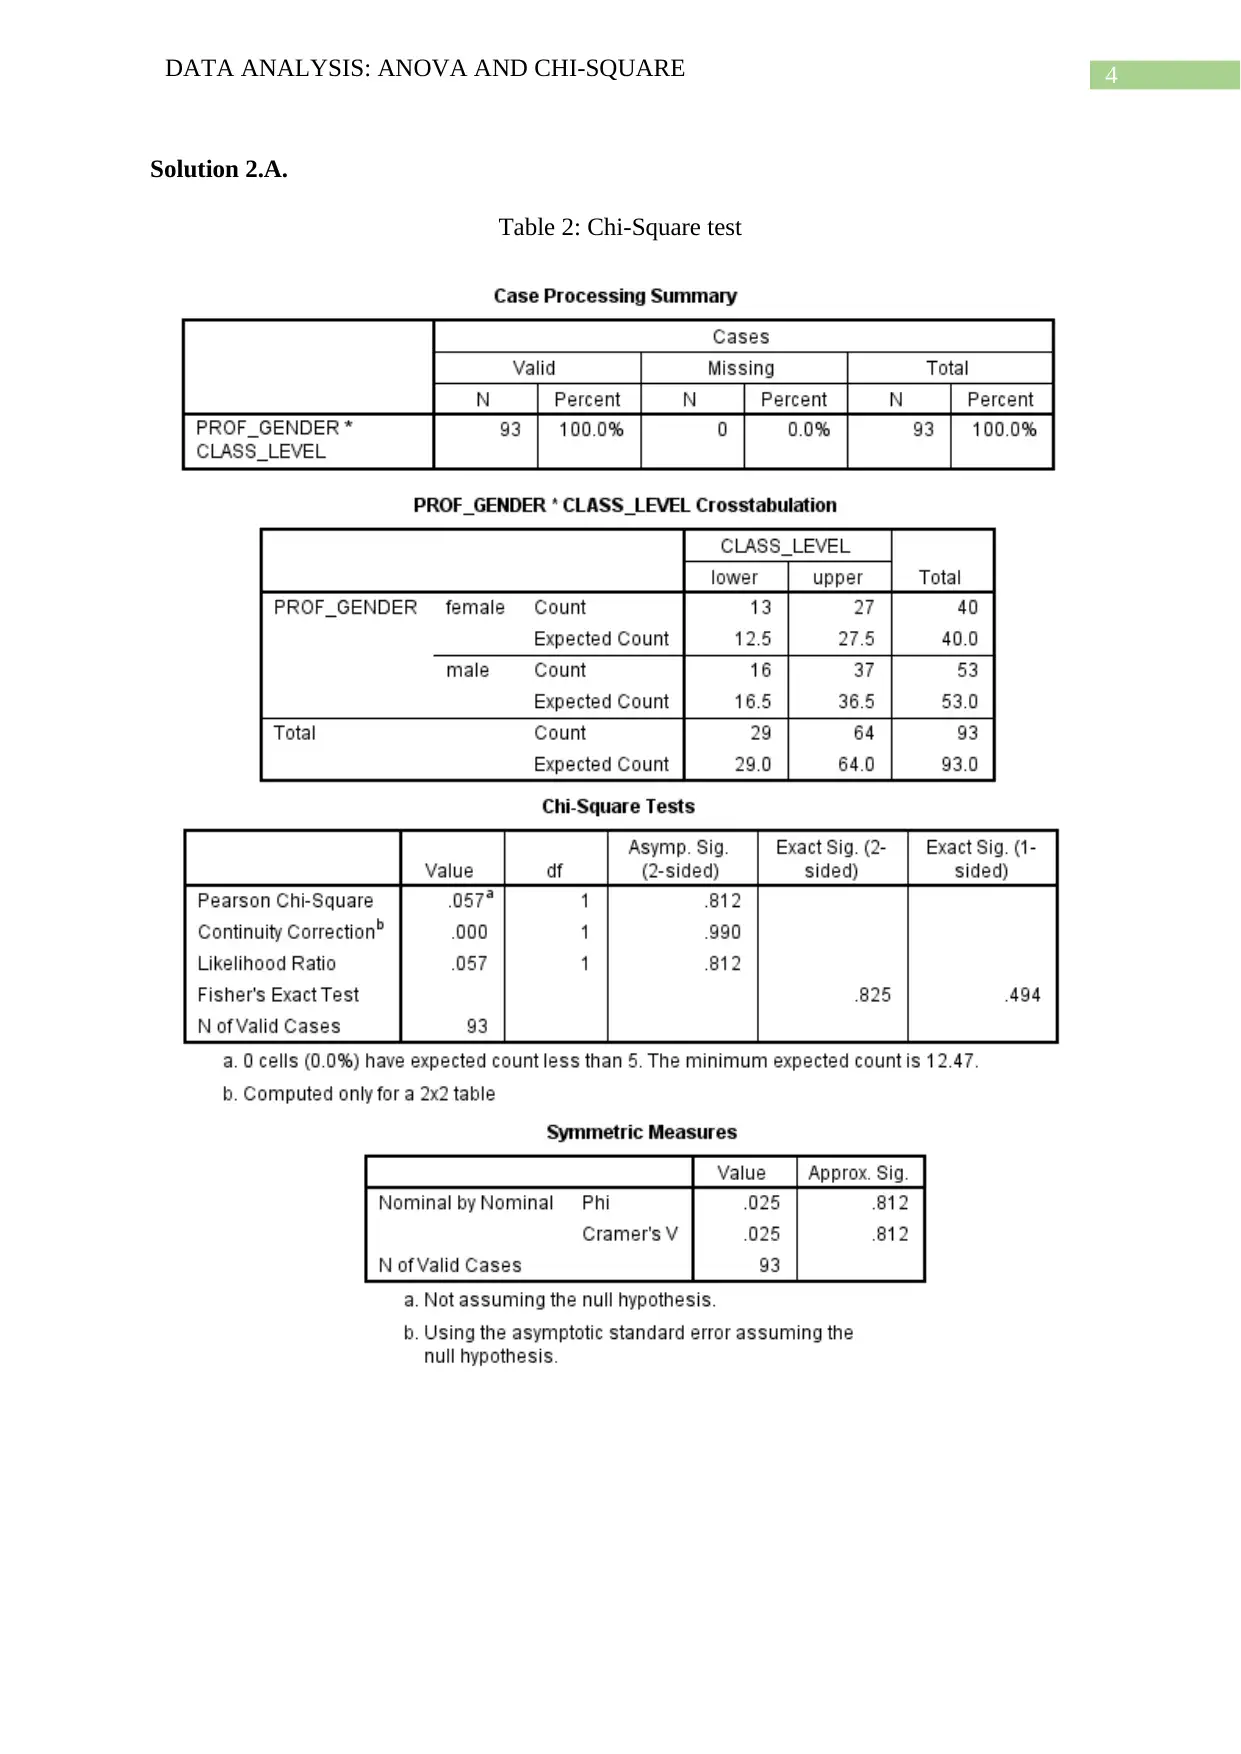
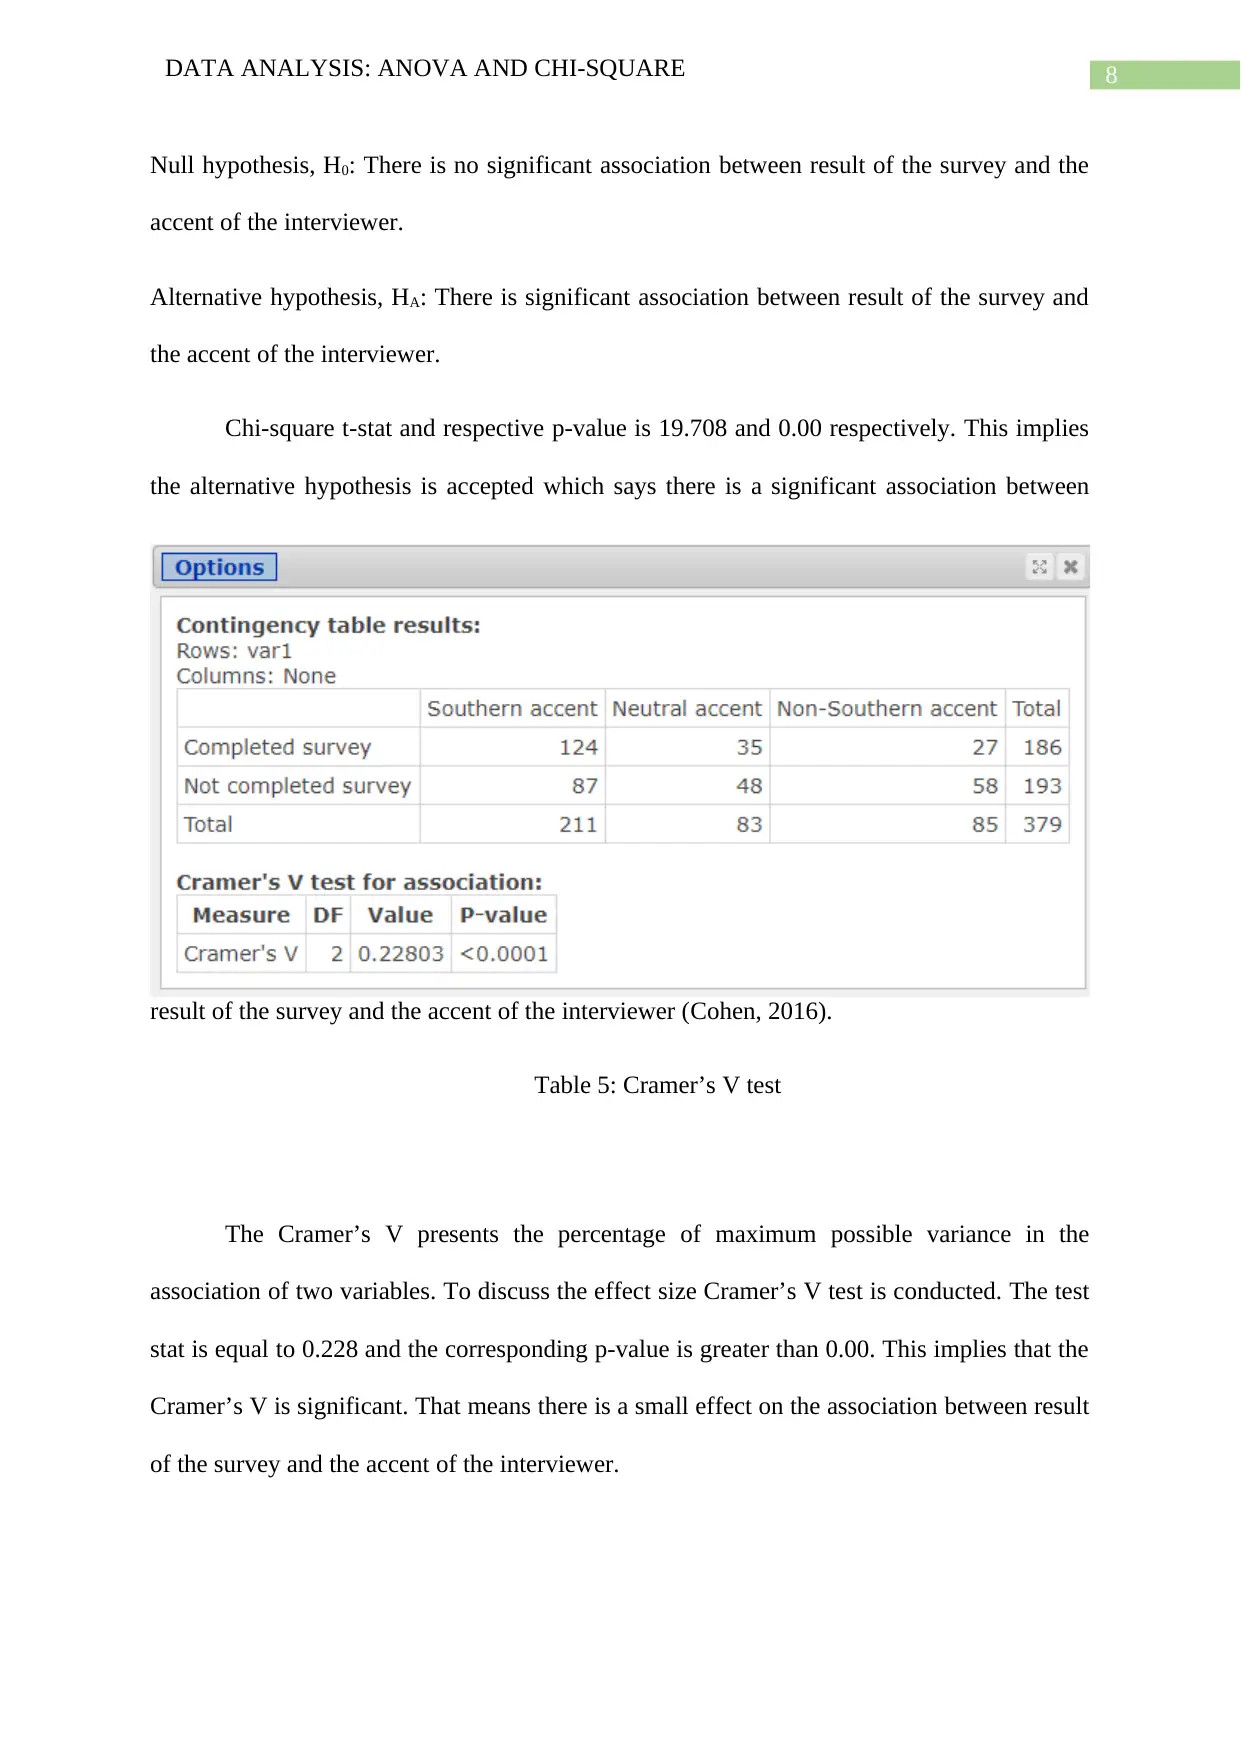
This document presents a comprehensive solution to a data analysis assignment focusing on ANOVA and Chi-square tests. The solution includes SPSS and StatCrunch outputs, hypothesis statements, test statistics, p-values, and effect size calculations. The ANOVA section analyzes the difference in the percentage of women on voyages across centuries, while the Chi-square section examines the association between the gender of college professors and course levels. The document also includes an ANOVA test to determine if there is a difference in mean test score based on the teaching method children received and a Chi-square test to determine if there is a significant association between the result of the survey and the accent of the interviewer. Cramer's V test is also conducted to discuss the effect size.

Running head: DATA ANALYSIS: ANOVA AND CHI-SQUARE
Data Analysis: ANOVA and Chi-Square
Name of the Student:
Name of the University:
Author Note:
Data Analysis: ANOVA and Chi-Square
Name of the Student:
Name of the University:
Author Note:
Paraphrase This Document
Need a fresh take? Get an instant paraphrase of this document with our AI Paraphraser

1DATA ANALYSIS: ANOVA AND CHI-SQUARE
Table of Contents
SPSS Assignment.......................................................................................................................2
Solution 1.A...........................................................................................................................2
Solution 1.B............................................................................................................................3
Solution 1.C............................................................................................................................3
Solution 2.A...........................................................................................................................4
Solution 2.B............................................................................................................................5
Stat Crunch Assignment.............................................................................................................6
Solution 1...............................................................................................................................6
Solution 2...............................................................................................................................7
Reference....................................................................................................................................9

2DATA ANALYSIS: ANOVA AND CHI-SQUARE
SPSS Assignment
Solution 1.A.
Table 1: ANOVA test
Hypothesis:
Null hypothesis, H0: The mean of the percent of women on voyages across centuries is not
statistically different from each other.
Alternative hypothesis, HA: The mean of the percent of women on voyages across centuries is
statistically different from each other.
Test Statistic and p-value:
From the ANOVA table presented in table 1, the test statistic is F-stat which is equal
to 44.011. The corresponding p-value of the F-stat is 0.000.
⊘ This is a preview!⊘
Do you want full access?
Subscribe today to unlock all pages.

Trusted by 1+ million students worldwide

3DATA ANALYSIS: ANOVA AND CHI-SQUARE
Decision Rule:
If the p-value of the test statistic is less than the given significance level then it
indicates that there is enough evidence to reject the null hypothesis and accept the alternative
hypothesis (Emerson, 2017).
In the table 1, the p-value of the F-stat is less than 0.05 which indicates to reject the
null hypothesis and accept the alternative hypothesis. This implies that the mean of the
percent of women on voyages across centuries is statistically different from each other.
Solution 1.B.
The table 1 presents the descriptive statistic of the percent of women on voyages
across the centuries. On an average 29.87% of the people on the voyage were women in the
16th century, 28.87% of the people on the voyage were women in the 17th century and 18.34%
of the people on the voyage were women in the 18th century.
Solution 1.C.
In table 1, the column partial eta squared is a measure of the effect size. The value of
the partial eta squared is 0.090. This indicates the proportion if the variance in the variable
called womrat1 (the percent of women on voyages) and the proportion of the variance is
explained by the variable centurydep. So, the variable centurydep can explain the 9% of
variance in the percent of women on voyages.
Paraphrase This Document
Need a fresh take? Get an instant paraphrase of this document with our AI Paraphraser

4DATA ANALYSIS: ANOVA AND CHI-SQUARE
Solution 2.A.
Table 2: Chi-Square test
Solution 2.A.
Table 2: Chi-Square test

5DATA ANALYSIS: ANOVA AND CHI-SQUARE
Hypothesis:
Null hypothesis, H0: There is no significant association between the gender of college
professor and the level of courses.
Alternative hypothesis, HA: There is a significant association between the gender of college
professor and the level of courses.
Test Statistic and p-value:
The test statistic for the test is Pearson chi-square which is 0.057. The corresponding
p-value of the statistic is 0.812.
Decision Rule:
If the p-value of the test statistic is less than the given significance level then it
indicates that there is enough evidence to reject the null hypothesis and accept the alternative
hypothesis.
In the table 2, the p-value of the test-stat is greater than 0.05 which indicates there is
not enough evidence to reject the null hypothesis. This implies that there is no significant
association between the gender of college professor and the level of courses (Aberson, 2019).
Solution 2.B.
The effect size in chi-square test is measured by Cramer’s V which is equal to 0.025
and the corresponding p-value is greater than 0.05. This implies that the Cramer’s V is not
significant. However, the V presents the percentage of maximum possible variance in the
association of two variables.
⊘ This is a preview!⊘
Do you want full access?
Subscribe today to unlock all pages.

Trusted by 1+ million students worldwide

6DATA ANALYSIS: ANOVA AND CHI-SQUARE
Stat Crunch Assignment
Solution 1
The ANOVA test is conducted to determine if there is a difference in mean test score
based on the teaching method children received.
Hypothesis:
Null hypothesis, H0: There is no significant difference among the means of test score based
on 3 teaching methods that children received.
Alternative hypothesis, HA: There is significant difference among the means of test score
based on 3 teaching methods that children received.
Table 3: ANOVA test
Paraphrase This Document
Need a fresh take? Get an instant paraphrase of this document with our AI Paraphraser

7DATA ANALYSIS: ANOVA AND CHI-SQUARE
Table 3 presents the F-stat for the ANOVA test which is 27.745 with p-value 0.0012.
This P-value less than 0.05 indicates that the F-stat is significant at 5% significance level
which provides enough evidence to reject the null hypothesis (Goos & Meintrup, 2016). The
test explains that there exists a significant difference among the means of test score based on
3 teaching methods that children received. Tukey HSD table present the mean difference for
each method with p- values. The mean difference between method1 and method3 has p-value
greater than 0.05 which means there is no significant difference between method1 and
method3. However, the difference between method1 and method2 is significant and the mean
difference of children’s score from method2 and method3 is significant. The upper and lower
bound tells about the variability of the mean difference. This means that the mean difference
ranges between lower bound and upper bound.
Solution 2.
Table 4: Chi-square test

8DATA ANALYSIS: ANOVA AND CHI-SQUARE
Null hypothesis, H0: There is no significant association between result of the survey and the
accent of the interviewer.
Alternative hypothesis, HA: There is significant association between result of the survey and
the accent of the interviewer.
Chi-square t-stat and respective p-value is 19.708 and 0.00 respectively. This implies
the alternative hypothesis is accepted which says there is a significant association between
result of the survey and the accent of the interviewer (Cohen, 2016).
Table 5: Cramer’s V test
The Cramer’s V presents the percentage of maximum possible variance in the
association of two variables. To discuss the effect size Cramer’s V test is conducted. The test
stat is equal to 0.228 and the corresponding p-value is greater than 0.00. This implies that the
Cramer’s V is significant. That means there is a small effect on the association between result
of the survey and the accent of the interviewer.
⊘ This is a preview!⊘
Do you want full access?
Subscribe today to unlock all pages.

Trusted by 1+ million students worldwide

9DATA ANALYSIS: ANOVA AND CHI-SQUARE
Paraphrase This Document
Need a fresh take? Get an instant paraphrase of this document with our AI Paraphraser

10DATA ANALYSIS: ANOVA AND CHI-SQUARE
Reference
Aberson, C. L. (2019). Applied power analysis for the behavioral sciences. Routledge.
Cohen, J. (2016). The earth is round (p<. 05). In What if there were no significance
tests? (pp. 69-82). Routledge.
Emerson, R. W. (2017). ANOVA and t-tests. Journal of Visual Impairment &
Blindness, 111(2), 193-196.
Goos, P., & Meintrup, D. (2016). Statistics with JMP: Hypothesis Tests, ANOVA and
Regression. John Wiley & Sons.
Morgan, S., Reichert, T., & Harrison, T. R. (2016). From numbers to words: Reporting
statistical results for the social sciences. Routledge.
Yatani, K. (2016). Effect sizes and power analysis in hci. In Modern Statistical Methods for
HCI (pp. 87-110). Springer, Cham.
1 out of 11
Related Documents

Your All-in-One AI-Powered Toolkit for Academic Success.
+13062052269
info@desklib.com
Available 24*7 on WhatsApp / Email
Unlock your academic potential
Copyright © 2020–2025 A2Z Services. All Rights Reserved. Developed and managed by ZUCOL.