Statistics for Behaviour Science Lab: ANOVA Test on Stress & Recall

Verified

Added on  2023/03/23

|4
|381
|69
Report
AI Summary
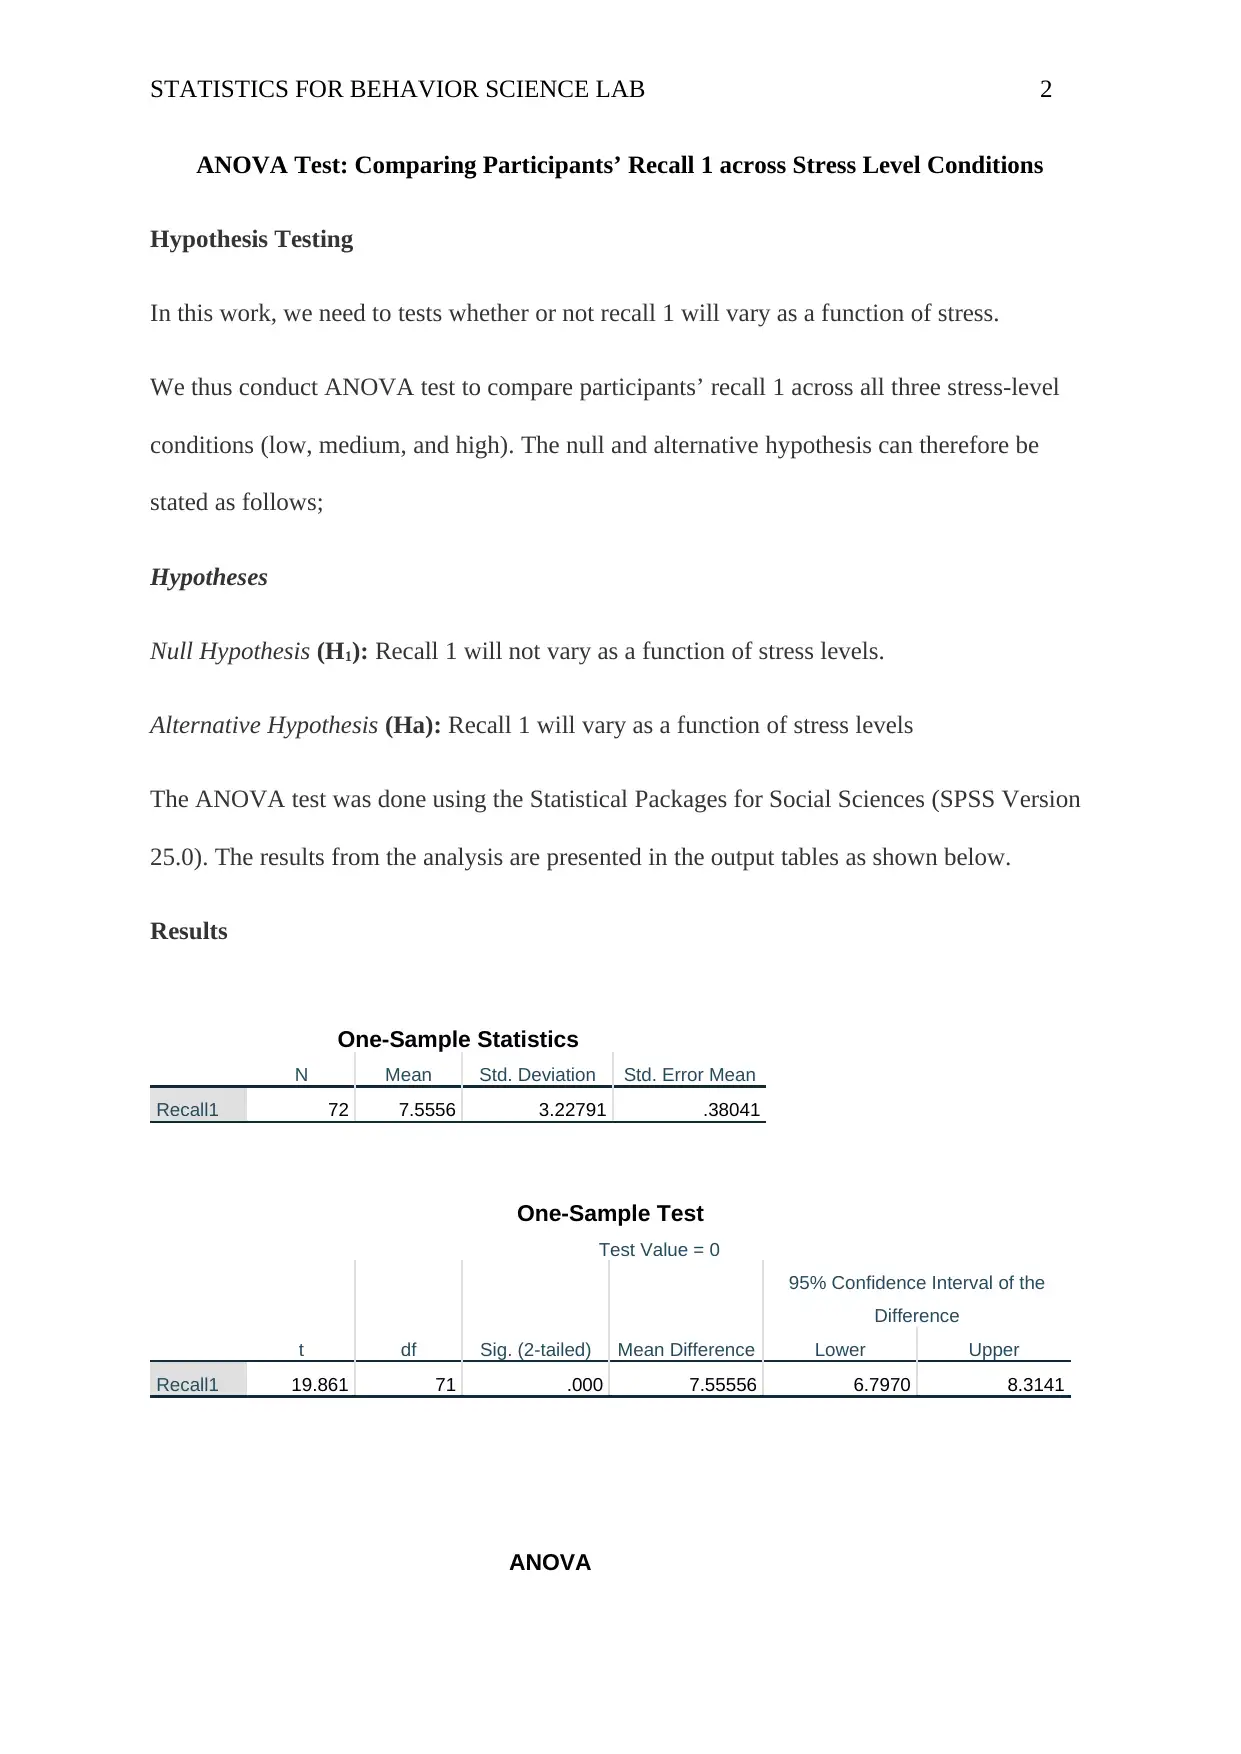
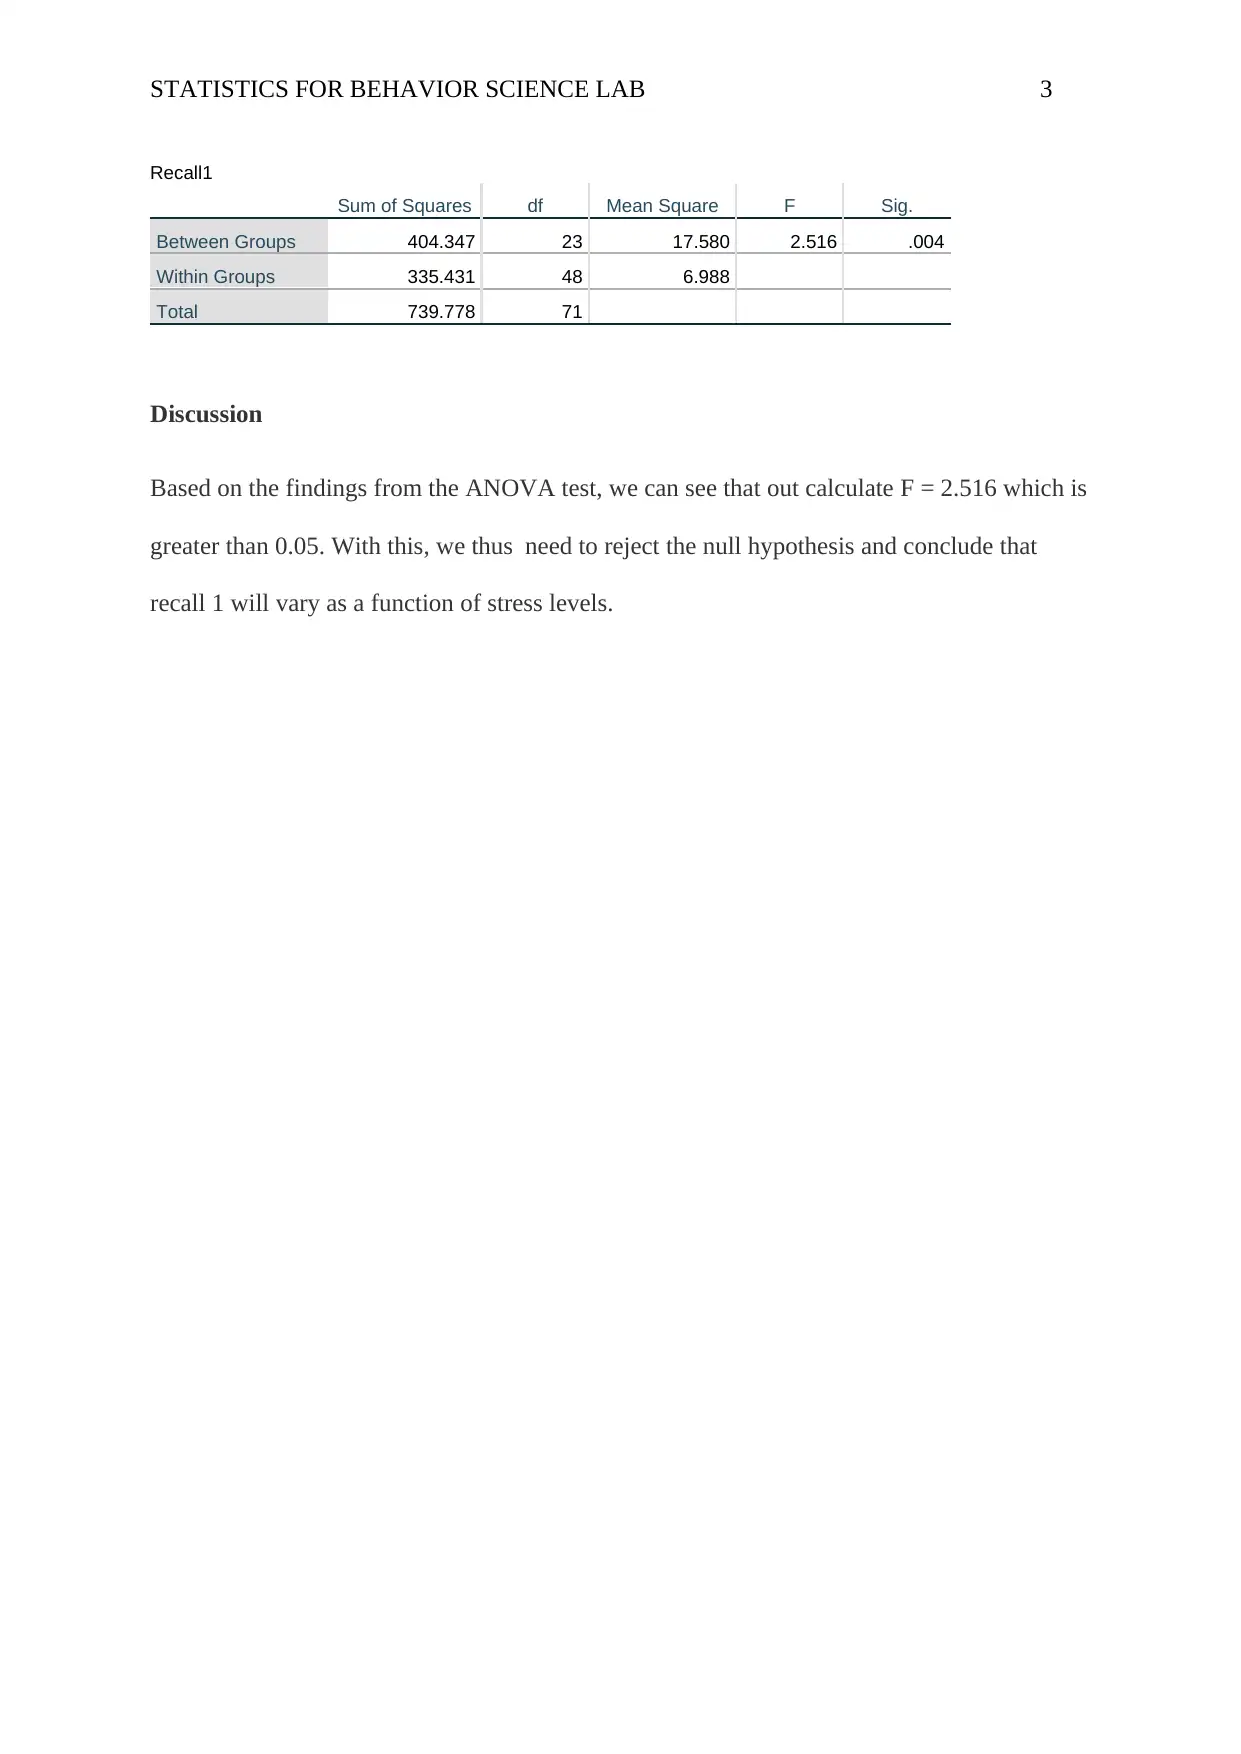
This report presents an ANOVA test conducted to determine if recall varies as a function of stress levels. The null hypothesis, stating that recall 1 will not vary based on stress, was tested against the alternative hypothesis, which posits that recall 1 will vary with stress levels. Using SPSS Version 25.0, data from 72 participants was analyzed. The findings revealed a calculated F-value of 2.516, exceeding 0.05, leading to the rejection of the null hypothesis. The report concludes that recall 1 does indeed vary as a function of stress levels. References to relevant research on ANOVA and model comparison are also included. Desklib provides this document as part of its collection of solved assignments and study resources for students.
Document Page
Running head: STATISTICS FOR BEHAVIOR SCIENCE LAB 1
Statistics for Behaviour Science
By (Name of Student)
(Institutional Affiliation)
(Date of Submission)
tabler-icon-diamond-filled.svg

Paraphrase This Document

Need a fresh take? Get an instant paraphrase of this document with our AI Paraphraser
Document Page
STATISTICS FOR BEHAVIOR SCIENCE LAB 2
ANOVA Test: Comparing Participants’ Recall 1 across Stress Level Conditions
Hypothesis Testing
In this work, we need to tests whether or not recall 1 will vary as a function of stress.
We thus conduct ANOVA test to compare participants’ recall 1 across all three stress-level
conditions (low, medium, and high). The null and alternative hypothesis can therefore be
stated as follows;
Hypotheses
Null Hypothesis (H1): Recall 1 will not vary as a function of stress levels.
Alternative Hypothesis (Ha): Recall 1 will vary as a function of stress levels
The ANOVA test was done using the Statistical Packages for Social Sciences (SPSS Version
25.0). The results from the analysis are presented in the output tables as shown below.
Results
One-Sample Statistics
N Mean Std. Deviation Std. Error Mean
Recall1 72 7.5556 3.22791 .38041
One-Sample Test
Test Value = 0
t df Sig. (2-tailed) Mean Difference
95% Confidence Interval of the
Difference
Lower Upper
Recall1 19.861 71 .000 7.55556 6.7970 8.3141
ANOVA
Document Page
STATISTICS FOR BEHAVIOR SCIENCE LAB 3
Recall1
Sum of Squares df Mean Square F Sig.
Between Groups 404.347 23 17.580 2.516 .004
Within Groups 335.431 48 6.988
Total 739.778 71
Discussion
Based on the findings from the ANOVA test, we can see that out calculate F = 2.516 which is
greater than 0.05. With this, we thus need to reject the null hypothesis and conclude that
recall 1 will vary as a function of stress levels.
Document Page
STATISTICS FOR BEHAVIOR SCIENCE LAB 4
References
Boisgontier, M. P., & Cheval, B. (2016). The anova to mixed model transition. Neuroscience
& Biobehavioral Reviews, 68, 1004-1005.
Rouder, J. N., Engelhardt, C. R., McCabe, S., & Morey, R. D. (2016). Model comparison in
ANOVA. Psychonomic Bulletin & Review, 23(6), 1779-1786.
chevron_up_icon
1 out of 4
circle_padding
hide_on_mobile
zoom_out_icon
[object Object]