Corporate Finance Report: Antofagasta Plc. - Cost of Equity Analysis
VerifiedAdded on 2023/04/07
|13
|2896
|235
Report
AI Summary
This report provides a comprehensive financial analysis of Antofagasta Plc., a Chilean business listed on the London Stock Exchange. It begins by calculating the company's cost of equity using the Capital Asset Pricing Model (CAPM), justifying the data used, including risk-free rate, market return, and beta. The report then calculates the asset beta, explaining the significance of both equity and asset betas in assessing risk. Furthermore, it analyzes Antofagasta's dividend policy over the past five years, using ratios to assess its stability and relation to earnings. Finally, the report critically evaluates the suitability of the CAPM-derived cost of equity for investment appraisal, comparing it to the Dividend Growth Model and discussing their respective strengths and weaknesses for determining the cost of equity.
Running head: CORPORATE FINANCE
Corporate Finance
Name of the Student:
Name of the University:
Author’s Note:
Corporate Finance
Name of the Student:
Name of the University:
Author’s Note:
Paraphrase This Document
Need a fresh take? Get an instant paraphrase of this document with our AI Paraphraser

1CORPORATE FINANCE
Table of Contents
Introduction......................................................................................................................................2
Discussion........................................................................................................................................2
Cost of Equity..............................................................................................................................2
Equity Beta and Asset Beta.........................................................................................................4
Dividend Policy of Antofagasta Plc............................................................................................5
Evaluation of Cost of Equity.......................................................................................................6
Conclusion.......................................................................................................................................8
References........................................................................................................................................9
Appendix........................................................................................................................................11
2CORPORATE FINANCE
Introduction
Antofagasta Plc. is a Chilean Business that operates in the various sectors in an economy.
The company stands as one of the key conglomerate of Chile whereby the company is having a
major equity participation in Antofagasta Minerals. The company is listed in the London Stock
Exchange and is an important constituent of the FTSE 100 Index. The financial analysis of the
company was conducted thereby covering the various financials of the company. The cost of
equity for the company with the help of the CAPM Model, the equity beta and asset beta for the
company was evaluated. The dividend policy followed by the company in the last five period
was also taken into consideration. Asset Beta and Equity Beta are the two important risk factors
that should be taken into account for computing the various risks associated with a company and
the same was addressed for evaluating the equity and asset risk in contrast to the market. It is
important that there are various techniques and rules applied for evaluating the required rate of
return on equity and the same has been done by including the Dividend Growth Model for
determining the cost of equity1.
Discussion
Cost of Equity
The cost of equity shows the theoretically rate of return that is required by the equity
investors of a company for compensating the undertaken risk borne by investing their equity
capital2. Risk free rate of return, return generated on market index and the beta of the stocks are
some of the important perspective that will be taken into consideration for the purpose of
1 Pedersen, Niels, Sébastien Page, and Fei He. "Asset allocation: Risk models for alternative investments." Financial
Analysts Journal 70.3 (2014): 34-45.
2 Antoniou, Constantinos, John A. Doukas, and Avanidhar Subrahmanyam. "Investor sentiment, beta, and the cost of
equity capital." Management Science 62.2 (2015): 347-367.
⊘ This is a preview!⊘
Do you want full access?
Subscribe today to unlock all pages.
Trusted by 1+ million students worldwide
3CORPORATE FINANCE
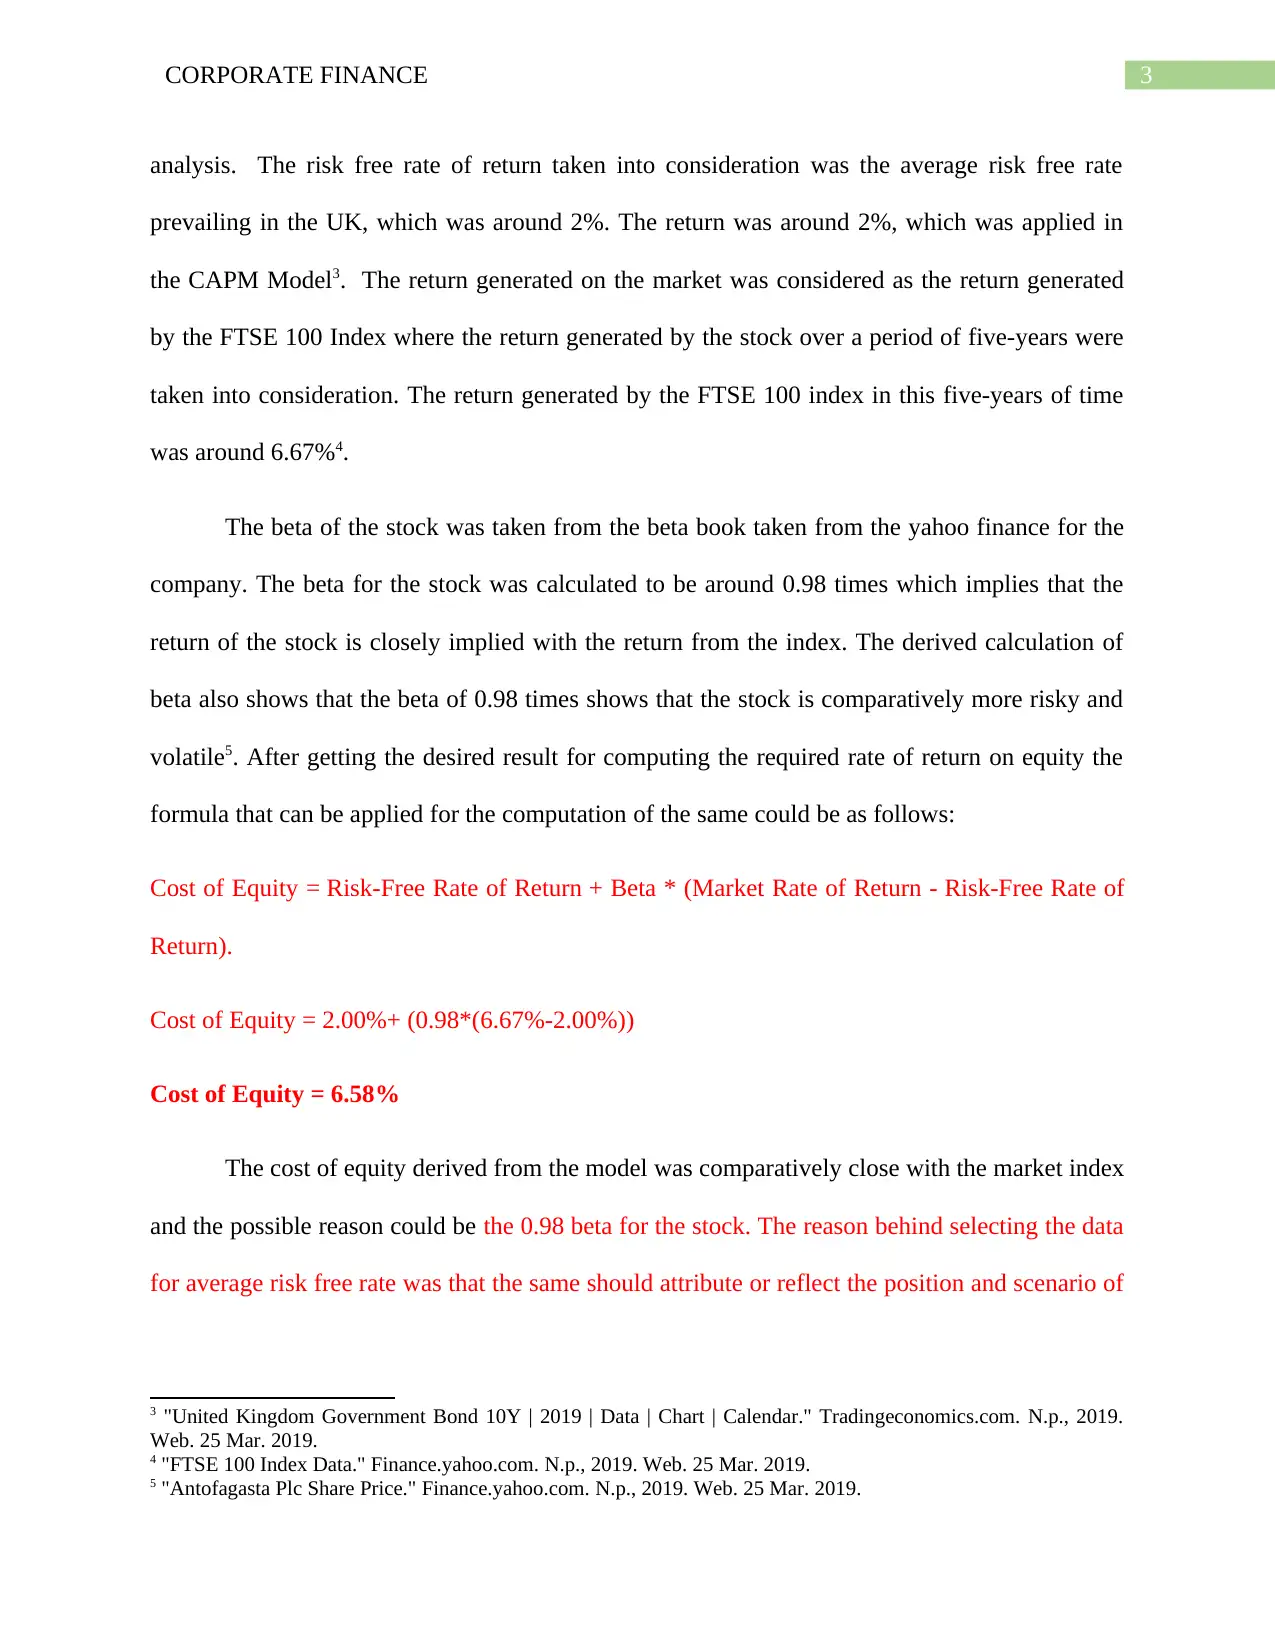
analysis. The risk free rate of return taken into consideration was the average risk free rate
prevailing in the UK, which was around 2%. The return was around 2%, which was applied in
the CAPM Model3. The return generated on the market was considered as the return generated
by the FTSE 100 Index where the return generated by the stock over a period of five-years were
taken into consideration. The return generated by the FTSE 100 index in this five-years of time
was around 6.67%4.
The beta of the stock was taken from the beta book taken from the yahoo finance for the
company. The beta for the stock was calculated to be around 0.98 times which implies that the
return of the stock is closely implied with the return from the index. The derived calculation of
beta also shows that the beta of 0.98 times shows that the stock is comparatively more risky and
volatile5. After getting the desired result for computing the required rate of return on equity the
formula that can be applied for the computation of the same could be as follows:
Cost of Equity = Risk-Free Rate of Return + Beta * (Market Rate of Return - Risk-Free Rate of
Return).
Cost of Equity = 2.00%+ (0.98*(6.67%-2.00%))
Cost of Equity = 6.58%
The cost of equity derived from the model was comparatively close with the market index
and the possible reason could be the 0.98 beta for the stock. The reason behind selecting the data
for average risk free rate was that the same should attribute or reflect the position and scenario of
3 "United Kingdom Government Bond 10Y | 2019 | Data | Chart | Calendar." Tradingeconomics.com. N.p., 2019.
Web. 25 Mar. 2019.
4 "FTSE 100 Index Data." Finance.yahoo.com. N.p., 2019. Web. 25 Mar. 2019.
5 "Antofagasta Plc Share Price." Finance.yahoo.com. N.p., 2019. Web. 25 Mar. 2019.
Paraphrase This Document
Need a fresh take? Get an instant paraphrase of this document with our AI Paraphraser
4CORPORATE FINANCE
the economy6. The return generated by the market index was taken for a sum of five years of
time frame where the relevant movement in the index was captured with help of the annual
return generated by the stock. The cost of equity derived above is an important measure for
evaluating the effectiveness and minimum return that is required by an investor for the capital
invested.
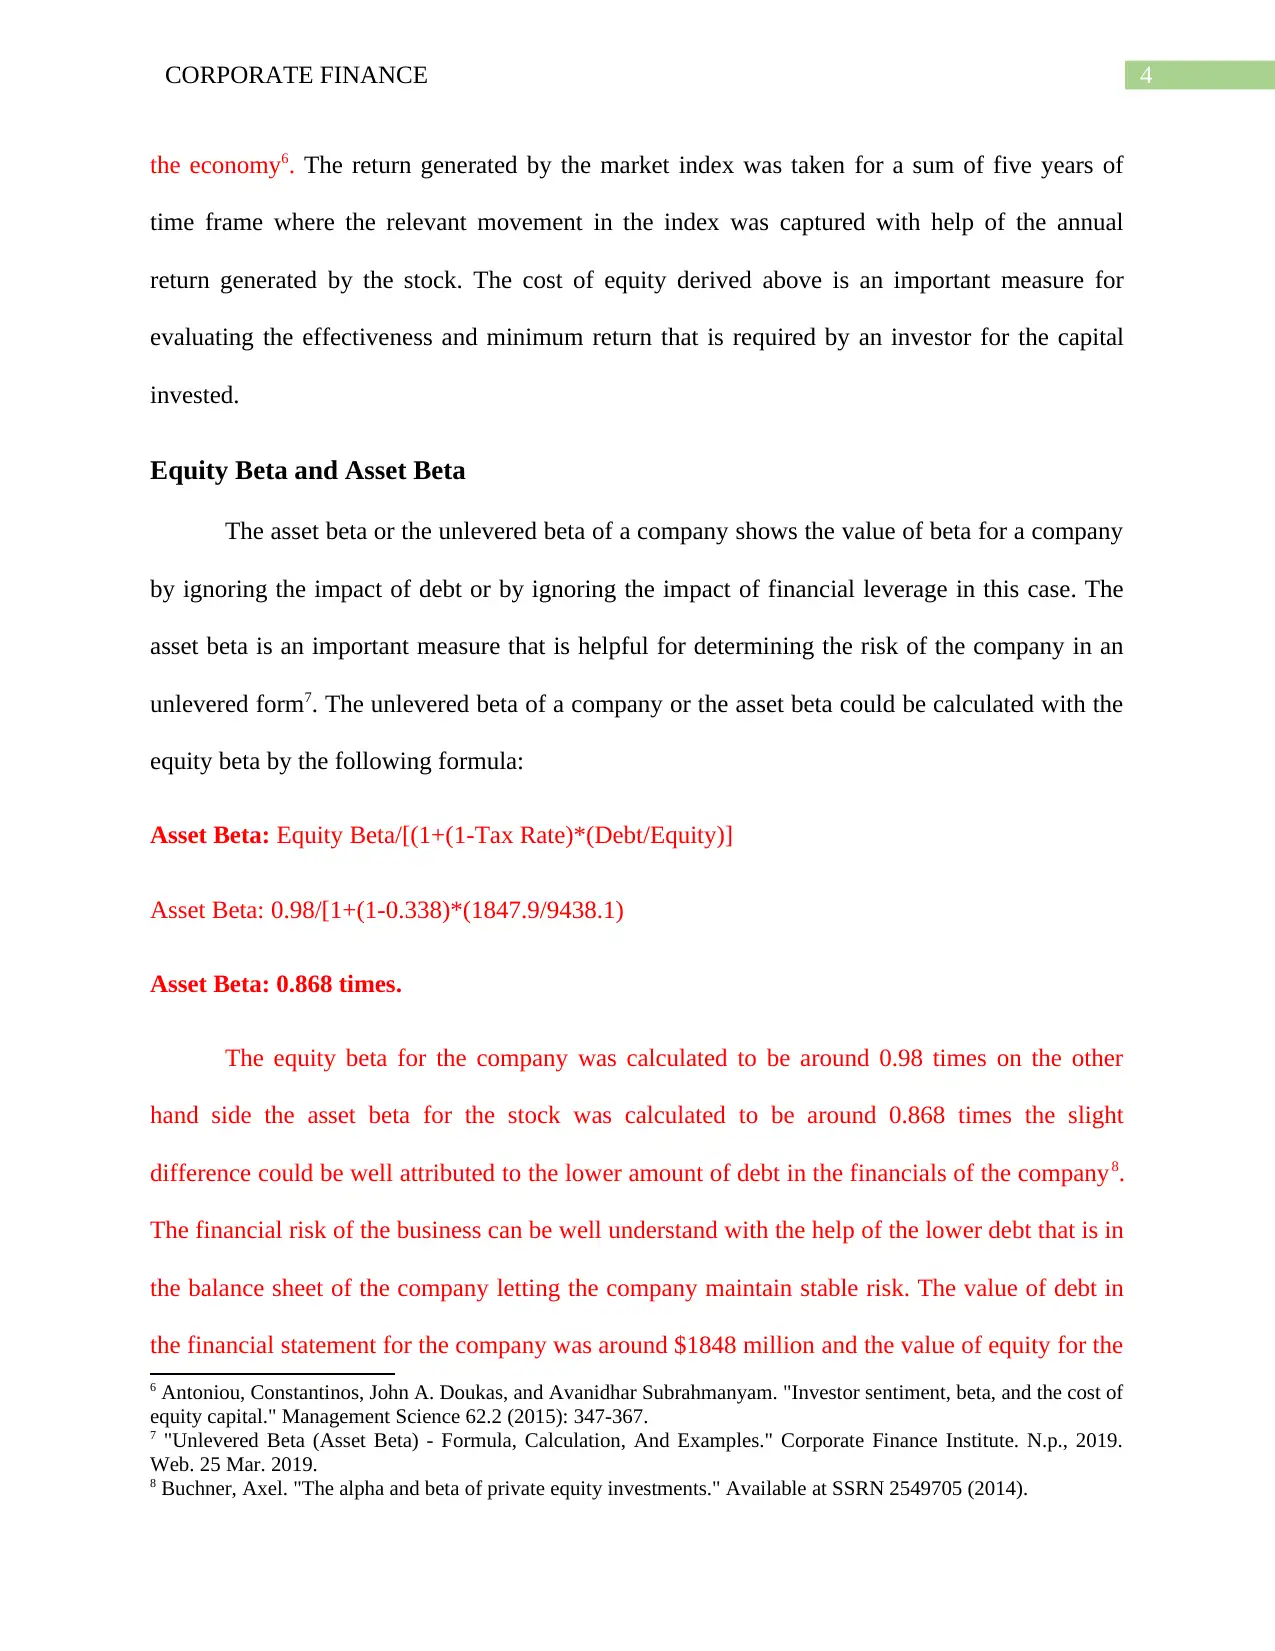
Equity Beta and Asset Beta
The asset beta or the unlevered beta of a company shows the value of beta for a company
by ignoring the impact of debt or by ignoring the impact of financial leverage in this case. The
asset beta is an important measure that is helpful for determining the risk of the company in an
unlevered form7. The unlevered beta of a company or the asset beta could be calculated with the
equity beta by the following formula:
Asset Beta: Equity Beta/[(1+(1-Tax Rate)*(Debt/Equity)]
Asset Beta: 0.98/[1+(1-0.338)*(1847.9/9438.1)
Asset Beta: 0.868 times.
The equity beta for the company was calculated to be around 0.98 times on the other
hand side the asset beta for the stock was calculated to be around 0.868 times the slight
difference could be well attributed to the lower amount of debt in the financials of the company8.
The financial risk of the business can be well understand with the help of the lower debt that is in
the balance sheet of the company letting the company maintain stable risk. The value of debt in
the financial statement for the company was around $1848 million and the value of equity for the
6 Antoniou, Constantinos, John A. Doukas, and Avanidhar Subrahmanyam. "Investor sentiment, beta, and the cost of
equity capital." Management Science 62.2 (2015): 347-367.
7 "Unlevered Beta (Asset Beta) - Formula, Calculation, And Examples." Corporate Finance Institute. N.p., 2019.
Web. 25 Mar. 2019.
8 Buchner, Axel. "The alpha and beta of private equity investments." Available at SSRN 2549705 (2014).
the economy6. The return generated by the market index was taken for a sum of five years of
time frame where the relevant movement in the index was captured with help of the annual
return generated by the stock. The cost of equity derived above is an important measure for
evaluating the effectiveness and minimum return that is required by an investor for the capital
invested.
Equity Beta and Asset Beta
The asset beta or the unlevered beta of a company shows the value of beta for a company
by ignoring the impact of debt or by ignoring the impact of financial leverage in this case. The
asset beta is an important measure that is helpful for determining the risk of the company in an
unlevered form7. The unlevered beta of a company or the asset beta could be calculated with the
equity beta by the following formula:
Asset Beta: Equity Beta/[(1+(1-Tax Rate)*(Debt/Equity)]
Asset Beta: 0.98/[1+(1-0.338)*(1847.9/9438.1)
Asset Beta: 0.868 times.
The equity beta for the company was calculated to be around 0.98 times on the other
hand side the asset beta for the stock was calculated to be around 0.868 times the slight
difference could be well attributed to the lower amount of debt in the financials of the company8.
The financial risk of the business can be well understand with the help of the lower debt that is in
the balance sheet of the company letting the company maintain stable risk. The value of debt in
the financial statement for the company was around $1848 million and the value of equity for the
6 Antoniou, Constantinos, John A. Doukas, and Avanidhar Subrahmanyam. "Investor sentiment, beta, and the cost of
equity capital." Management Science 62.2 (2015): 347-367.
7 "Unlevered Beta (Asset Beta) - Formula, Calculation, And Examples." Corporate Finance Institute. N.p., 2019.
Web. 25 Mar. 2019.
8 Buchner, Axel. "The alpha and beta of private equity investments." Available at SSRN 2549705 (2014).
5CORPORATE FINANCE
company was around $9438 for the company. The business risk of the company can be well
understood with the help of the associated business factors like the competition evolving in the
industry, cost factor associated and the revenue for the company which has fallen from the last
year. It is essential that the company must keep the financial risk of the company at a very low
level so that on a overall basis the higher debt does not affect the financial performance and
position of the company. The debt to equity ratio for the company was around 0.19 or 19% that
shows that the company might be using equity and retained earnings as the prime source of
investment. The lower amount of financial leverage was the key reason reflecting the minute
impact in the asset beta of the company. On the one hand side the equity beta of a stock shows
the volatility generated by the stock by taking the market returns and the return generated by the
stock. In the above case as analysed if the beta of the stock is around 0.98 times it reflects that if
the market moves by around 1% then the stock would be moving around by 0.98 times reflecting
high correlation between these two. On the other hand the asset beta of the company shows the
potential impact of the debt on the financial position of the company and how will the change in
the capital structure of the company or the debt financing impact the overall asset beta of the
company.
Dividend Policy of Antofagasta Plc.
The dividend policy of company shows the set of guideline of a company reflecting the
decision of the company in paying of the amount of profits of the company in the form of
dividend to the equity shareholders of the company. The same is important for the perspective of
the analysis reflecting the internal source of funding that is used by the company. The dividend
policy of a company could be well depicted with the help of various policies like the stable
dividend policy, constant dividend policy and the residual dividend policy. The dividends paid
⊘ This is a preview!⊘
Do you want full access?
Subscribe today to unlock all pages.
Trusted by 1+ million students worldwide
6CORPORATE FINANCE
by the company can be well related with the above policies in order to find out the strategy
followed by the company. While, paying out the dividend growth prospects of the company and
the approach of the management towards, future growth can be well explained with the help of
the above policies9.
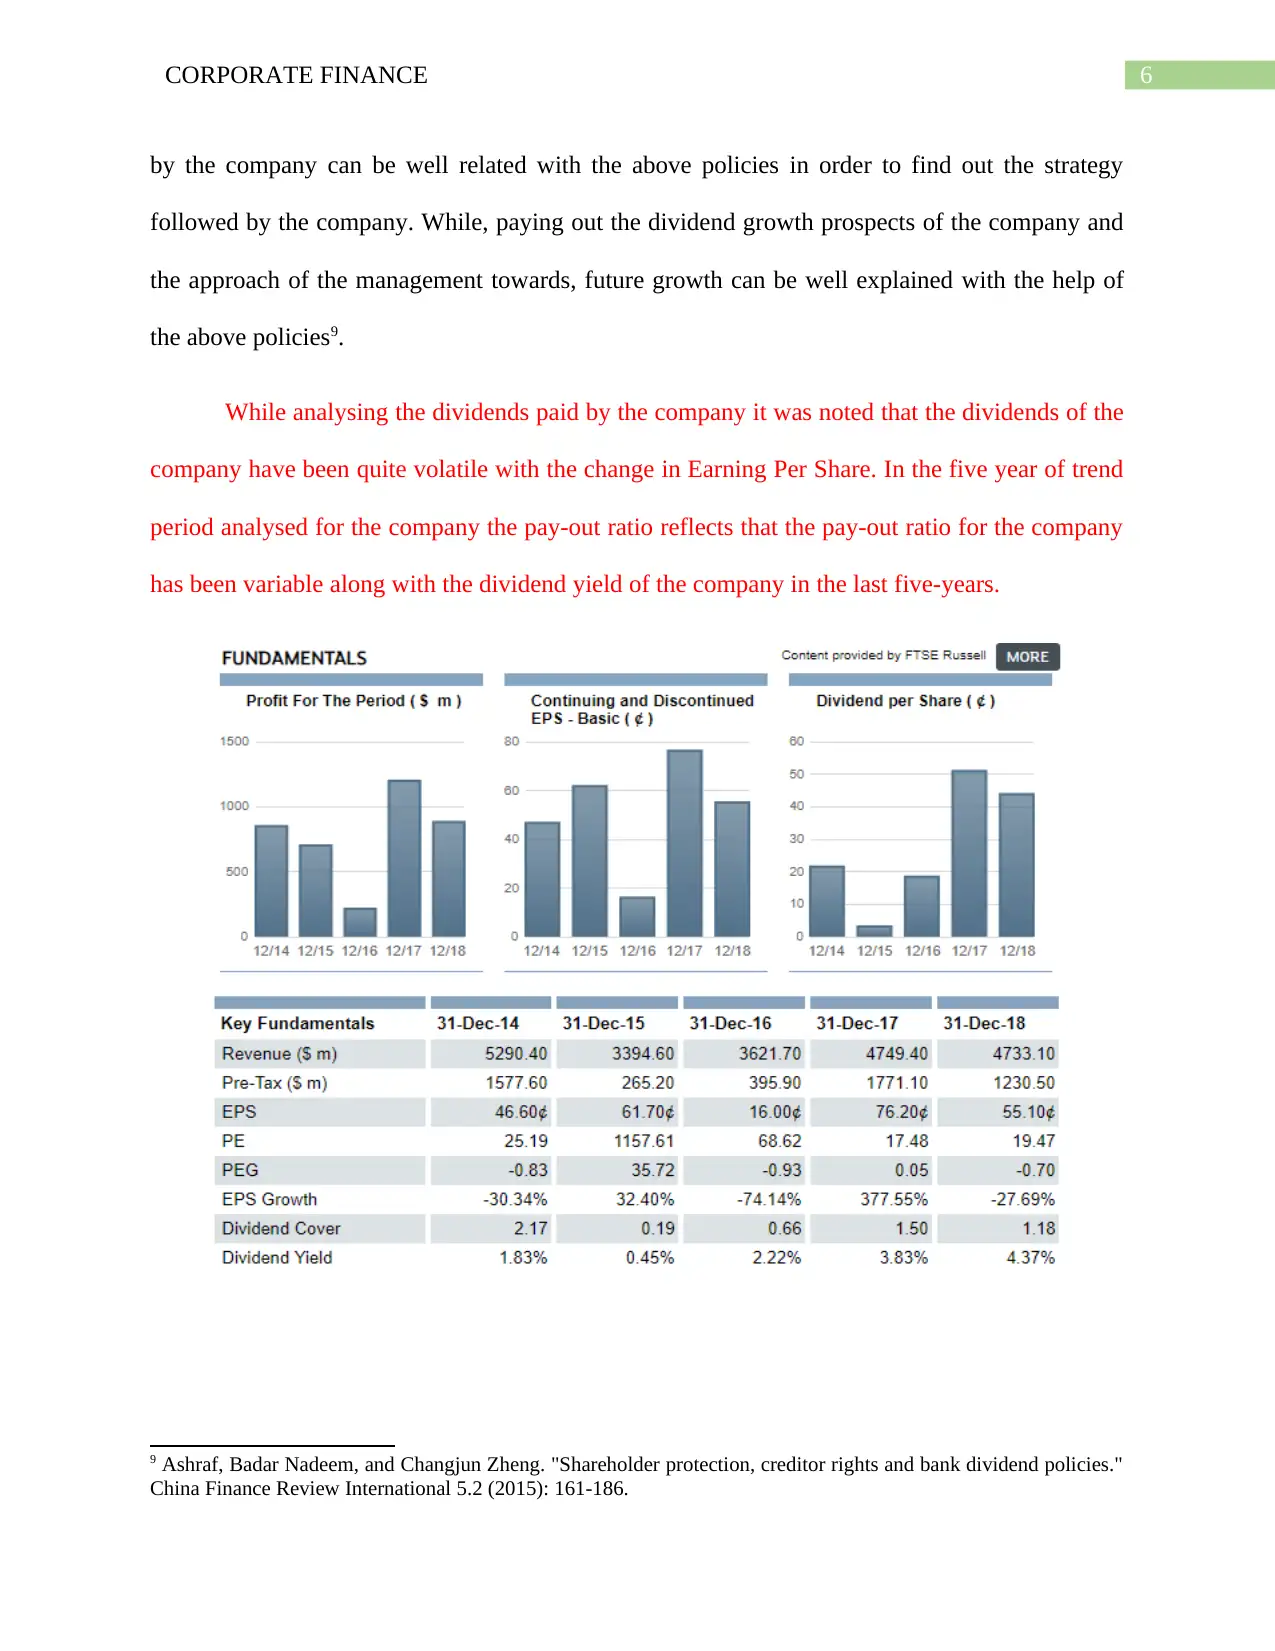
While analysing the dividends paid by the company it was noted that the dividends of the
company have been quite volatile with the change in Earning Per Share. In the five year of trend
period analysed for the company the pay-out ratio reflects that the pay-out ratio for the company
has been variable along with the dividend yield of the company in the last five-years.
9 Ashraf, Badar Nadeem, and Changjun Zheng. "Shareholder protection, creditor rights and bank dividend policies."
China Finance Review International 5.2 (2015): 161-186.
by the company can be well related with the above policies in order to find out the strategy
followed by the company. While, paying out the dividend growth prospects of the company and
the approach of the management towards, future growth can be well explained with the help of
the above policies9.
While analysing the dividends paid by the company it was noted that the dividends of the
company have been quite volatile with the change in Earning Per Share. In the five year of trend
period analysed for the company the pay-out ratio reflects that the pay-out ratio for the company
has been variable along with the dividend yield of the company in the last five-years.
9 Ashraf, Badar Nadeem, and Changjun Zheng. "Shareholder protection, creditor rights and bank dividend policies."
China Finance Review International 5.2 (2015): 161-186.
Paraphrase This Document
Need a fresh take? Get an instant paraphrase of this document with our AI Paraphraser
7CORPORATE FINANCE
The dividend policy of the company has been volatile and the dividend p\yield generated by the
company on the stock has varied significantly in the last five-years. As observed the dividends
for a company may increase even if there is a decline observed in the earnings of the company.
The dividends of the company may not increase at a constant speed and the same might
also would not increase as the growth of earnings also. The above two points are the key and
crucial distinctive feature matches with the stable dividend policy. While paying out the
dividends of a company it is important to consider various business factors and macro-economic
factors reflecting the growth potential and the ability of the company in paying of a stable
dividend policy. If the level of operations and the belief by the management of the company is
high growth perspective than a higher dividend pay-out ratio could be well followed10.
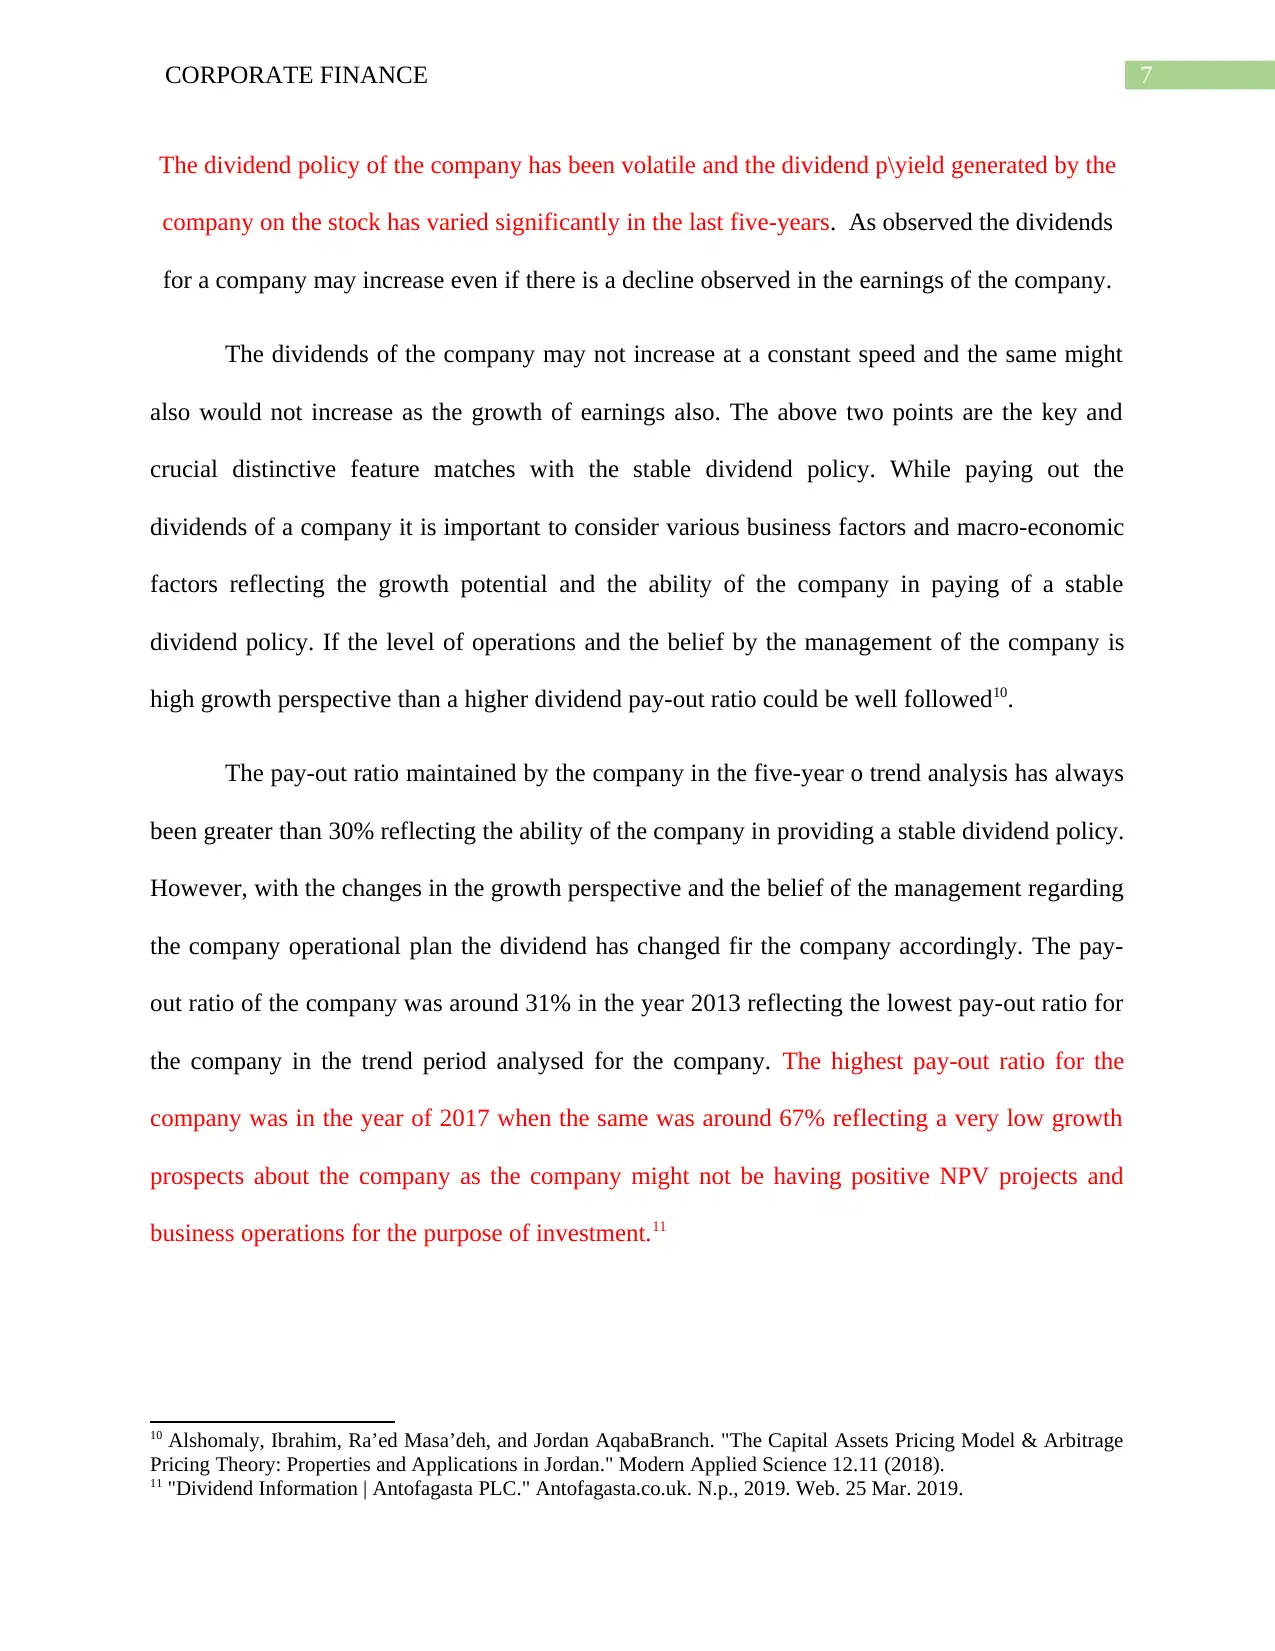
The pay-out ratio maintained by the company in the five-year o trend analysis has always
been greater than 30% reflecting the ability of the company in providing a stable dividend policy.
However, with the changes in the growth perspective and the belief of the management regarding
the company operational plan the dividend has changed fir the company accordingly. The pay-
out ratio of the company was around 31% in the year 2013 reflecting the lowest pay-out ratio for
the company in the trend period analysed for the company. The highest pay-out ratio for the
company was in the year of 2017 when the same was around 67% reflecting a very low growth
prospects about the company as the company might not be having positive NPV projects and
business operations for the purpose of investment.11
10 Alshomaly, Ibrahim, Ra’ed Masa’deh, and Jordan AqabaBranch. "The Capital Assets Pricing Model & Arbitrage
Pricing Theory: Properties and Applications in Jordan." Modern Applied Science 12.11 (2018).
11 "Dividend Information | Antofagasta PLC." Antofagasta.co.uk. N.p., 2019. Web. 25 Mar. 2019.
The dividend policy of the company has been volatile and the dividend p\yield generated by the
company on the stock has varied significantly in the last five-years. As observed the dividends
for a company may increase even if there is a decline observed in the earnings of the company.
The dividends of the company may not increase at a constant speed and the same might
also would not increase as the growth of earnings also. The above two points are the key and
crucial distinctive feature matches with the stable dividend policy. While paying out the
dividends of a company it is important to consider various business factors and macro-economic
factors reflecting the growth potential and the ability of the company in paying of a stable
dividend policy. If the level of operations and the belief by the management of the company is
high growth perspective than a higher dividend pay-out ratio could be well followed10.
The pay-out ratio maintained by the company in the five-year o trend analysis has always
been greater than 30% reflecting the ability of the company in providing a stable dividend policy.
However, with the changes in the growth perspective and the belief of the management regarding
the company operational plan the dividend has changed fir the company accordingly. The pay-
out ratio of the company was around 31% in the year 2013 reflecting the lowest pay-out ratio for
the company in the trend period analysed for the company. The highest pay-out ratio for the
company was in the year of 2017 when the same was around 67% reflecting a very low growth
prospects about the company as the company might not be having positive NPV projects and
business operations for the purpose of investment.11
10 Alshomaly, Ibrahim, Ra’ed Masa’deh, and Jordan AqabaBranch. "The Capital Assets Pricing Model & Arbitrage
Pricing Theory: Properties and Applications in Jordan." Modern Applied Science 12.11 (2018).
11 "Dividend Information | Antofagasta PLC." Antofagasta.co.uk. N.p., 2019. Web. 25 Mar. 2019.
8CORPORATE FINANCE
Evaluation of Cost of Equity
The cost of equity for a company could be well evaluated with the help of various
valuation techniques like by applying the Divided Growth Model or the Capital Asset Pricing
Model. In the case of the Capital Asset Pricing Model the value of equity is calculated with the
help of the factors like the prevailing risk free rate in the economy12. The market risk premium
that can be well calculated with the help of the return generated by market stocks less risk free
rate13. The beta of the stock could be calculated by observing the return given by both the stock
and index. However on the other hand side the Dividend growth model takes various factors on
the basis of assumption like the growth rate of the dividend and the current share price of the
company, which again is based on various market scenario and factors. It is important that the
cost of equity used for analysing the investment project should be such so that the same reflects
the potential return required for taking a certain amount of risk. The growth factors are the main
and important assumption that will be taken into account for the calculation of the required
return from the perspective of the dividend discount model. It is on the forecast and assumption
that varied growth rates can be taken according to the growth and increase in the operations of
the company14. Both the model has its own factors that are taken into account while making the
assumption regarding the input factors included in the model for computation of the required rate
of return on equity. However accuracy and sustainable input factors reflecting the risk associated
12Frazzini, Andrea, and Lasse Heje Pedersen. "Betting against beta." Journal of Financial Economics 111.1 (2014):
1-25.
13 Nhleko, A. S., and C. Musingwini. "Estimating cost of equity in project discount rates using the capital asset
pricing model and Gordon’s wealth growth model." International Journal of Mining, Reclamation and Environment
30.5 (2016): 390-404.
14Lawson, Bradley P., and Dechun Wang. "The earnings quality information content of dividend policies and audit
pricing." Contemporary Accounting Research 33.4 (2016): 1685-1719.
⊘ This is a preview!⊘
Do you want full access?
Subscribe today to unlock all pages.
Trusted by 1+ million students worldwide
9CORPORATE FINANCE
with the company should be taken into account for the purpose of computation of the required
rate of return on equity15.
The key factor in taking the required rate of return via the CAPM model is the selection
of the proper benchmark with which the return of the stock will be regressed with the benchmark
index for getting the beta of the stock. The beta is an important tool in the computation of the
required rate of return for the stock. On the other hand required rate of return via the Gordon
growth model is far more justified in this case where the prevailing share price, dividends paid
by the company and the growth rate would be taken for the purpose of analysis.
Conclusion
The financial valuation of the company was done by taking the financial data of the
company from the year 2013-2018. The dividend discount model and the Capital Asset Pricing
Model was done for valuing the required return by the equity investors. Asset Beta and Equity
beta are the two important components playing an important role in the organisation with the
help of the debt and equity ratio of the company. It was evaluated that the risks and return plays
an important role from the perspective of investment so there should be necessary factors and
conditions that should be taken into account while doing the financial valuation of the company.
On an overall basis the risk associated with the company was found to be comparatively low
when the same was compared with the context of the FTSE 100 index. The moderate volatility
beta stock can be considered a good and sound investment plan as stock can be used in portfolio
for creating value.
15 Firth, Michael, et al. "Institutional stock ownership and firms’ cash dividend policies: Evidence from China."
Journal of Banking & Finance 65 (2016): 91-107.
Paraphrase This Document
Need a fresh take? Get an instant paraphrase of this document with our AI Paraphraser
10CORPORATE FINANCE
References
1. Pedersen, Niels, Sébastien Page, and Fei He. "Asset allocation: Risk models for
alternative investments." Financial Analysts Journal 70.3 (2014): 34-45.
2. Antoniou, Constantinos, John A. Doukas, and Avanidhar Subrahmanyam. "Investor
sentiment, beta, and the cost of equity capital." Management Science 62.2 (2015): 347-
367.
3. "United Kingdom Government Bond 10Y | 2019 | Data | Chart | Calendar."
Tradingeconomics.com. N.p., 2019. Web. 25 Mar. 2019.
4. "FTSE 100 Index Data." Finance.yahoo.com. N.p., 2019. Web. 25 Mar. 2019.
5. "Antofagasta Plc Share Price." Finance.yahoo.com. N.p., 2019. Web. 25 Mar. 2019.
6. Antoniou, Constantinos, John A. Doukas, and Avanidhar Subrahmanyam. "Investor
sentiment, beta, and the cost of equity capital." Management Science 62.2 (2015): 347-
367.
7. "Unlevered Beta (Asset Beta) - Formula, Calculation, And Examples." Corporate Finance
Institute. N.p., 2019. Web. 25 Mar. 2019.
8. Buchner, Axel. "The alpha and beta of private equity investments." Available at SSRN
2549705 (2014).
9. Ashraf, Badar Nadeem, and Changjun Zheng. "Shareholder protection, creditor rights and
bank dividend policies." China Finance Review International 5.2 (2015): 161-186.
10. Alshomaly, Ibrahim, Ra’ed Masa’deh, and Jordan AqabaBranch. "The Capital Assets
Pricing Model & Arbitrage Pricing Theory: Properties and Applications in Jordan."
Modern Applied Science 12.11 (2018).
11CORPORATE FINANCE
11. "Dividend Information | Antofagasta PLC." Antofagasta.co.uk. N.p., 2019. Web. 25 Mar.
2019.
12. Frazzini, Andrea, and Lasse Heje Pedersen. "Betting against beta." Journal of Financial
Economics 111.1 (2014): 1-25.
13. Nhleko, A. S., and C. Musingwini. "Estimating cost of equity in project discount rates
using the capital asset pricing model and Gordon’s wealth growth model." International
Journal of Mining, Reclamation and Environment 30.5 (2016): 390-404.
14. Lawson, Bradley P., and Dechun Wang. "The earnings quality information content of
dividend policies and audit pricing." Contemporary Accounting Research 33.4 (2016):
1685-1719.
15. Firth, Michael, et al. "Institutional stock ownership and firms’ cash dividend policies:
Evidence from China." Journal of Banking & Finance 65 (2016): 91-107.
⊘ This is a preview!⊘
Do you want full access?
Subscribe today to unlock all pages.
Trusted by 1+ million students worldwide
1 out of 13
Related Documents


Your All-in-One AI-Powered Toolkit for Academic Success.
+13062052269
info@desklib.com
Available 24*7 on WhatsApp / Email
![[object Object]](/_next/static/media/star-bottom.7253800d.svg)
Unlock your academic potential
Copyright © 2020–2026 A2Z Services. All Rights Reserved. Developed and managed by ZUCOL.