Descriptive Statistics Project: Anxiety Scores - PSY-520 Course

Verified

Added on  2023/04/21

|4
|401
|430
Project
AI Summary
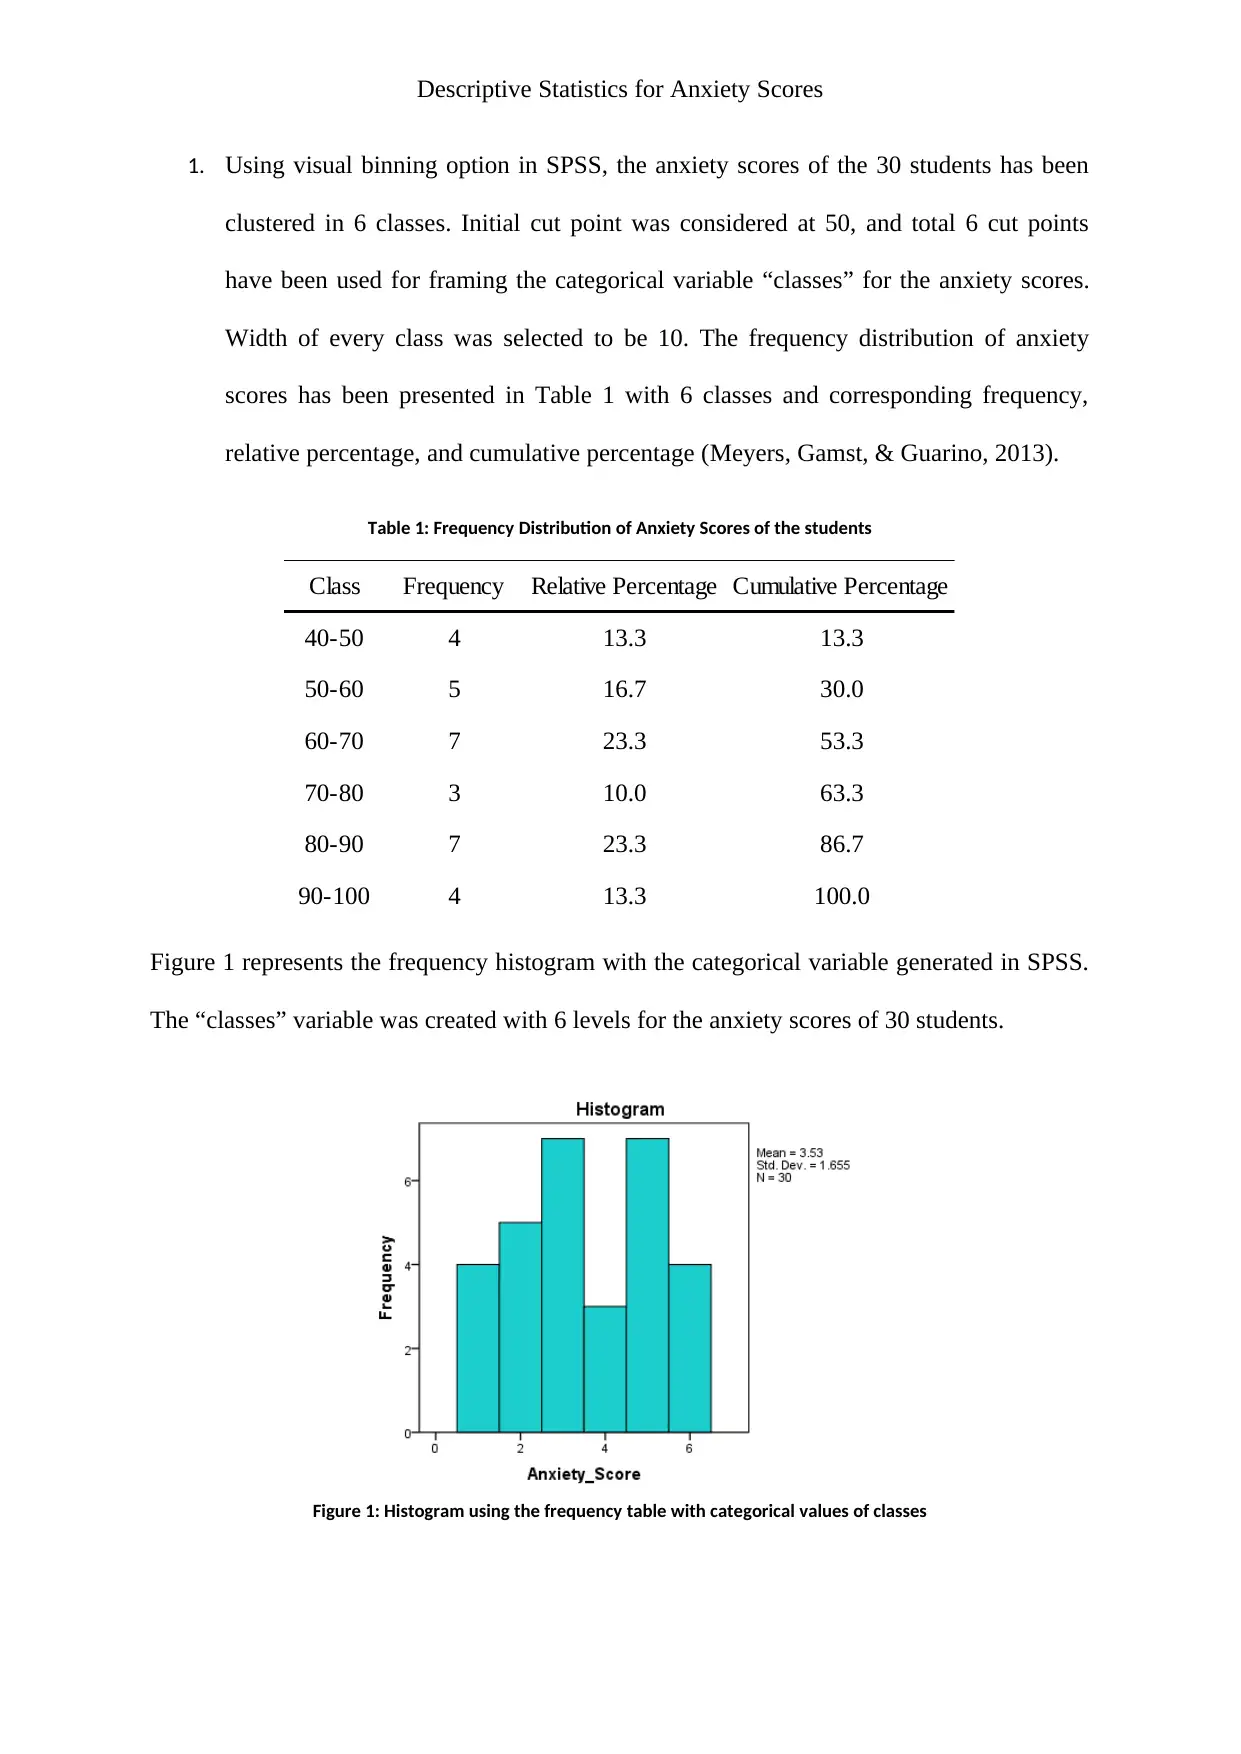
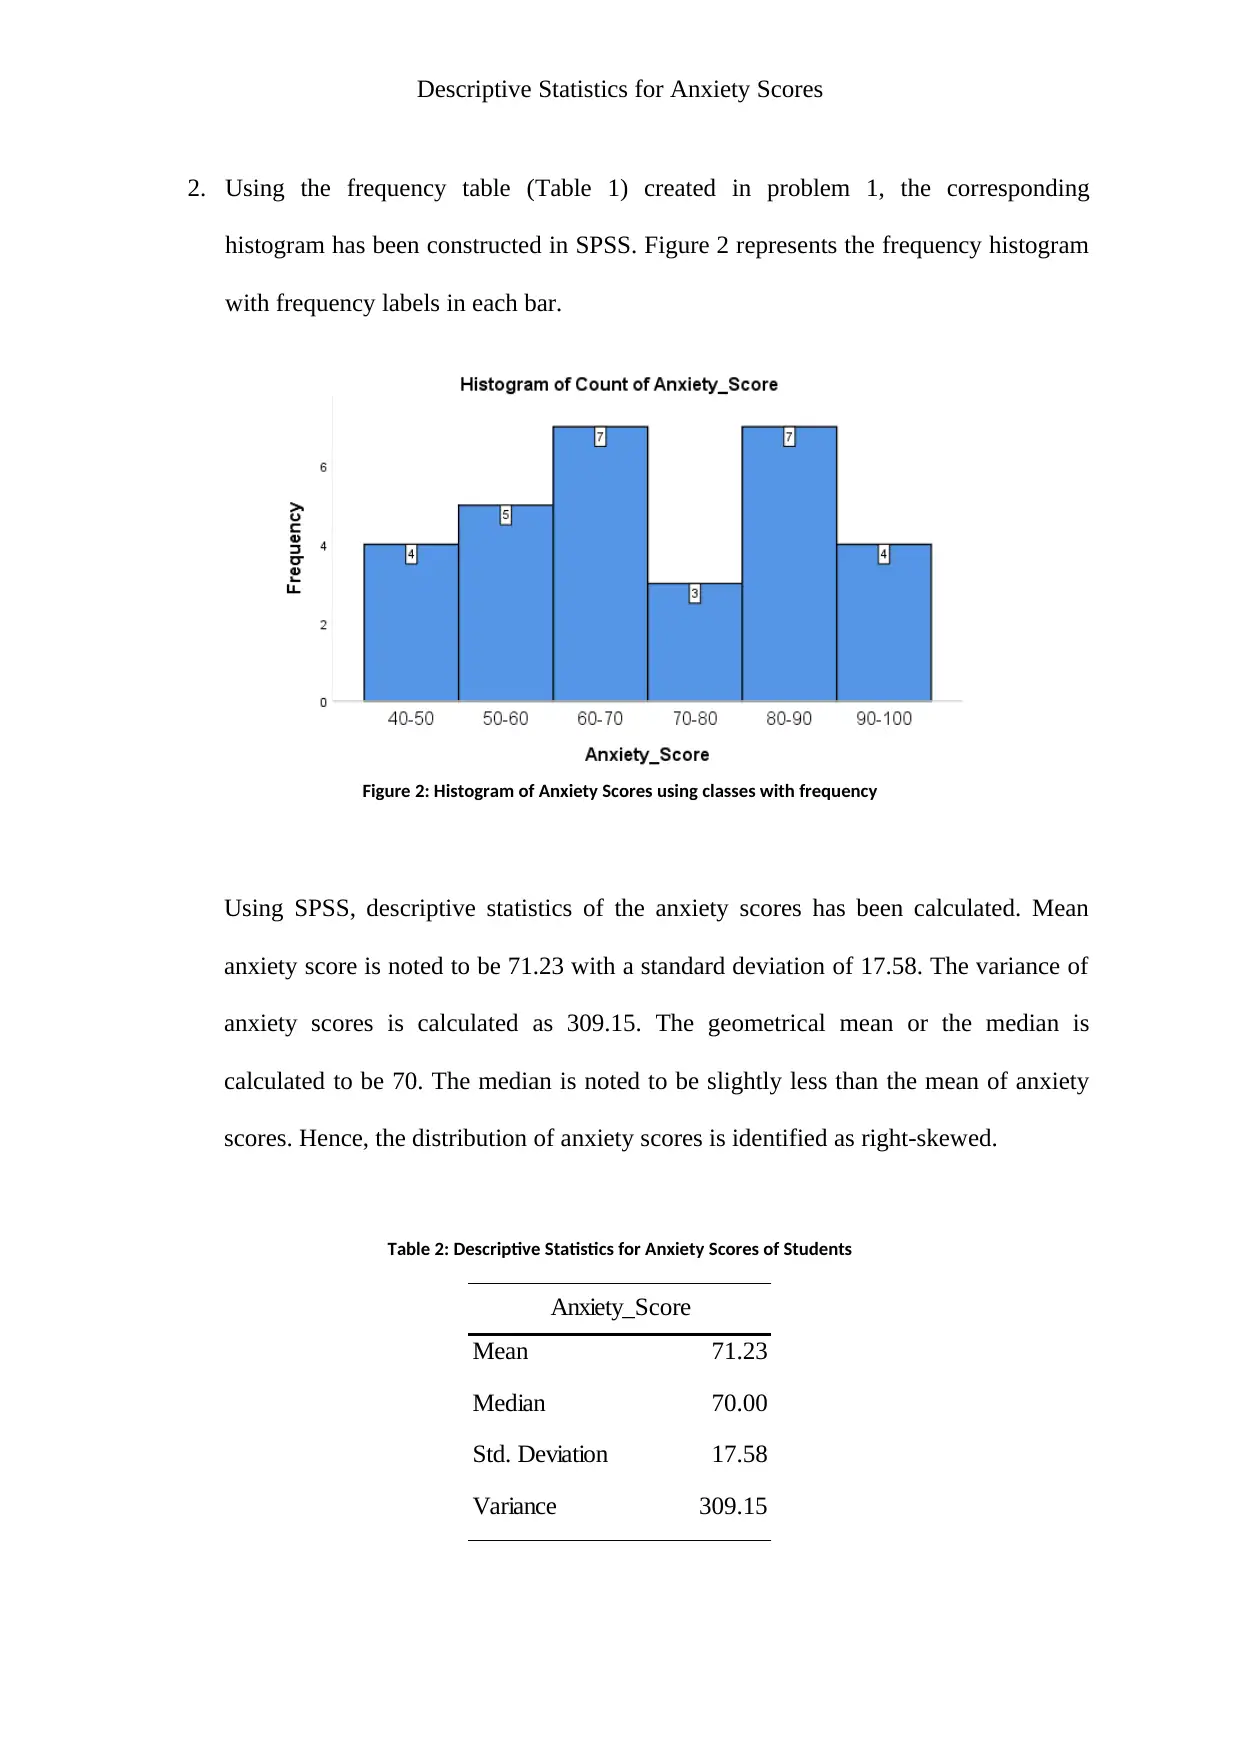
This project analyzes anxiety scores of 30 students using descriptive statistics. The solution begins by creating a frequency table with six classes based on the anxiety scores, including frequency, relative percentage, and cumulative percentage. A histogram is then constructed using the frequency table. Descriptive statistics such as mean, median, standard deviation, and variance are calculated using SPSS, revealing a right-skewed distribution. The mean anxiety score is 71.23, with a standard deviation of 17.58 and a median of 70. The project adheres to the assignment brief, providing a comprehensive analysis of the anxiety scores using appropriate statistical methods and visualizations.
Document Page
RUNNING HEAD: DESCRIPTIVE STATISTICS FOR ANXIETY SCORES
PSY-520 Graduate Statistics
Topic 1 – Descriptive Statistics Project
1
tabler-icon-diamond-filled.svg

Paraphrase This Document

Need a fresh take? Get an instant paraphrase of this document with our AI Paraphraser
Document Page
Descriptive Statistics for Anxiety Scores
1. Using visual binning option in SPSS, the anxiety scores of the 30 students has been
clustered in 6 classes. Initial cut point was considered at 50, and total 6 cut points
have been used for framing the categorical variable “classes” for the anxiety scores.
Width of every class was selected to be 10. The frequency distribution of anxiety
scores has been presented in Table 1 with 6 classes and corresponding frequency,
relative percentage, and cumulative percentage (Meyers, Gamst, & Guarino, 2013).
Table 1: Frequency Distribution of Anxiety Scores of the students
Class Frequency Relative Percentage Cumulative Percentage
40-50 4 13.3 13.3
50-60 5 16.7 30.0
60-70 7 23.3 53.3
70-80 3 10.0 63.3
80-90 7 23.3 86.7
90-100 4 13.3 100.0
Figure 1 represents the frequency histogram with the categorical variable generated in SPSS.
The “classes” variable was created with 6 levels for the anxiety scores of 30 students.
Figure 1: Histogram using the frequency table with categorical values of classes
Document Page
Descriptive Statistics for Anxiety Scores
2. Using the frequency table (Table 1) created in problem 1, the corresponding
histogram has been constructed in SPSS. Figure 2 represents the frequency histogram
with frequency labels in each bar.
Figure 2: Histogram of Anxiety Scores using classes with frequency
Using SPSS, descriptive statistics of the anxiety scores has been calculated. Mean
anxiety score is noted to be 71.23 with a standard deviation of 17.58. The variance of
anxiety scores is calculated as 309.15. The geometrical mean or the median is
calculated to be 70. The median is noted to be slightly less than the mean of anxiety
scores. Hence, the distribution of anxiety scores is identified as right-skewed.
Table 2: Descriptive Statistics for Anxiety Scores of Students
71.23
70.00
17.58
309.15
Mean
Median
Std. Deviation
Variance
Anxiety_Score
Document Page
Descriptive Statistics for Anxiety Scores
References
Meyers, L. S., Gamst, G. C., & Guarino, A. J. (2013). Performing Data Analysis Using IBM
SPSS. John Wiley & Sons. Retrieved from http://books.google.com
chevron_up_icon
1 out of 4
circle_padding
hide_on_mobile
zoom_out_icon
[object Object]