Analyzing the Impact of Anxiety, Self-Esteem, and Ethnicity
VerifiedAdded on 2022/09/07
|18
|3069
|26
Report
AI Summary
This report examines the impact of anxiety, self-esteem, and ethnicity on mental well-being. The study begins by establishing the prevalence of anxiety, particularly among young adults, and then explores the relationship between self-esteem and anxiety, citing existing research that suggests a positive correlation. The report also considers the role of ethnicity, noting how racial profiling can contribute to anxiety levels within certain ethnic groups. The methodology involves a regression model using data from 101 survey participants, incorporating scales for anxiety and self-esteem, and assessing the impact of ethnicity. The analysis includes factor analysis to assess the structure of the scales, reliability analysis, and the generation of composite scores. Findings include a one-factor solution for both anxiety and self-esteem scales and a reliability analysis indicating internal consistency. The study's results are presented through tables, figures, and statistical analyses, providing insights into the interplay of these factors and their impact on mental health.
Running head: ANXIETY AND SELF-ESTEEM
The Impact of Anxiety and Ethnicity on Self-Esteem
Name
Institution
The Impact of Anxiety and Ethnicity on Self-Esteem
Name
Institution
Paraphrase This Document
Need a fresh take? Get an instant paraphrase of this document with our AI Paraphraser
2
ANXIETY AND SELF-ESTEEM
The Impact of Anxiety and Ethnicity on Self-Esteem
Introduction
The internet age is characterized by high social networks, increased economic
uncertainty, and declining financial prospects has resulted in high anxiety levels. According to
Scheffler, Anold, Qazi, Harney, Linde, Dimick, and Vora (2018), millennials are facing the
highest anxiety unlike any other generation before them. In their study, Scheffler and colleagues
(2018) established that 34% of U.S adults between 18 and 64 years develop an anxiety disorder
at least once during their lifetime. They also found that anxiety is a significant concern for many
young adults. This study seeks to build on explore factors that impact the anxiety level. It
examines the extent to which the level of self-esteem and ethnicity background affect anxiety
levels.
Anxiety is the body’s natural response to worry about what’s to happen. An individual’s
response to anxiety and the actions taken thereafter determine the impact of the same on their
life. Different types of anxiety present themselves in varying situations. For instance, an
overwhelming fear of social situations characterizes social anxiety. Post-Traumatic Stress
Disorder (PTSD), on the other hand, is anxiety resulting from exposure to a traumatizing event.
Generalized anxiety disorder is anxiety triggered by little or no cause at all. Obsessive-
compulsive disorder (OCD) is another form of anxiety characterized by an obsessive repetition
of behavior that only gives temporary satisfaction.
This study was prompted by the increased cases of anxiety and depression as reported by
various scholars such as (Sheffler et al., 2018). Anxiety is a significant aspect that most people
face at one time. It threatens the well-being of the victim and limits their effectiveness in life.
3
ANXIETY AND SELF-ESTEEM
Studies on anxiety have, over the years, yielded various solutions. Therefore, it is essential to
explore various possible factors that are likely to impact anxiety. This study seeks to explore
further anxiety by examining the extent to which ethnic grouping and self-esteem levels affect it.
Literature Review
Self-esteem can be defined as having faith in your worth and abilities. According to
Bagley and Young (1990), self-esteem is the manner in which a person evaluates his/her
characteristics anchored on the observed characteristics of peers. There are different types of
self-esteem; high, low, inflated, explicit and implicit. High self-esteem is positive self-esteem.
People with high self-esteem display confidence in themselves, clarity on what they want, and
are open to new ideas. According to Riffai (1999), people with high self-esteem have healthier
relationships, adapt accordingly to challenges and have a happier life. Low self-esteem is
characterized by a lack of confidence, hostility, and social withdrawal. Low self-esteem can
result in various mental disorders, such as depression and anxiety (Mann, Hosman, Schaalma, &
de Vries, 2004).
Self-esteem and anxiety are related because people will experience both at some point in
their lives. Both share similar emotional and physical symptoms such as uneasiness, tension,
headaches, high blood pressure and loss of sleep. Self-esteem and anxiety are expected to have a
positive relationship. The theoretical framework suggests that if one is experiencing anxiety
without effective treatment, it can lead to post-traumatic stress disorder.
Ethnicity is a classification of people based on origin, culture and history. The primary
ethnic groups include Asians, Africans, Caucasians, and Hispanic. Ethnicity and anxiety are
related because various ethnic groups deal with anxiety every day due to racial profiling. In this
study, the African-Americans respondents are expected to have a high anxiety score due to the
⊘ This is a preview!⊘
Do you want full access?
Subscribe today to unlock all pages.
Trusted by 1+ million students worldwide
4
ANXIETY AND SELF-ESTEEM
current racial profile. A study by Jager, Suliman and Seedat (2014) on the role of ethnicity in
social anxiety disorder using 112 students established that anxiety is prevalent regardless of the
ethnic group. However, ethnicity is a significant element of anxiety for certain ethnic groups.
Research by Hunter and Schmidt (2010), on the prevalence of anxiety in African-
Americans, established that ethnicity plays a role in anxiety and depression. Young adults from
minority ethnic groups might experience anxiety as a result of fear of future discrimination
(Johnson, Roth, & Breslau, 2006).
Paraphrase This Document
Need a fresh take? Get an instant paraphrase of this document with our AI Paraphraser
5
ANXIETY AND SELF-ESTEEM
Method
Basically, a regression model with the equation stated below have been developed to
predict the level of anxiety among the participants. Through this model, it is easy to determine
the quantity of the anxiety and that in one way or the other, the model play an important role in
identifying the significant and non-significant predictor variables. Furthermore, the model makes
it easy to establish the quantity of change in the anxiety given a unit change of the independent
variables. With the regression equation, each coefficient value can be determined provided other
coefficients. Moreover, the regression equation provides avenue of identifying the fix amount of
anxiety while holding other values constant. This value is denoted by letter C in the equation
below. For to note, anxiety in the regression equation refers to the outcome or dependent variable
whereas self-esteem and ethnicity refers to the independent variables while the beta values are
considered as the coefficients of the variables. In addition, visualization of the results by use of
scree plots have been performed to identify the associations between the variables. Furthermore,
Principal Component Analysis for the self-esteem and anxiety variables were conducted to
identify the Total Variance Explained by each variable have been performed. Generally, the
Principal Component Analysis helps in one way or the other remove the existence features with
correlations. Finally, a histogram for the composites for the anxiety and self esteem variables
were drawn to check on the distributions of the variables by indicating the distribution curves on
the graphs.
The study seeks to examine the impact of self-esteem and ethnicity on anxiety. The
proposed model suggests that anxiety is a function of self-esteem and ethnicity and can be
presented as follows:
Anxiety = C + β1×Self-esteem + β2×Ethnicty
6
ANXIETY AND SELF-ESTEEM
This report employed primary data drawn from 101 survey participants. The data
collection procedures were different for the various study variables.
Ethnicity
Respondents were requested to indicate their ethnicity. The options included Caucasian
(39), Hispanic (31), African-American (19), Asian (5), or Mixed (7).
Anxiety
The anxiety variable was derived from the depression anxiety and stress scale. It assigns
various anxiety proxies a scale between 1 and 7, depending on how often anxiety attacks happen.
The scale is based on the following questions:
1. I am aware of dryness of my mouth. (ANXIETY_1)
2. I experience breathing difficulty (ANXIETY_2).
3. I experience trembling (ANXIETY_3).
4. I worry about situations in which I might panic and make a fool of myself (ANXIETY_4).
5. I feel close to panic (ANXIETY_5).
6. I am aware of the action of my heart in the absence of physical exertion (ANXIETY_6).
7. I feel scared without any good reason (ANXIETY_7).
The set of responses is designed such that the first option denotes low anxiety levels
while the last response denotes high levels of anxiety on the scale. The responses are: Does not
apply to me at all, Applies to me to some degree, or some of the time, Applies to me to a
considerable degree, or a good part of the time, Applies to me very much, or most of the time.
⊘ This is a preview!⊘
Do you want full access?
Subscribe today to unlock all pages.
Trusted by 1+ million students worldwide
7
ANXIETY AND SELF-ESTEEM
Osman (2012) using two studies, explored the internal consistency reliability of the depression
anxiety and stress scale. The study established that a general factor accounted for the greatest
proportion of overall variance in the anxiety scale and that it provided a good fit. The findings
provided evidence that the depression anxiety and stress scale has internal reliability.
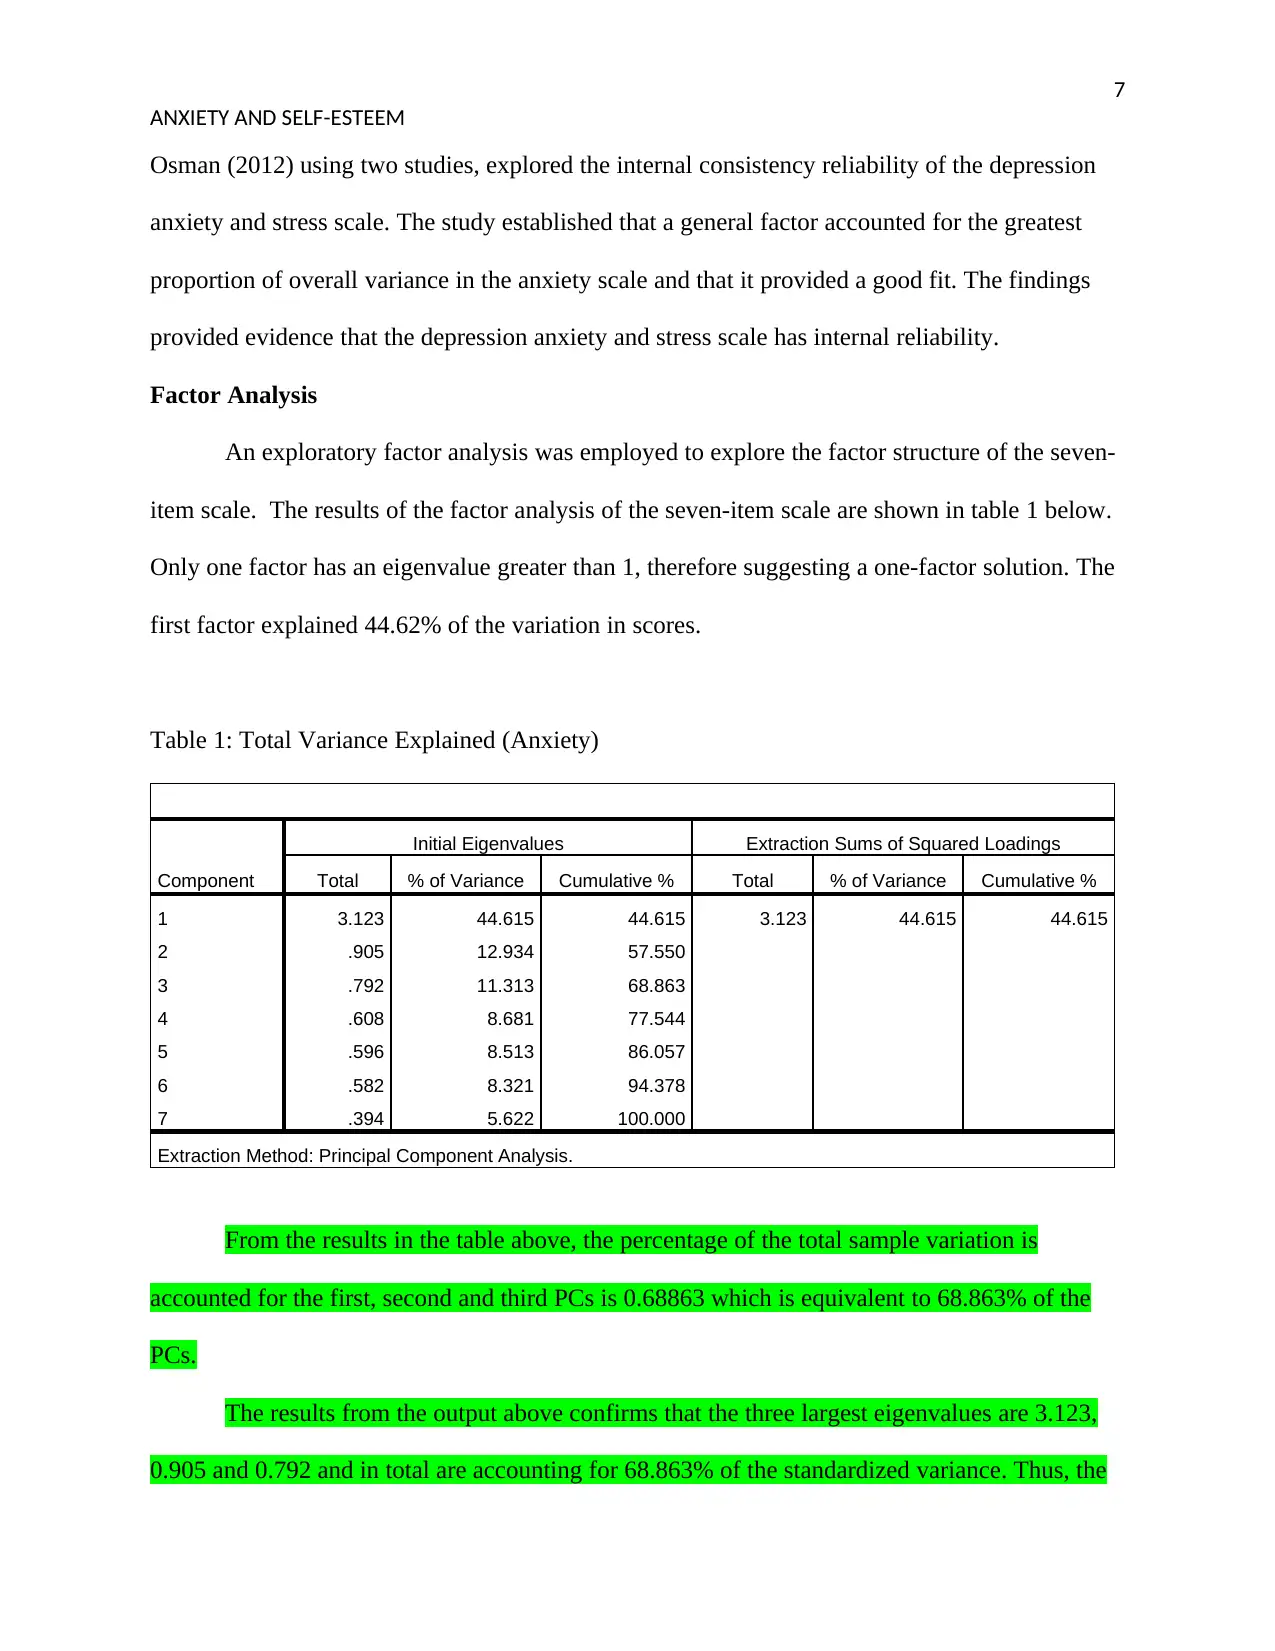
Factor Analysis
An exploratory factor analysis was employed to explore the factor structure of the seven-
item scale. The results of the factor analysis of the seven-item scale are shown in table 1 below.
Only one factor has an eigenvalue greater than 1, therefore suggesting a one-factor solution. The
first factor explained 44.62% of the variation in scores.
Table 1: Total Variance Explained (Anxiety)
Component
Initial Eigenvalues Extraction Sums of Squared Loadings
Total % of Variance Cumulative % Total % of Variance Cumulative %
1 3.123 44.615 44.615 3.123 44.615 44.615
2 .905 12.934 57.550
3 .792 11.313 68.863
4 .608 8.681 77.544
5 .596 8.513 86.057
6 .582 8.321 94.378
7 .394 5.622 100.000
Extraction Method: Principal Component Analysis.
From the results in the table above, the percentage of the total sample variation is
accounted for the first, second and third PCs is 0.68863 which is equivalent to 68.863% of the
PCs.
The results from the output above confirms that the three largest eigenvalues are 3.123,
0.905 and 0.792 and in total are accounting for 68.863% of the standardized variance. Thus, the
ANXIETY AND SELF-ESTEEM
Osman (2012) using two studies, explored the internal consistency reliability of the depression
anxiety and stress scale. The study established that a general factor accounted for the greatest
proportion of overall variance in the anxiety scale and that it provided a good fit. The findings
provided evidence that the depression anxiety and stress scale has internal reliability.
Factor Analysis
An exploratory factor analysis was employed to explore the factor structure of the seven-
item scale. The results of the factor analysis of the seven-item scale are shown in table 1 below.
Only one factor has an eigenvalue greater than 1, therefore suggesting a one-factor solution. The
first factor explained 44.62% of the variation in scores.
Table 1: Total Variance Explained (Anxiety)
Component
Initial Eigenvalues Extraction Sums of Squared Loadings
Total % of Variance Cumulative % Total % of Variance Cumulative %
1 3.123 44.615 44.615 3.123 44.615 44.615
2 .905 12.934 57.550
3 .792 11.313 68.863
4 .608 8.681 77.544
5 .596 8.513 86.057
6 .582 8.321 94.378
7 .394 5.622 100.000
Extraction Method: Principal Component Analysis.
From the results in the table above, the percentage of the total sample variation is
accounted for the first, second and third PCs is 0.68863 which is equivalent to 68.863% of the
PCs.
The results from the output above confirms that the three largest eigenvalues are 3.123,
0.905 and 0.792 and in total are accounting for 68.863% of the standardized variance. Thus, the
Paraphrase This Document
Need a fresh take? Get an instant paraphrase of this document with our AI Paraphraser
8
ANXIETY AND SELF-ESTEEM
most adequate summary and relevant data values that can be used from the dataset has been
provided by the first three principal components. Moreover, the four components, explaining
77.544% of the variation detected in one way or the other can be enough for the purposes of
using any given form of application. Furthermore, the PROC FACTOR analysis have retained
the first three components based on the eigenvalues-greater-than-one rule since the fourth
eigenvalue is only 0.608 as shown in the findings above.
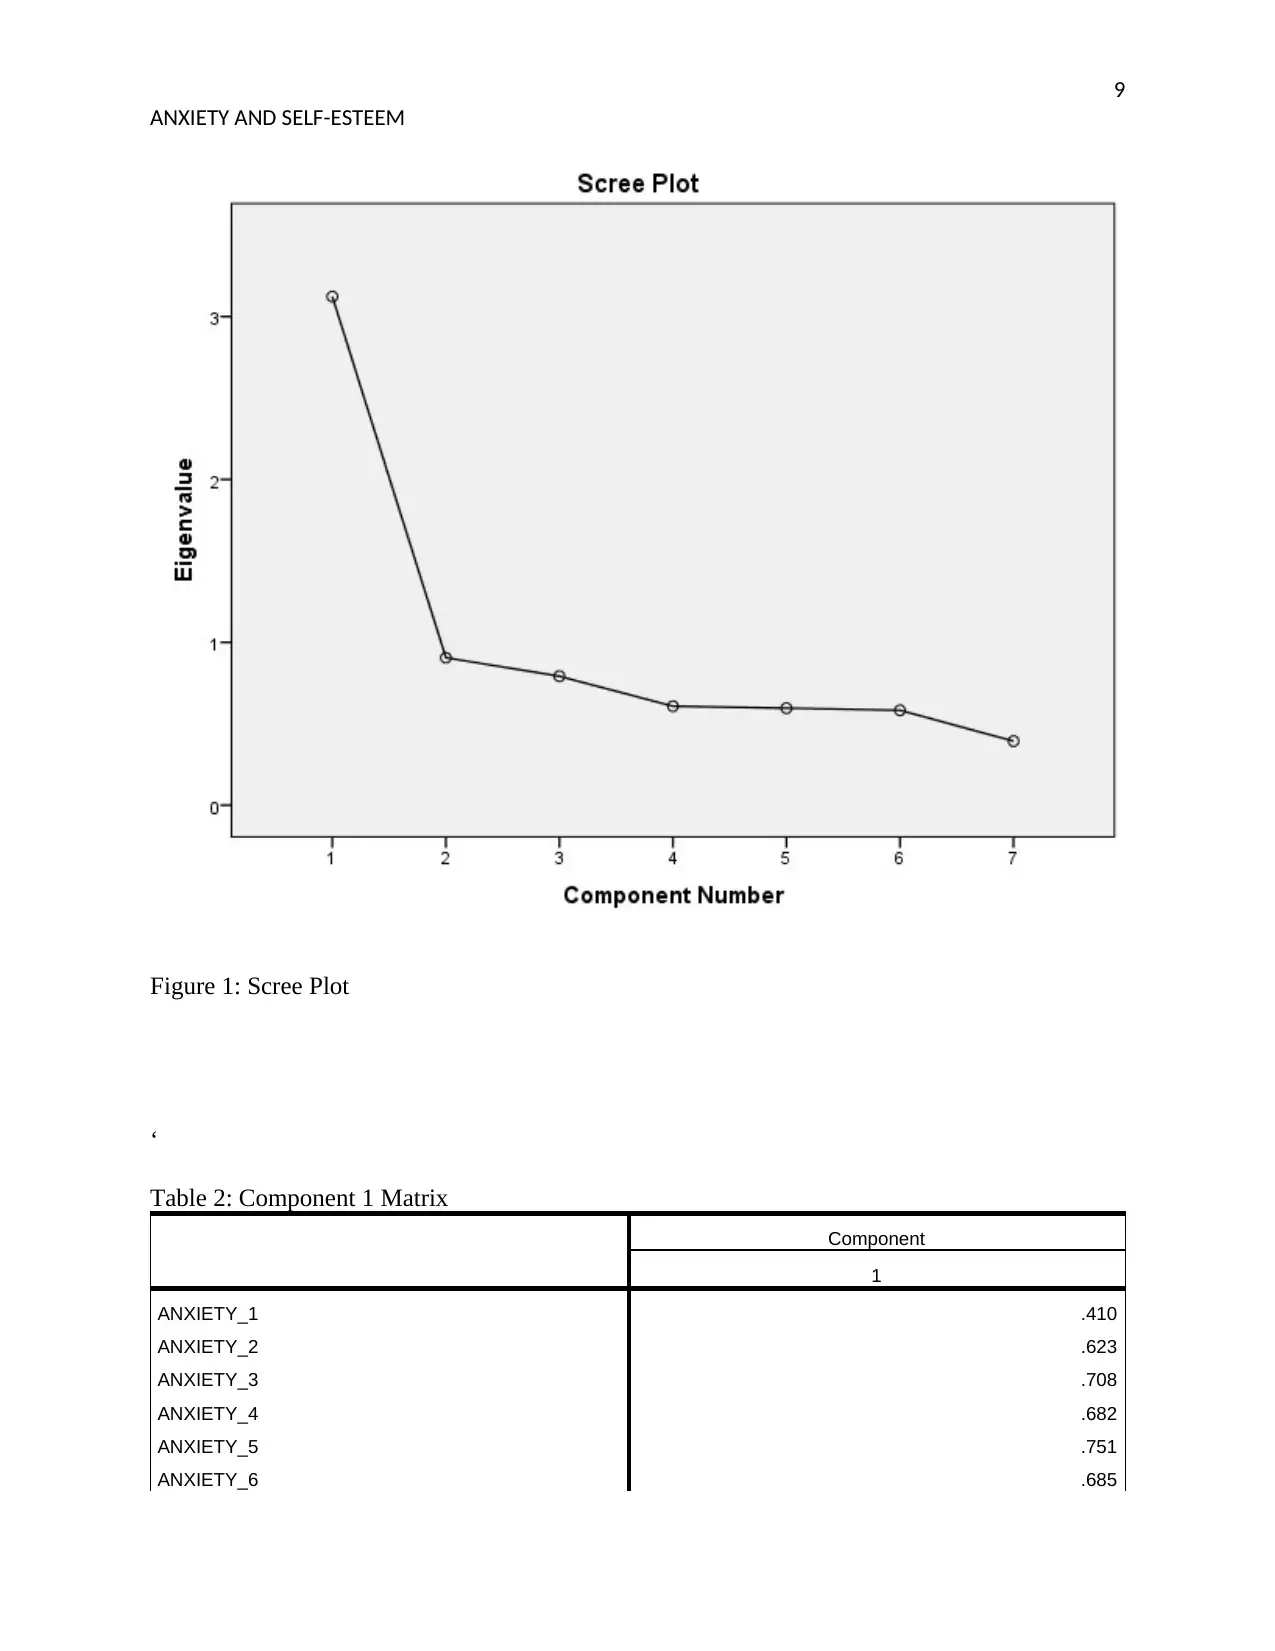
A scree test was undertaken to assess if the anxiety scale denoted a unidimensional
construct. Figure 1 below shows the scree plot. It has a point of inflexion suggesting a one-factor
solution. Further, the component matrix was observed to evaluate the extent to which the items
load heavily onto the first factor. The analysis showed that all items had loadings exceeding 0.4
on the first factor.
ANXIETY AND SELF-ESTEEM
most adequate summary and relevant data values that can be used from the dataset has been
provided by the first three principal components. Moreover, the four components, explaining
77.544% of the variation detected in one way or the other can be enough for the purposes of
using any given form of application. Furthermore, the PROC FACTOR analysis have retained
the first three components based on the eigenvalues-greater-than-one rule since the fourth
eigenvalue is only 0.608 as shown in the findings above.
A scree test was undertaken to assess if the anxiety scale denoted a unidimensional
construct. Figure 1 below shows the scree plot. It has a point of inflexion suggesting a one-factor
solution. Further, the component matrix was observed to evaluate the extent to which the items
load heavily onto the first factor. The analysis showed that all items had loadings exceeding 0.4
on the first factor.
9
ANXIETY AND SELF-ESTEEM
Figure 1: Scree Plot
‘
Table 2: Component 1 Matrix
Component
1
ANXIETY_1 .410
ANXIETY_2 .623
ANXIETY_3 .708
ANXIETY_4 .682
ANXIETY_5 .751
ANXIETY_6 .685
ANXIETY AND SELF-ESTEEM
Figure 1: Scree Plot
‘
Table 2: Component 1 Matrix
Component
1
ANXIETY_1 .410
ANXIETY_2 .623
ANXIETY_3 .708
ANXIETY_4 .682
ANXIETY_5 .751
ANXIETY_6 .685
⊘ This is a preview!⊘
Do you want full access?
Subscribe today to unlock all pages.
Trusted by 1+ million students worldwide
10
ANXIETY AND SELF-ESTEEM
ANXIETY_7 .754
Extraction Method: Principal Component Analysis.
a. 1 components extracted.
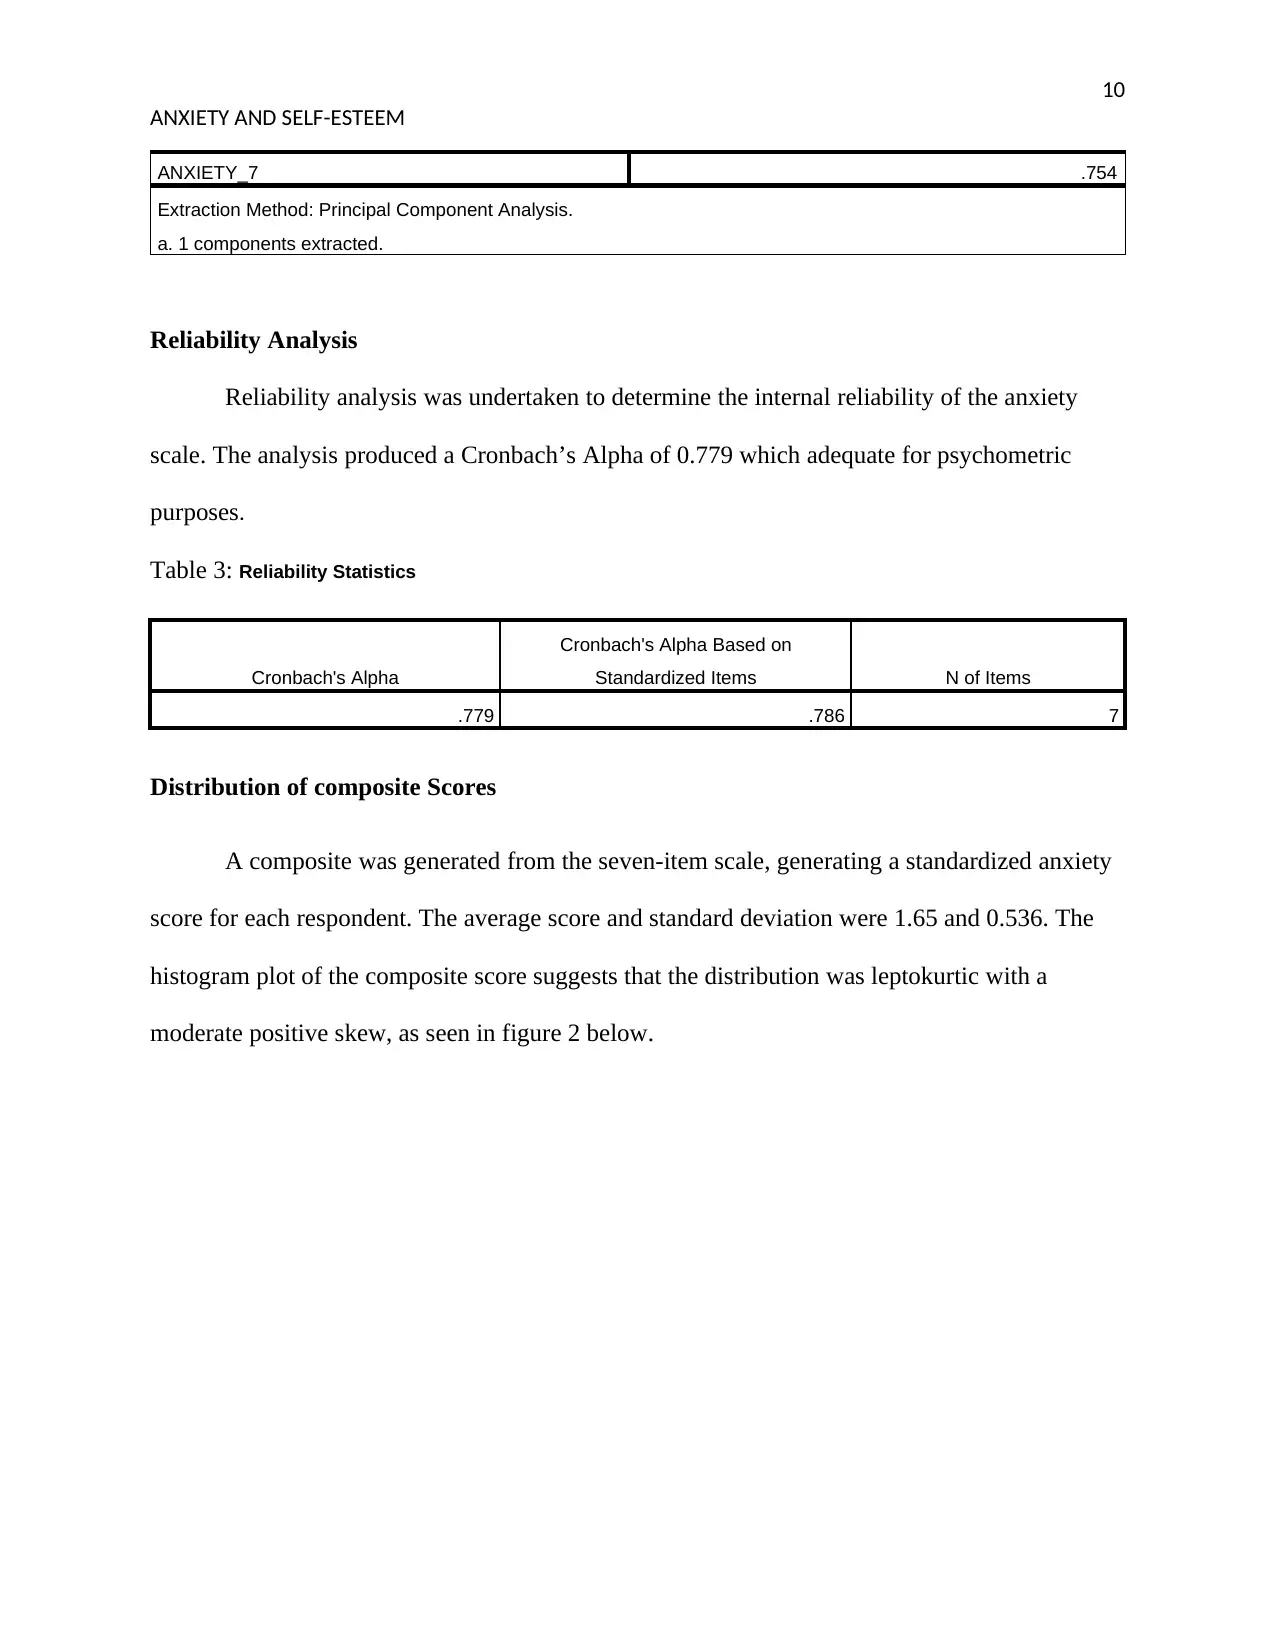
Reliability Analysis
Reliability analysis was undertaken to determine the internal reliability of the anxiety
scale. The analysis produced a Cronbach’s Alpha of 0.779 which adequate for psychometric
purposes.
Table 3: Reliability Statistics
Cronbach's Alpha
Cronbach's Alpha Based on
Standardized Items N of Items
.779 .786 7
Distribution of composite Scores
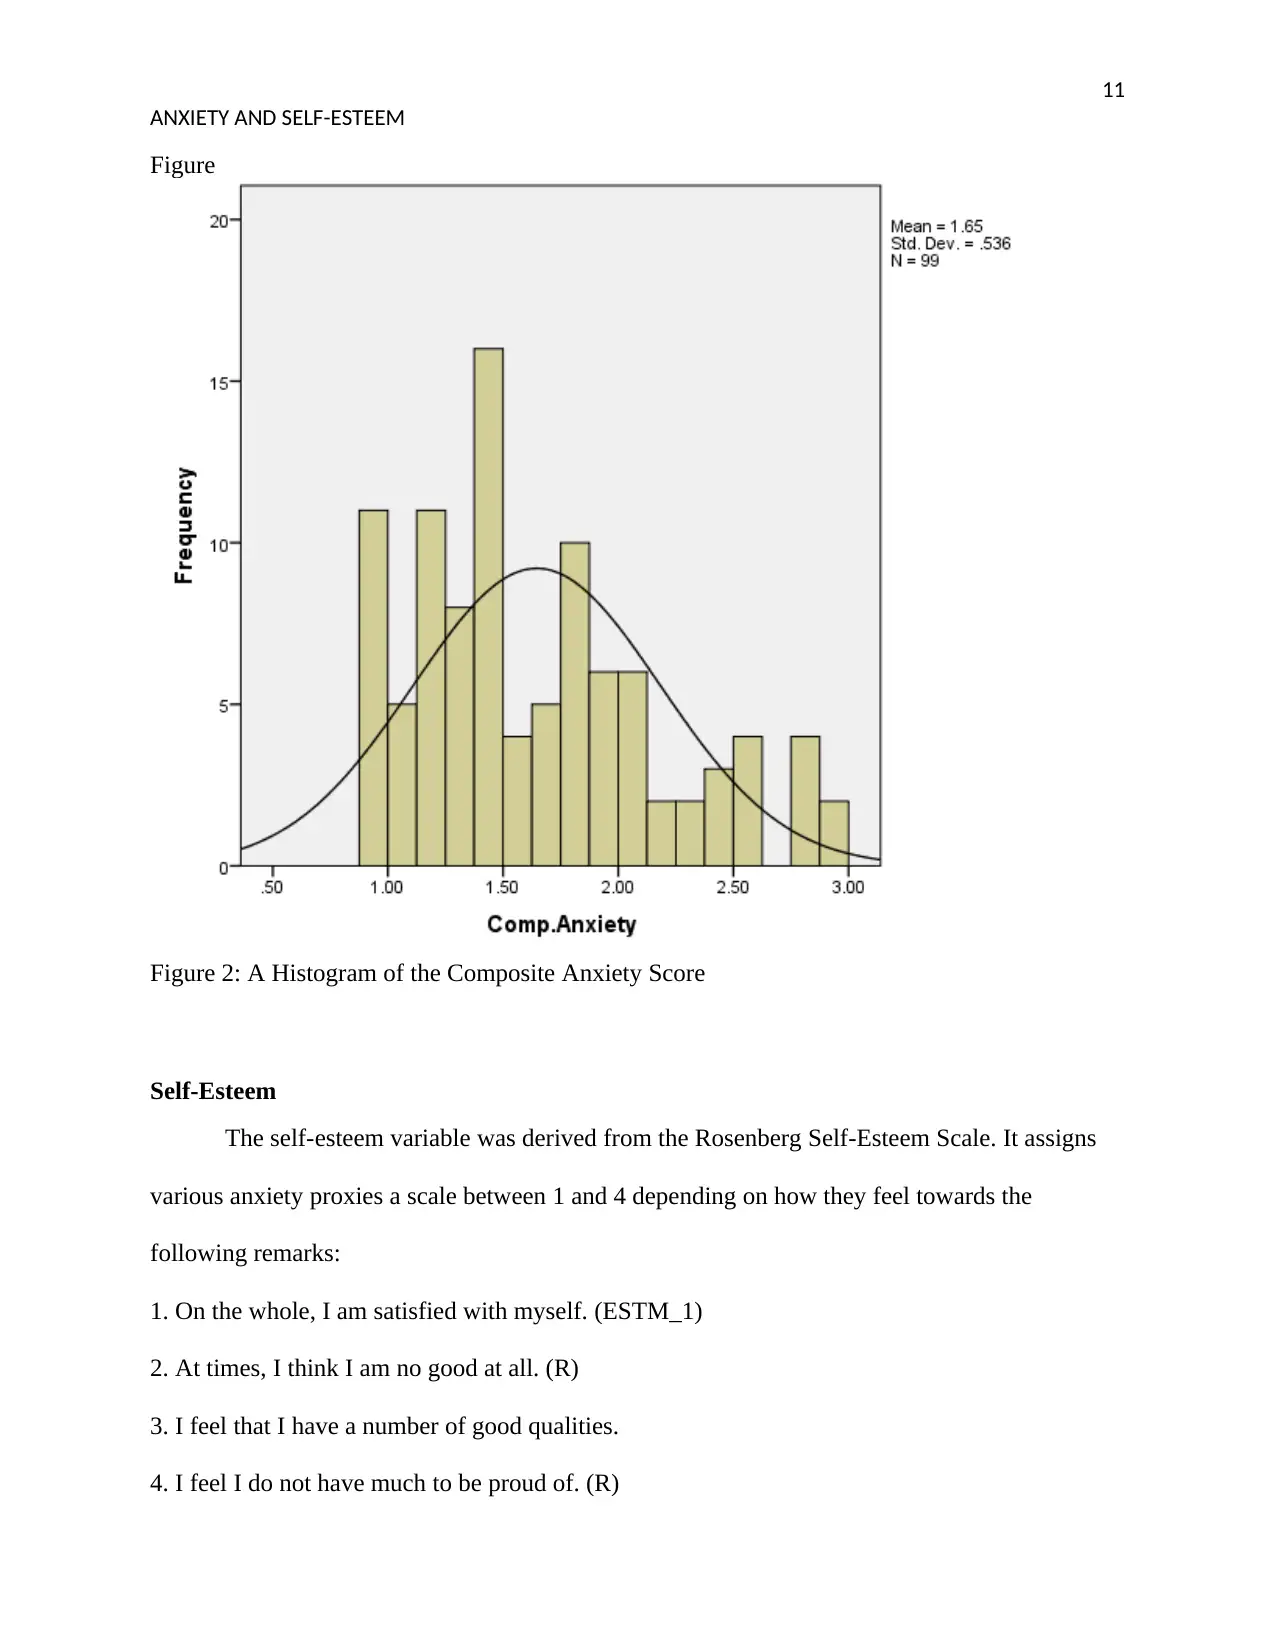
A composite was generated from the seven-item scale, generating a standardized anxiety
score for each respondent. The average score and standard deviation were 1.65 and 0.536. The
histogram plot of the composite score suggests that the distribution was leptokurtic with a
moderate positive skew, as seen in figure 2 below.
ANXIETY AND SELF-ESTEEM
ANXIETY_7 .754
Extraction Method: Principal Component Analysis.
a. 1 components extracted.
Reliability Analysis
Reliability analysis was undertaken to determine the internal reliability of the anxiety
scale. The analysis produced a Cronbach’s Alpha of 0.779 which adequate for psychometric
purposes.
Table 3: Reliability Statistics
Cronbach's Alpha
Cronbach's Alpha Based on
Standardized Items N of Items
.779 .786 7
Distribution of composite Scores
A composite was generated from the seven-item scale, generating a standardized anxiety
score for each respondent. The average score and standard deviation were 1.65 and 0.536. The
histogram plot of the composite score suggests that the distribution was leptokurtic with a
moderate positive skew, as seen in figure 2 below.
Paraphrase This Document
Need a fresh take? Get an instant paraphrase of this document with our AI Paraphraser
11
ANXIETY AND SELF-ESTEEM
Figure
Figure 2: A Histogram of the Composite Anxiety Score
Self-Esteem
The self-esteem variable was derived from the Rosenberg Self-Esteem Scale. It assigns
various anxiety proxies a scale between 1 and 4 depending on how they feel towards the
following remarks:
1. On the whole, I am satisfied with myself. (ESTM_1)
2. At times, I think I am no good at all. (R)
3. I feel that I have a number of good qualities.
4. I feel I do not have much to be proud of. (R)
12
ANXIETY AND SELF-ESTEEM
5. I certainly feel useless at times. (R)
6. I feel that I’m a person of worth, at least on an equal plane with others.
7. I wish I could have more respect for myself. (R)
8. All in all, I am inclined to feel that I am a failure. (R)
9. I take a positive attitude toward myself.
Bagley (1997) established evidence of strong internal reliability of the Rosenberg Self-Esteem
Scale.
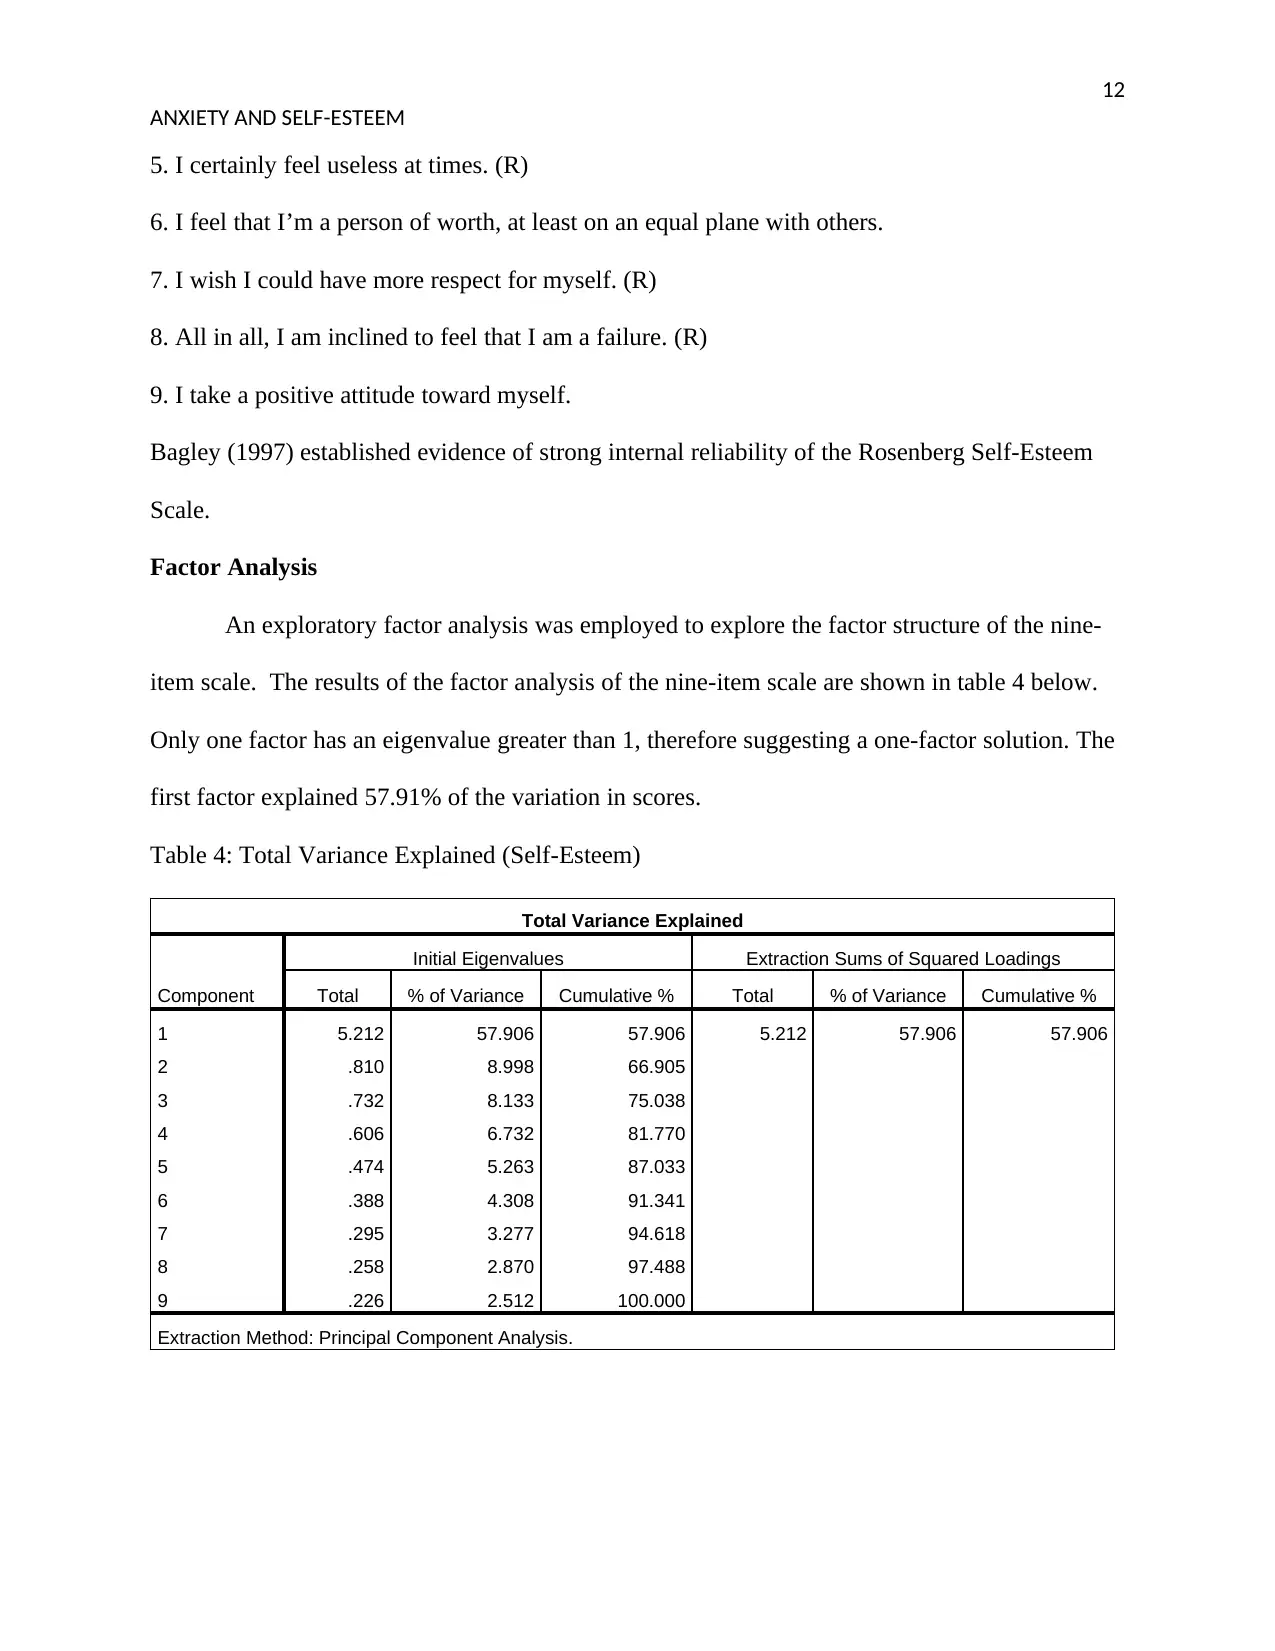
Factor Analysis
An exploratory factor analysis was employed to explore the factor structure of the nine-
item scale. The results of the factor analysis of the nine-item scale are shown in table 4 below.
Only one factor has an eigenvalue greater than 1, therefore suggesting a one-factor solution. The
first factor explained 57.91% of the variation in scores.
Table 4: Total Variance Explained (Self-Esteem)
Total Variance Explained
Component
Initial Eigenvalues Extraction Sums of Squared Loadings
Total % of Variance Cumulative % Total % of Variance Cumulative %
1 5.212 57.906 57.906 5.212 57.906 57.906
2 .810 8.998 66.905
3 .732 8.133 75.038
4 .606 6.732 81.770
5 .474 5.263 87.033
6 .388 4.308 91.341
7 .295 3.277 94.618
8 .258 2.870 97.488
9 .226 2.512 100.000
Extraction Method: Principal Component Analysis.
ANXIETY AND SELF-ESTEEM
5. I certainly feel useless at times. (R)
6. I feel that I’m a person of worth, at least on an equal plane with others.
7. I wish I could have more respect for myself. (R)
8. All in all, I am inclined to feel that I am a failure. (R)
9. I take a positive attitude toward myself.
Bagley (1997) established evidence of strong internal reliability of the Rosenberg Self-Esteem
Scale.
Factor Analysis
An exploratory factor analysis was employed to explore the factor structure of the nine-
item scale. The results of the factor analysis of the nine-item scale are shown in table 4 below.
Only one factor has an eigenvalue greater than 1, therefore suggesting a one-factor solution. The
first factor explained 57.91% of the variation in scores.
Table 4: Total Variance Explained (Self-Esteem)
Total Variance Explained
Component
Initial Eigenvalues Extraction Sums of Squared Loadings
Total % of Variance Cumulative % Total % of Variance Cumulative %
1 5.212 57.906 57.906 5.212 57.906 57.906
2 .810 8.998 66.905
3 .732 8.133 75.038
4 .606 6.732 81.770
5 .474 5.263 87.033
6 .388 4.308 91.341
7 .295 3.277 94.618
8 .258 2.870 97.488
9 .226 2.512 100.000
Extraction Method: Principal Component Analysis.
⊘ This is a preview!⊘
Do you want full access?
Subscribe today to unlock all pages.
Trusted by 1+ million students worldwide
1 out of 18
Related Documents


Your All-in-One AI-Powered Toolkit for Academic Success.
+13062052269
info@desklib.com
Available 24*7 on WhatsApp / Email
![[object Object]](/_next/static/media/star-bottom.7253800d.svg)
Unlock your academic potential
Copyright © 2020–2026 A2Z Services. All Rights Reserved. Developed and managed by ZUCOL.