The Effect of Non-Clinical Anxiety on Simple and Choice Reaction Time
VerifiedAdded on 2023/06/12
|25
|8608
|471
Report
AI Summary
This report investigates the influence of non-clinical anxiety on reaction time (RT) and intra-individual variability (IIV) using simple and choice RT tests. The study explores how factors like age, gender, and anxiety levels affect cognitive function and information processing speed. The simple RT test measures reaction to a single stimulus, while the choice RT test involves responding to different stimuli, requiring additional cognitive capabilities. The tests assess the impact of advance warning on reaction speed. The study also discusses the neurobiological factors contributing to IIV, such as neurodegenerative diseases and psychological disturbances. The simple RT test, using visual cues, quantifies human response time, aiding in the early identification of reduced brain function. The report concludes that anxiety increases response time and affects cognitive performance, highlighting the importance of visual signals in RT tests to prepare the mind for a reaction. Desklib offers more resources for students.
[Effect of non-clinical anxiety on reaction time and IIV in older & younger adults]
2018
Student name
ID
2018
Student name
ID
Paraphrase This Document
Need a fresh take? Get an instant paraphrase of this document with our AI Paraphraser
Simple and Choice Reaction Time
Introduction
The main aim of this study is to examine information processing speed and its inter-individual variability
using a Simple reaction time and a Choice RT test. Specifically, the extent to which depression or anxiety
affects cognitive function, and in particular, how this association may vary according to age, depression,
educational level, gender, handedness, non-clinical anxiety levels, objective cognitive function, subjective
memory function and vision is examined. The Simple RT test involves reacting as quickly as possible in
the response of an individual stimulus, whereas Choice RT requires response as quickly as possible due to
the appropriate response to one of the various possible stimuli that require additional psychological
capabilities (Gordon et al., 2018). In the present study, the two tests include assessing the handling that
happens by being warned in advance of the presence of a stimulating effect that would allow a reaction to
occur.
The speed of data processing and intra-individual variability (IIV) are a critical issue in understanding
neuropsychological procedures. Intra- individual variability attempts to describe how a person's behaviour
and abilities differ after a while (especially RT). This is something that is on the verge of revival, related
to the reduction of man's subjective capacity and additional behaviour (Gordon et al., 2018). Previous
studies have shown that IIV is due to neurodegenerative and in addition to other psychology-related
disturbance, for example, dementia. However, there is now more research is being conducted to see its
variations, for example, non-clinical anxiety and subjective objection to age could also affect an
individual's IIV.
Several neurobiological factors can explain the variability in adults when extending work. For example,
insufficient neuroregulation associated with increased nerve disturbances and subsequent decreases in
cortical imaging are the possible causes. In addition, MRI scans reveal that psychological disturbances
also contribute to expanded inter-individual variability. The level of frontal and central white matter of
the cortex of brain signalling is also associated with intra-individual fluctuations in elderly age group
population.
Simple and Choice RT
In this section, RT and IIV were analyzed using a simple reaction time and a Choice RT test; both are
commonly used as part of the research, but not in clinical practice. The Simple RT test involves a
response that is as quick as possible in the light of an individual stimulus, whereas Choice RT requires a
reaction that is as quick as possible in light of the appropriate response to one of a different stimulus that
requires additional intellectual capabilities, (i.e leadership, and decision making ability) (Gordon et al.,
2018). In this test, the two tests include assessing the manipulations that occur by presenting a stimulus,
which enables a reaction to occur.
The simple and choice RT contrast tests (in relation to the research under consideration), unlike the other
research test used as part of this study, is concerned with the research that has been done so far since the
purpose of this review is to analyze RT and IIV in various examinations. The very object of the Visual
Investigation Test (including search) therefore involves moving the focus point for consideration in
relation to an important question on the screen, finding a pre-determined stimulus, as its significant
component is paying attention. Interestingly, the Simple RT is not specifically designed to be remarkable,
as it naturally attracts attention as the main stimulus of the screen. The test only allows for the
measurement of the distance between the RTG and the younger age group, unlike the choice RT selection
test in this exam, the stimulus varies (images or letters) that can activate individual zones of intellectual
ability. In the “Conjunction” section of the visual query (Target in addition to the distraction state)
involves moving focus "voluntarily" in the area of a given question and deviating data is not taken into
account. When tested in the Simple and Choice RT tests, this part of the specific study is not required to a
degree that cannot be distinguished from just one stimulus that is displayed at a time.
As a basic aspect of the second larger investigation, as young and old members were involved (where
possible), we can see whether data processing speeds and IIVs vary after completely relying on the test
used.
The simple and selectable RT system is checked for the effects of different variables (gender, age,
instructions, anxiety and misery) and whether the result is redirected to the effects of visual query. In
addition, Choice RT checks how the number of trials can be related to the rate/speed of data processing
and IIV by partial testing of four separate test squares.
A problem with this study is that the honesty of inter-individual variability cannot be assessed because of
the test involving only one separate study. Due to numerous tests, Simple and Choice RT tests can
quantify RT variations in young and older participants. However, as there are numerous studies of data
that prepare for speed and variability, these orders are extremely clear and easy to implement.
⊘ This is a preview!⊘
Do you want full access?
Subscribe today to unlock all pages.
Trusted by 1+ million students worldwide
The two tests were reviewed to determine whether the fairness of the pace and IIV data for older and
younger subjects is comparative among the tests and whether there is a comparable impact of gender,
training, metacognition, and subjective memory.
Due to various tests, Simple and Choice RT tests can measure RT variations in younger and elderly
population groups. Not like the many studies of data processing speed and fluctuations, these orders are
extremely clear and easy to implement.
The Simple RT Test (Startlights)
Simplified RT test is a simple test designed to quantify the response time of humans. The approach is a
vital measure of psychological capacity and could help early identification of reduced brain function
among participants. In this test, three shaded circles (red, orange, green) appear on a dark background,
surrounded by the instructions "Ready", "Steady" and "Go". The first included a red bullet in a dark
square with " Ready " in the red circle. The second was a golden coloured in a dark square with a bigger
word "Steady" in the golden circle. The last circle was the green circle of a dark square with an even
bigger word: "GO!" in the green circle. At the point where the members saw the green circle, they were
told to push the space bar on the computer keyboard as quickly as possible. An aggregate of 35 of these
tests was the entire test. There was no rest period between each attempt after the training sessions.
The census of visual signs indicating earlier the purpose is intended to extend the readiness, i.e., preparing
the participants to prepare for the needed response. In this way, the test measures some of the
manipulation that occurs when a person is pre-alerted for a purpose that subsequently allows him to detect
his reaction. This part of the preparation was analysed by evaluating the reaction time (RT) from the
target that appears to the response that is given (pressing the space bar). Moreover, the duration between
the two signals and the objective amplification contrasts between each attempt. The use of these visual
signals and, moreover, the shifting of the time they have been exposed is intended to reduce the amount
of expected responses, i.e. pressing the button too early (Jolles et al., 2016). This can happen as
participants take the request of any incited and targeted stimuli in a way of attempting to predict when the
stimulus will be visible.
The point was to make the members of the investigation react to the green focus as quickly as possible.
Professionals will include visual guidance before entering the shading codes as a preparation method. It is
essential to prepare them mentally for the data that would require a response. In general, this test
measures the manipulation that happens when a person receives a pre-release message that allows them to
Paraphrase This Document
Need a fresh take? Get an instant paraphrase of this document with our AI Paraphraser
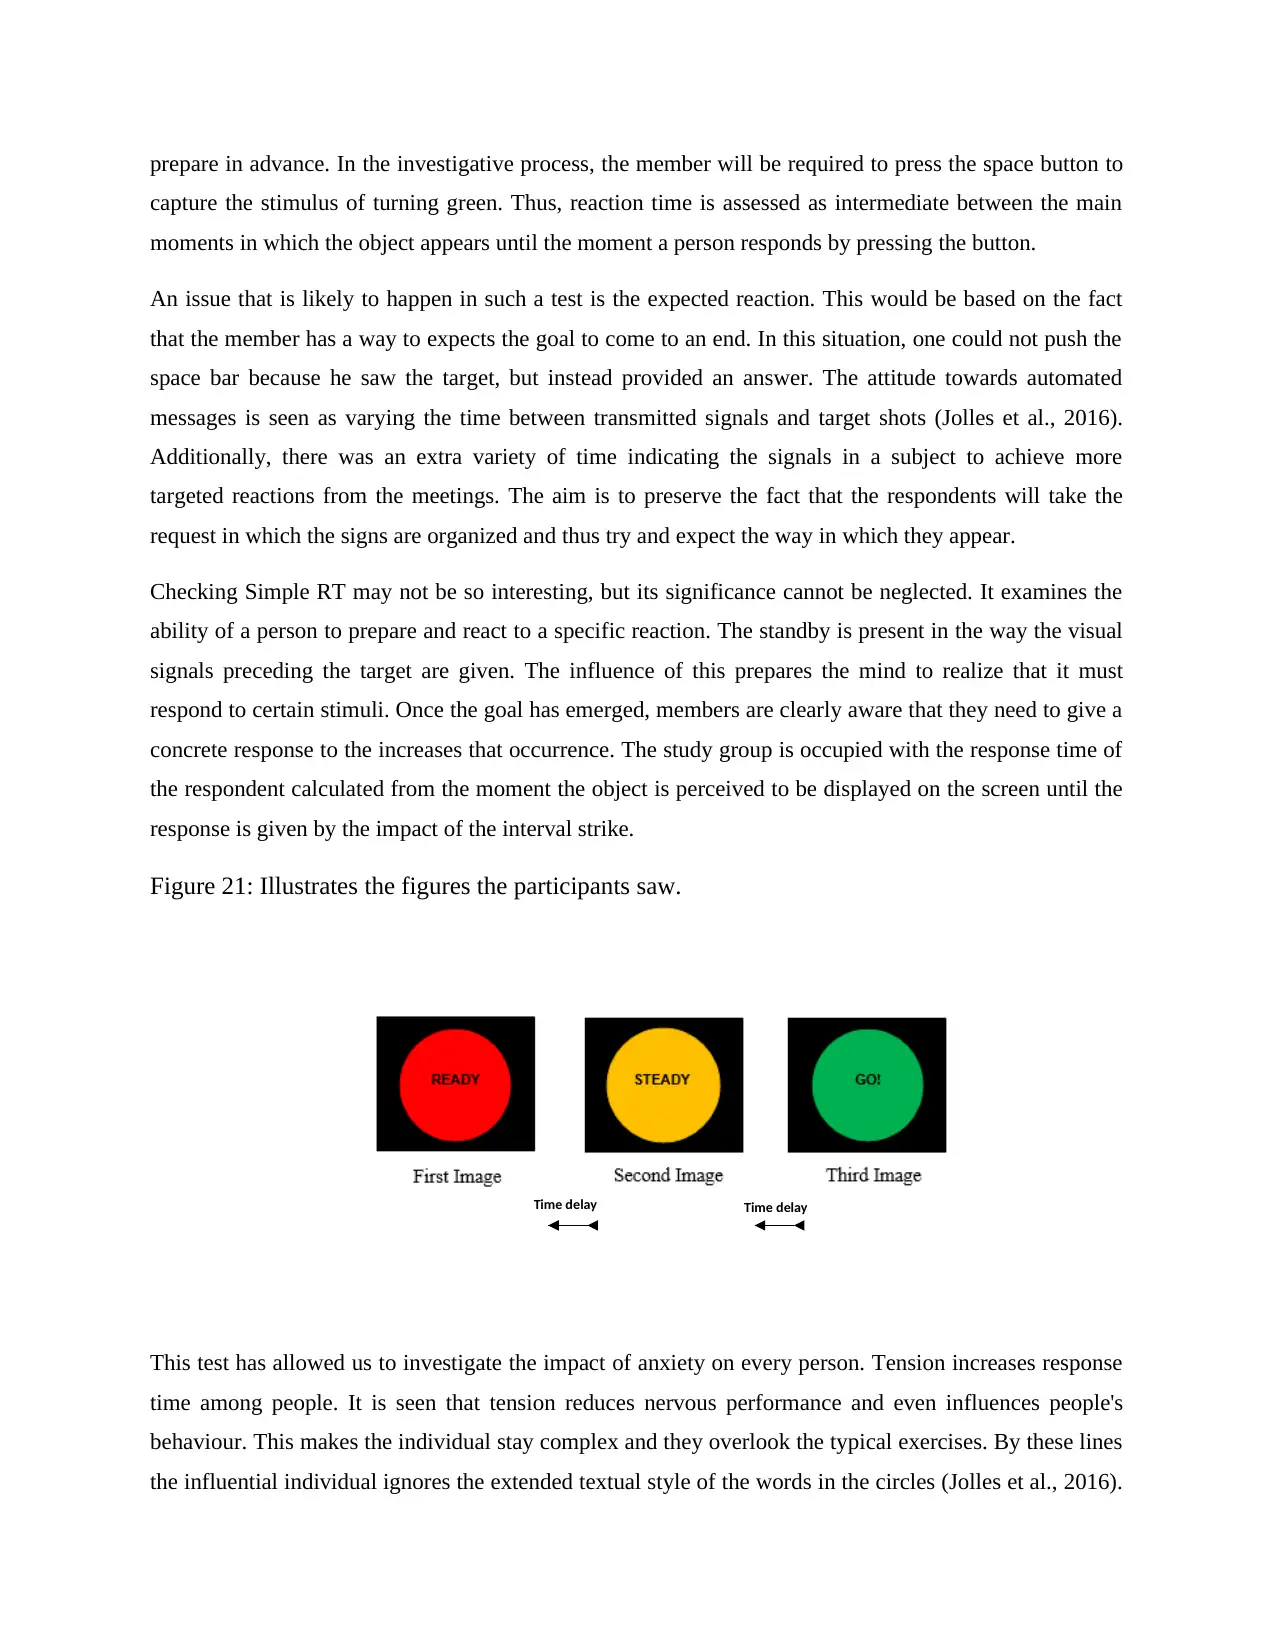
prepare in advance. In the investigative process, the member will be required to press the space button to
capture the stimulus of turning green. Thus, reaction time is assessed as intermediate between the main
moments in which the object appears until the moment a person responds by pressing the button.
An issue that is likely to happen in such a test is the expected reaction. This would be based on the fact
that the member has a way to expects the goal to come to an end. In this situation, one could not push the
space bar because he saw the target, but instead provided an answer. The attitude towards automated
messages is seen as varying the time between transmitted signals and target shots (Jolles et al., 2016).
Additionally, there was an extra variety of time indicating the signals in a subject to achieve more
targeted reactions from the meetings. The aim is to preserve the fact that the respondents will take the
request in which the signs are organized and thus try and expect the way in which they appear.
Checking Simple RT may not be so interesting, but its significance cannot be neglected. It examines the
ability of a person to prepare and react to a specific reaction. The standby is present in the way the visual
signals preceding the target are given. The influence of this prepares the mind to realize that it must
respond to certain stimuli. Once the goal has emerged, members are clearly aware that they need to give a
concrete response to the increases that occurrence. The study group is occupied with the response time of
the respondent calculated from the moment the object is perceived to be displayed on the screen until the
response is given by the impact of the interval strike.
Figure 21: Illustrates the figures the participants saw.
Time delay Time delay
This test has allowed us to investigate the impact of anxiety on every person. Tension increases response
time among people. It is seen that tension reduces nervous performance and even influences people's
behaviour. This makes the individual stay complex and they overlook the typical exercises. By these lines
the influential individual ignores the extended textual style of the words in the circles (Jolles et al., 2016).
This test evaluates the capacity and time of a person to perceive the style of the text and the size of the
letters in the circles, and hence this test has enabled the specialist to understand the degree of tension on
the person.
Undoubtedly, the use of signals in the Simple RT test is a typical practice that is of paramount
importance. The point is to urge the individual and to adjust for the entry of a goal. It should be
understood that the brain's workload faces several limitations on the assets available for preparation. In
this way, a notification will be required as a way of establishing the mind and advising it on the need to
think of a reaction. In addition, there is an advantage over the influence of a person responding much
faster to the goal (Jolles et al., 2016). By infusing the visuals, the scientist will depend on the impact that
interferes with the noradrenergic framework.
The Simple RT test in this study quantifies the warning effect on the merits as the tests do not differ
between the warning and non-response reactions, i.e we do not measure RT contrasts between warnings
(signalled) or unplanned target fulfilment (Lynch et al., 2018). Nevertheless, the test uses visual signs
("Ready" and "Steady" circles) to expand some readiness and thus cause people to prepare for a reaction.
Two visuals with different shades (red and orange) were used as they recreated natural light for
movement, so members will be prepared / alerted for a green Target stimulus thus ready to react quickly
when it appears on the screen. This is how the typical regular part of the data preparation speed is
discussed. We find that successive occasions happen one after another and know when to prepare for a
specific reaction.
In this study, nobody suffered from colour blindness.
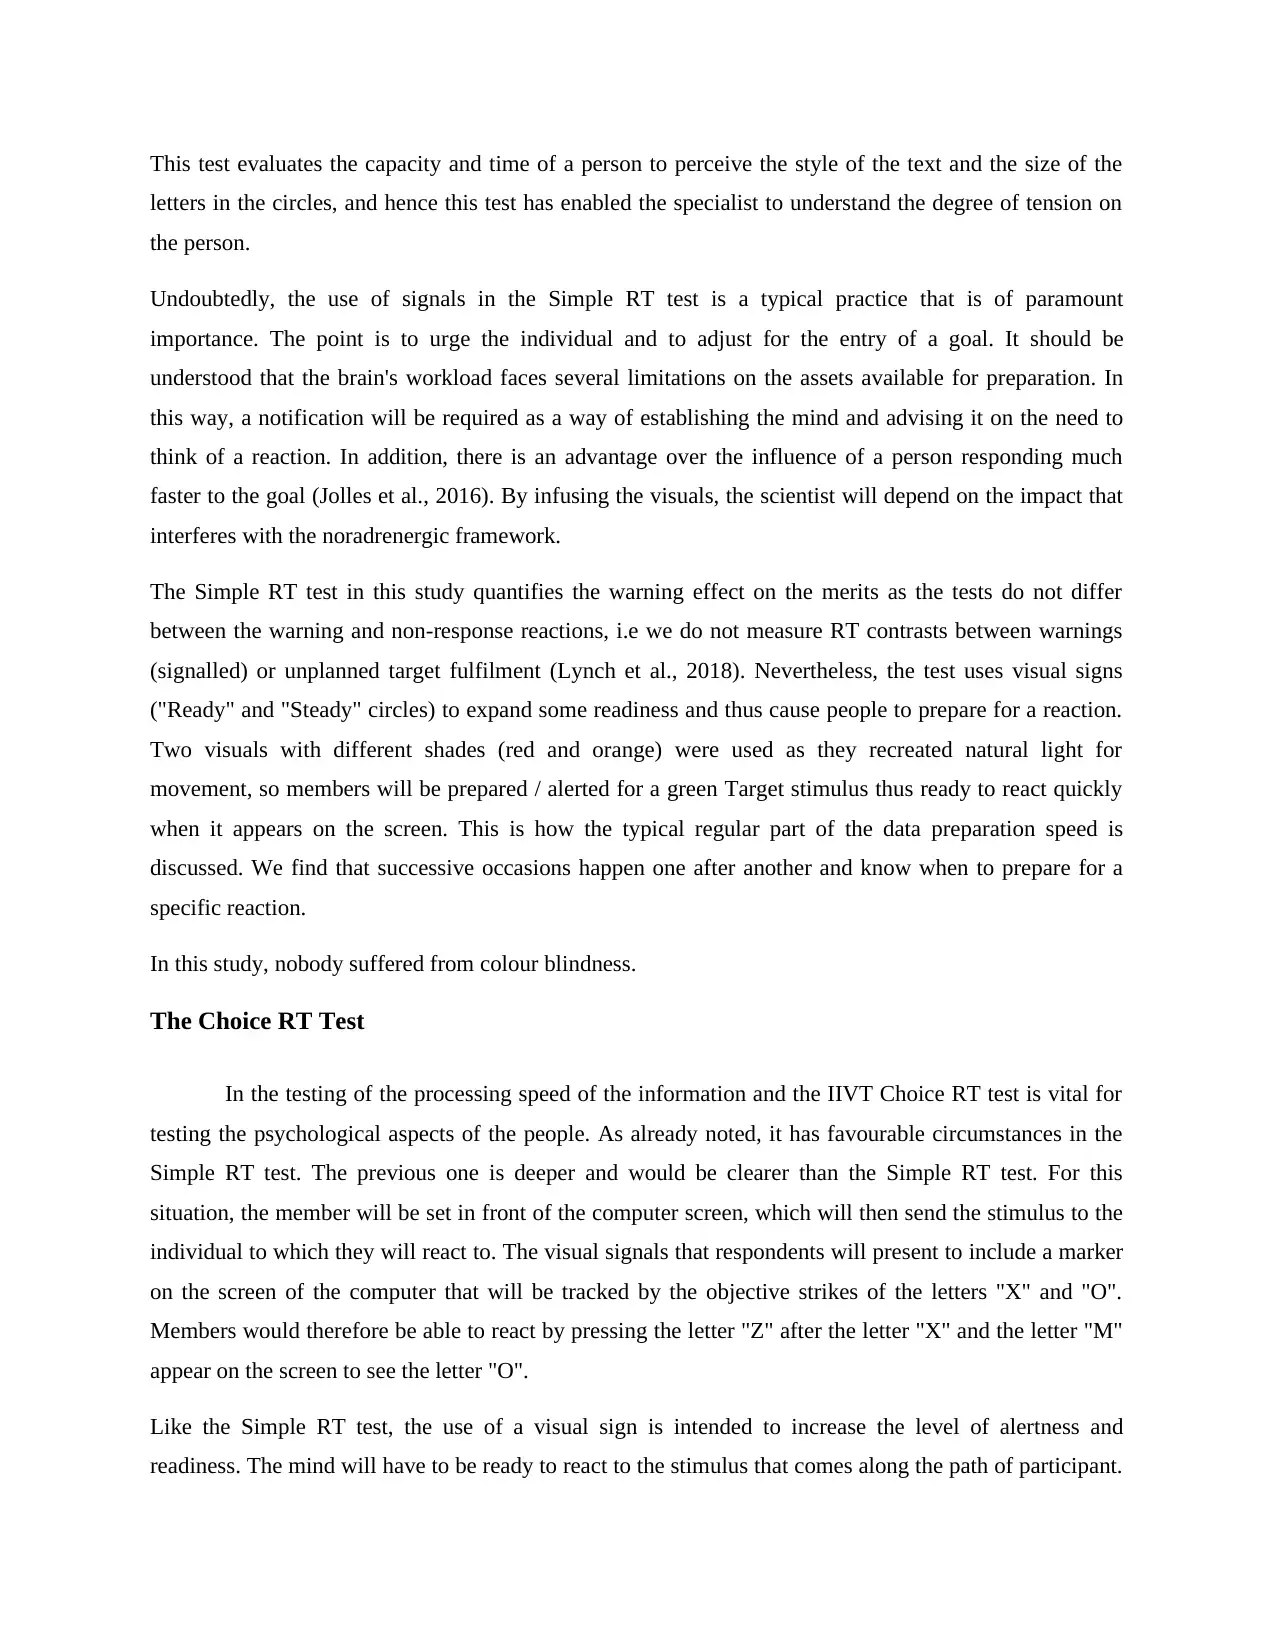
The Choice RT Test
In the testing of the processing speed of the information and the IIVT Choice RT test is vital for
testing the psychological aspects of the people. As already noted, it has favourable circumstances in the
Simple RT test. The previous one is deeper and would be clearer than the Simple RT test. For this
situation, the member will be set in front of the computer screen, which will then send the stimulus to the
individual to which they will react to. The visual signals that respondents will present to include a marker
on the screen of the computer that will be tracked by the objective strikes of the letters "X" and "O".
Members would therefore be able to react by pressing the letter "Z" after the letter "X" and the letter "M"
appear on the screen to see the letter "O".
Like the Simple RT test, the use of a visual sign is intended to increase the level of alertness and
readiness. The mind will have to be ready to react to the stimulus that comes along the path of participant.
letters in the circles, and hence this test has enabled the specialist to understand the degree of tension on
the person.
Undoubtedly, the use of signals in the Simple RT test is a typical practice that is of paramount
importance. The point is to urge the individual and to adjust for the entry of a goal. It should be
understood that the brain's workload faces several limitations on the assets available for preparation. In
this way, a notification will be required as a way of establishing the mind and advising it on the need to
think of a reaction. In addition, there is an advantage over the influence of a person responding much
faster to the goal (Jolles et al., 2016). By infusing the visuals, the scientist will depend on the impact that
interferes with the noradrenergic framework.
The Simple RT test in this study quantifies the warning effect on the merits as the tests do not differ
between the warning and non-response reactions, i.e we do not measure RT contrasts between warnings
(signalled) or unplanned target fulfilment (Lynch et al., 2018). Nevertheless, the test uses visual signs
("Ready" and "Steady" circles) to expand some readiness and thus cause people to prepare for a reaction.
Two visuals with different shades (red and orange) were used as they recreated natural light for
movement, so members will be prepared / alerted for a green Target stimulus thus ready to react quickly
when it appears on the screen. This is how the typical regular part of the data preparation speed is
discussed. We find that successive occasions happen one after another and know when to prepare for a
specific reaction.
In this study, nobody suffered from colour blindness.
The Choice RT Test
In the testing of the processing speed of the information and the IIVT Choice RT test is vital for
testing the psychological aspects of the people. As already noted, it has favourable circumstances in the
Simple RT test. The previous one is deeper and would be clearer than the Simple RT test. For this
situation, the member will be set in front of the computer screen, which will then send the stimulus to the
individual to which they will react to. The visual signals that respondents will present to include a marker
on the screen of the computer that will be tracked by the objective strikes of the letters "X" and "O".
Members would therefore be able to react by pressing the letter "Z" after the letter "X" and the letter "M"
appear on the screen to see the letter "O".
Like the Simple RT test, the use of a visual sign is intended to increase the level of alertness and
readiness. The mind will have to be ready to react to the stimulus that comes along the path of participant.
⊘ This is a preview!⊘
Do you want full access?
Subscribe today to unlock all pages.
Trusted by 1+ million students worldwide
Maintaining the appropriate level of readiness is important to ensure that one does not miss out on the
effort and responds as quickly as it would be reasonable (Jolles et al., 2016). Like the Simple RT, the
Response Time in the Choice RT is evaluated by the intermediate between the main lens location after the
screen and the time when the person responds.
While the point and reaction tool for the Simple RT and Choice RT tests continue as before, both
methodologies have internal contrasts. First of all, Choice RT requires the use of different gains, and each
accent will have a definite response. Further processing is required due to the numerous stimuli that are
shown in front of the element. Be as possible; still required to be quick just like in Simple RT.
Nonetheless, associated visual signals are designed to ensure that the member is aware of a stimulus to
which the person has to react.
One thing that should be noted for Choice RT is that it will see apparently slower reactions when it
contrasts with Simple RT. The reason should be the idea of approach. The choice of RT has different
incentives and this implies that the individual has to increase his / her mental activities. In this way there
will likely be more noticeable pressure on mental assets, which means that the random response will
inevitably be slower. In any case, we should note that it is not possible to compare specifically the two
techniques, as the impulses used are completely different.
Figure 22: Representation of the choice reaction task stimuli by responding with either the (Z) or
(M) keys.
Information processing speed and its variability using Simple RT and Choice RT tests:
Previous studies
Paraphrase This Document
Need a fresh take? Get an instant paraphrase of this document with our AI Paraphraser
-----------------------------
Related factors that could influence the RT and IIVRTas measured by the simple RT task
and choice RT task
Age and gender
Age is extremely important in providing time for people to react. Regarding the reaction time and in
addition to the anxiety, the reaction time for both genders tends to decrease from birth to the late 20's.
Since the late 20s, response time has gradually increased to the late 60s. Response time for most people
tends to experience an exponential increase when the 70's are reached. For the situation where the
individual is experiencing tension, the reaction time tends to increase (Sripada et al., 2018). Extending the
time to respond with age is based on the poor recognition of the changes in reinforcements, the
inconvenience of organizing various stimuli and the poor response to the effort (Sripada et al., 2018).
From the point of view of gender differences, it is found that men usually have a faster response time than
a female for all tasks.
Years of Education
Learning and education also influences the response time between people (Lepage et al., 2017). Through
education, people are instructed how to answer different questions and further rise. Given that the various
components remain stable, it is doubtful that the higher the training years, the shorter the response time to
the increases being instructed. This phenomenon is like a practice that requires moderately short reaction
times (Lepage et al., 2017).
Education has been further analyzed in the Simple and Choice RT tests that have both young and elderly
age groups, and advanced training is faster, contrasting with secondary and lower levels of education
(Jolles et al., 2016). However, this is not confirmed by all of the findings of the study, thus it was
proposed to carry out further studies with stress on education and determining its impact on inter-
individual variability among the Simple and Choice RT tests (Jolles et al., 2016).
Tension and depression
At the moment when a person is anxious or restless, the reaction time will be significantly affected
(Greenhouse et al., 2016). In circumstances where a person is depressed, the psychological elements of
the brain turn out to be slower and hence increased the reaction time in response to the given stimulus of
such people. Anxiety, then again, may either lead to reduced response time or extended response time
depending on the circumstances (Greenhouse et al., 2016).
Methods
The Simple RT Test (Startlights)
The stimulus was demonstrated on an Acer Precision computer running Windows XP X86 processor with
a resolution of 57 cm. Two visual instructions were displayed continuously in a dark screen on the
computer (1920 x 1080 pixels). These two characters consist of a red slider with "Ready", written inside,
and an orange shovel with "Steady" written in the middle. Following the visual signals, the goal was to
show a green altitude with "Go!" inserted in the centre [see figure 11]. Delay in the middle of each circle
looks different between each set of samples (between 1 and 4 seconds) (Jolles et al., 2016). This was
outlined with the goal that members would not forestall when each round would appear to react before the
mark appeared on the screen (Jiang et al., 2017).
Members were asked to push the button with the forefinger of their predominant hand as soon as possible
when Green's Go! appeared on the screen. The members were given five to six tests as training before the
program was restarted for primary testing (Lamb & Glazier, 2017). There were 35 tests in total. If an error
cannot be made, that is, the space interval is pressed too soon, the process will overturn until the response
has been made effectively, but no advice of the member has been given at the end of each trial, regardless
of whether the space bar was pressed accurately or inaccurately
Data analyses
For young adults and older both, all responses below 150 meters were expelled, as it was faster than
regular RT (ie, push prevention) and over 2000 meters. The program records the amount of "errors", that
⊘ This is a preview!⊘
Do you want full access?
Subscribe today to unlock all pages.
Trusted by 1+ million students worldwide
is, members who pressed the button out too soon led to re-tracking, although the number of errors did not
affect the eradication process.
The mean was determined for each person, and the team meant RT and Interquartile variation (for IIV),
calculated for both age groups. In the light of the unusual misappropriation of information, the
nonparametric SPSS study was targeted.
RESULTS
Simple Reaction Time Task (Startlights Task)
This task measures simple reaction time, overall alertness and speed through delivery of a given stimuli.
The start light task has two conditions – start light RT (response time) and task errors + IIVRT.
The Normality Tests
Based on age
A general null hypothesis states that the data has a normal distribution. Shapiro-Wilk test shows that the
Starlights RTs in older is normally distributed, p>0.05, while the Starlights RTs in the younger group
lacks a normal distribution, p<0.05.
Based on gender
The Starlights RTs in old males and young females is normally distributed, p>0.05, while the Starlights
RTs in old females and young males is not normally distributed, p<0.05.
Based on the above results from the normality test, most of the data do not follow a normal distribution,
thus, nonparametric test were appropriate for the entire analysis.
Age comparison
The average Starlights response time was lower in the young group 352.51(SD=48.54) than the older
group 384.41 (SD=65.20). Thus, the younger group was faster than the older group.
Paraphrase This Document
Need a fresh take? Get an instant paraphrase of this document with our AI Paraphraser
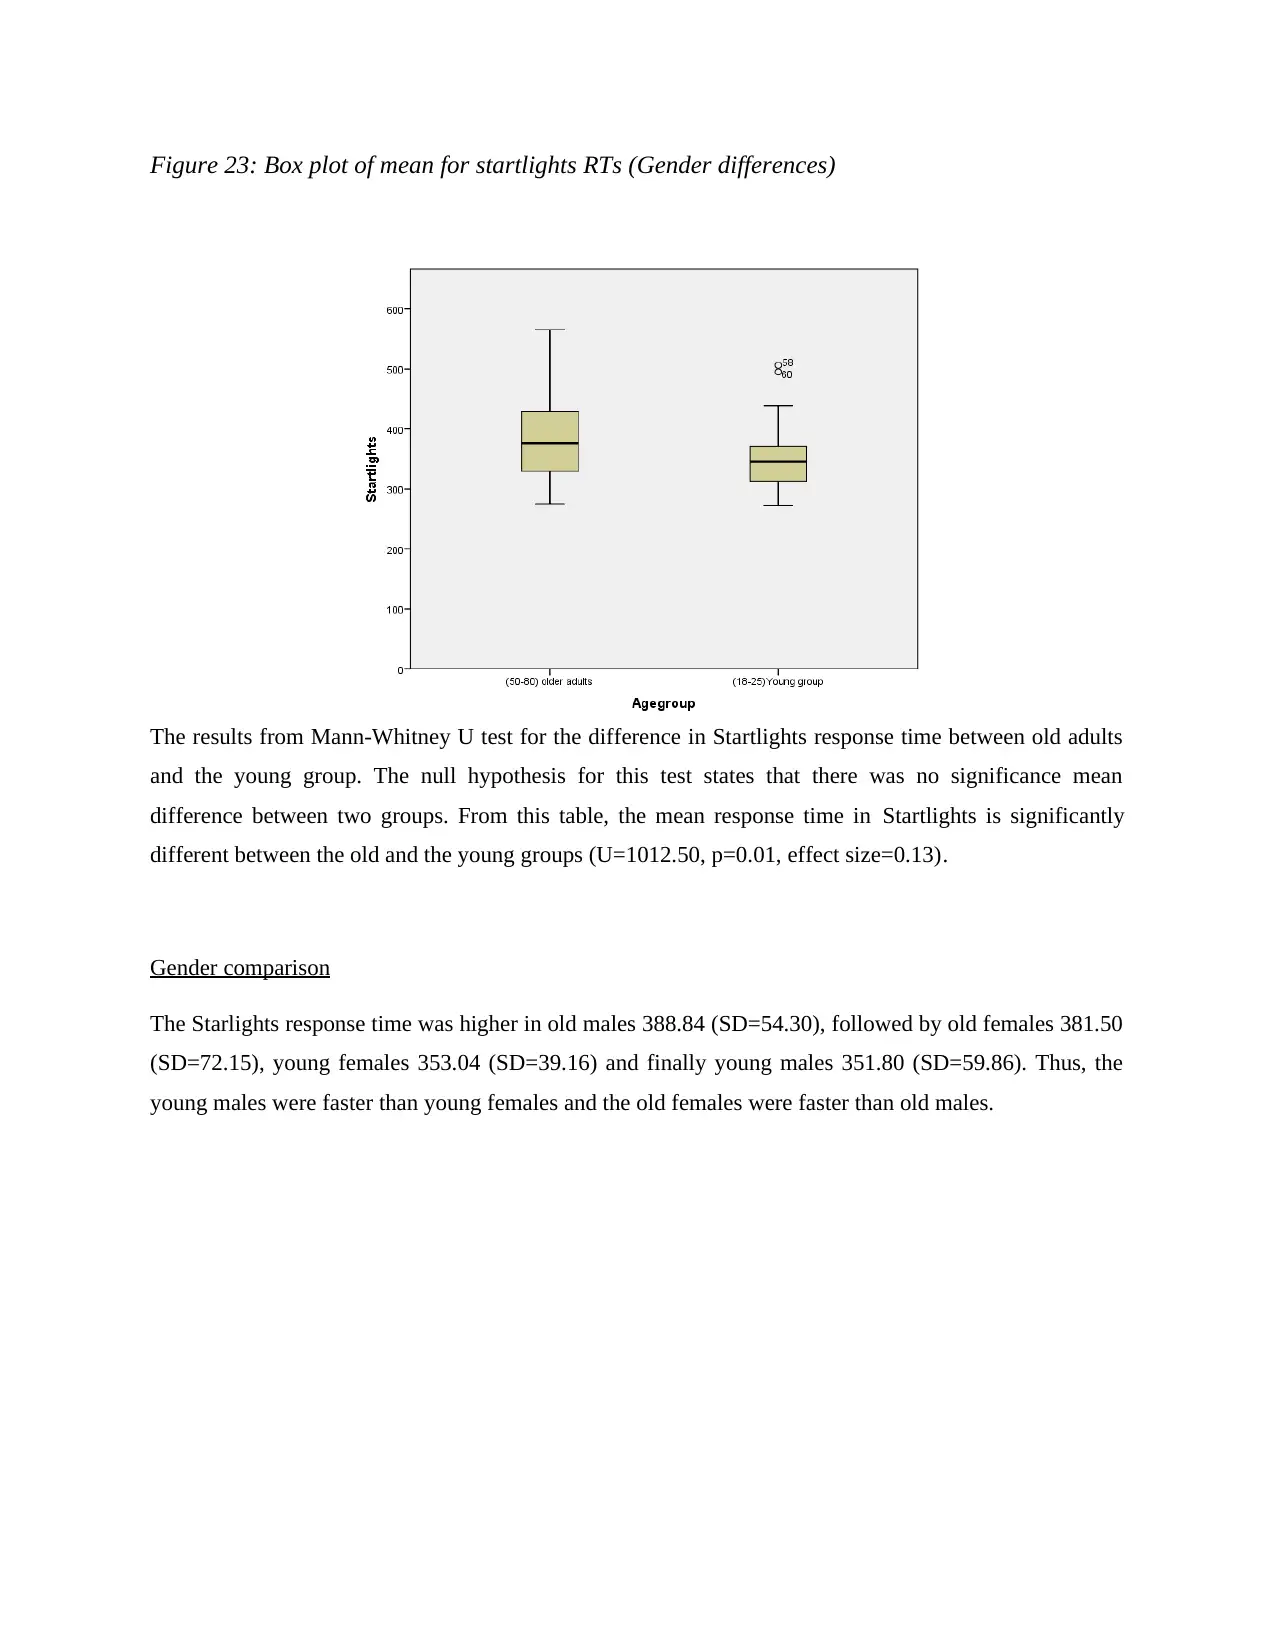
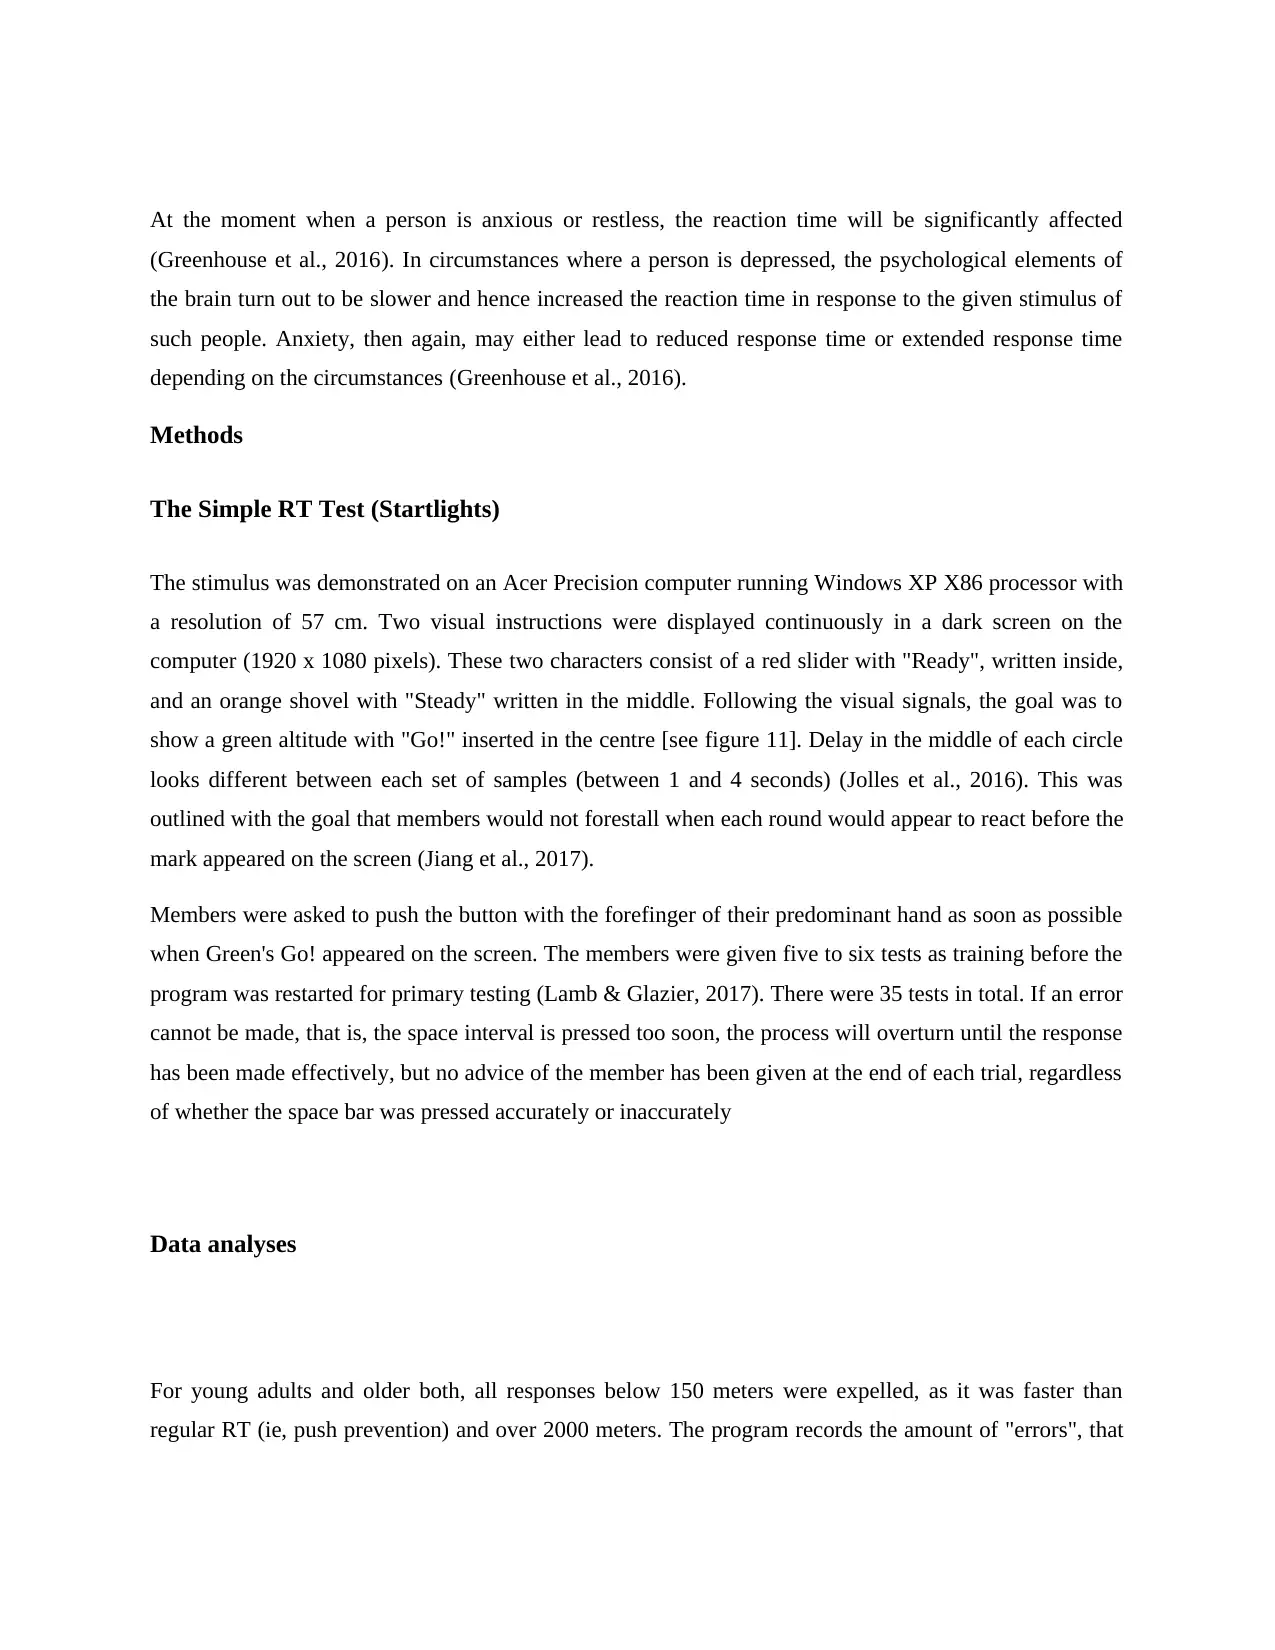
Figure 23: Box plot of mean for startlights RTs (Gender differences)
The results from Mann-Whitney U test for the difference in Startlights response time between old adults
and the young group. The null hypothesis for this test states that there was no significance mean
difference between two groups. From this table, the mean response time in Startlights is significantly
different between the old and the young groups (U=1012.50, p=0.01, effect size=0.13).
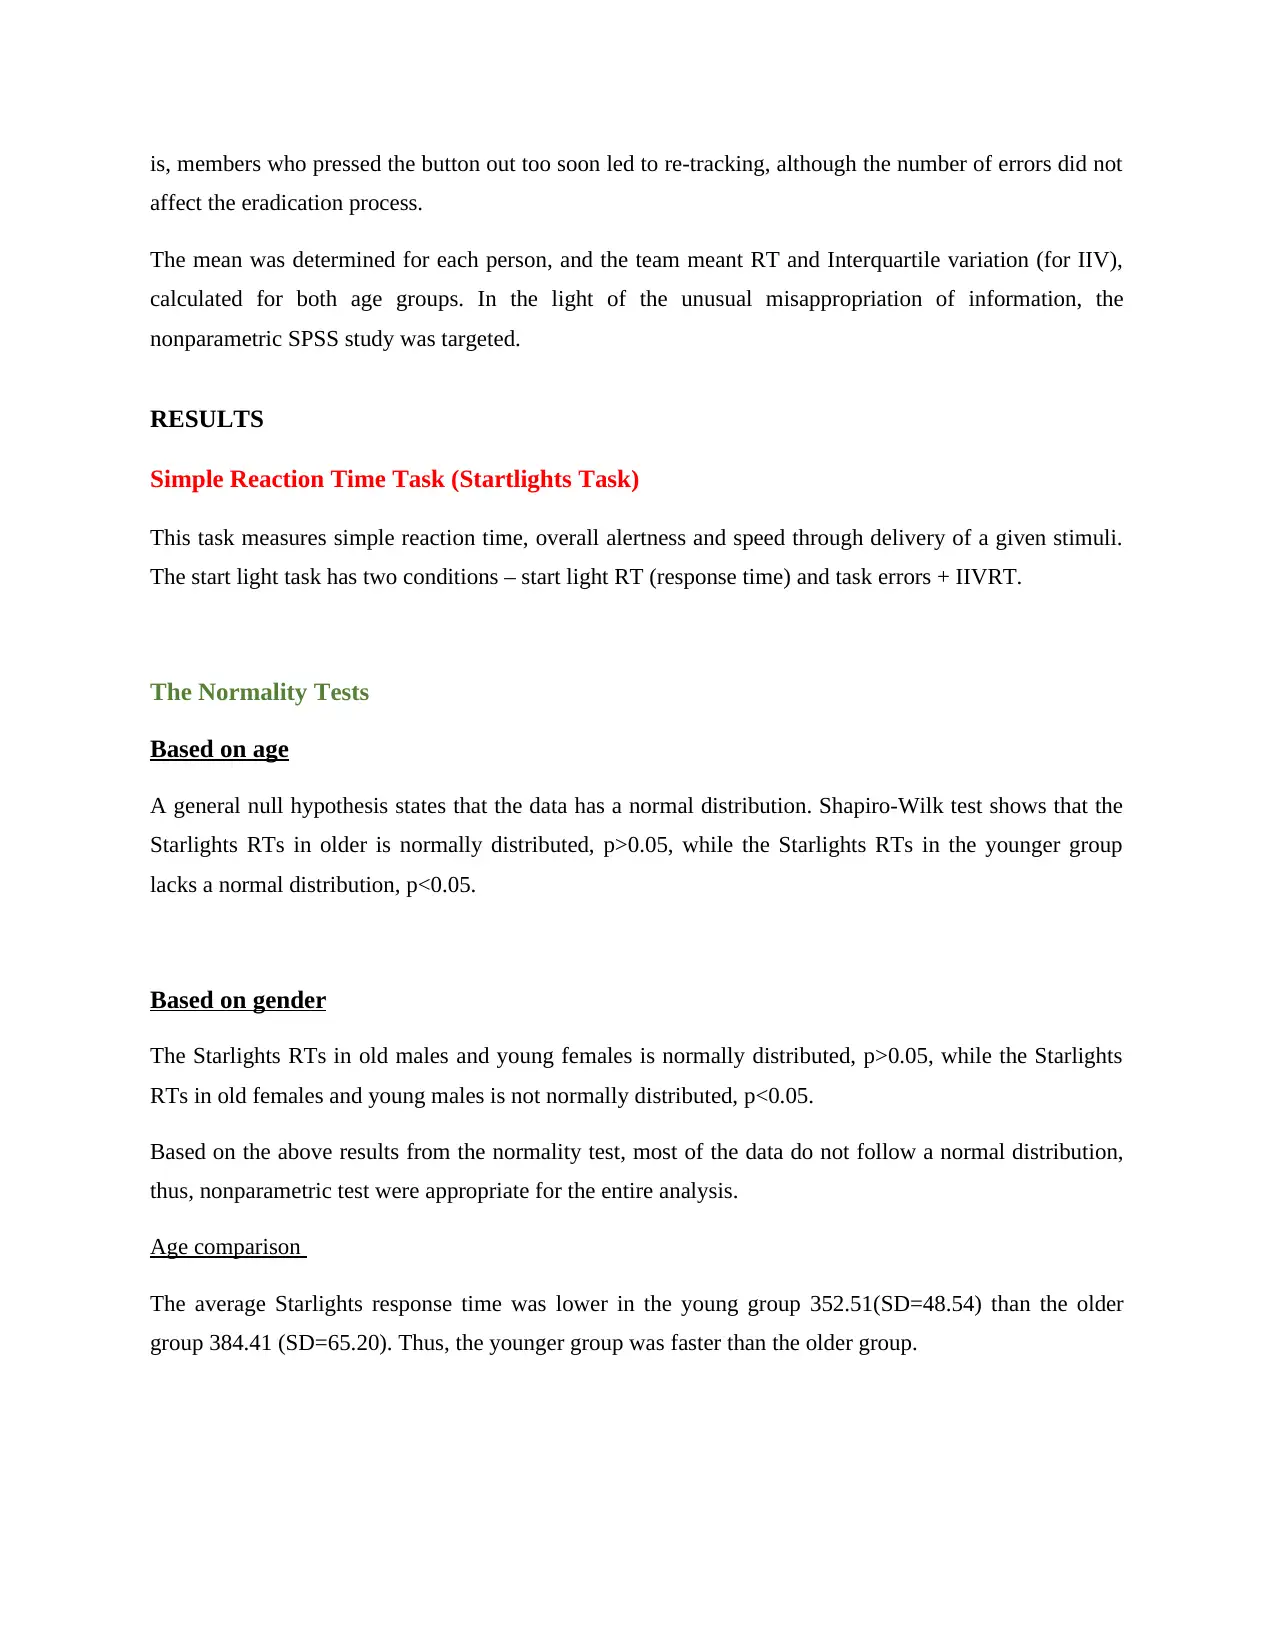
Gender comparison
The Starlights response time was higher in old males 388.84 (SD=54.30), followed by old females 381.50
(SD=72.15), young females 353.04 (SD=39.16) and finally young males 351.80 (SD=59.86). Thus, the
young males were faster than young females and the old females were faster than old males.
The results from Mann-Whitney U test for the difference in Startlights response time between old adults
and the young group. The null hypothesis for this test states that there was no significance mean
difference between two groups. From this table, the mean response time in Startlights is significantly
different between the old and the young groups (U=1012.50, p=0.01, effect size=0.13).
Gender comparison
The Starlights response time was higher in old males 388.84 (SD=54.30), followed by old females 381.50
(SD=72.15), young females 353.04 (SD=39.16) and finally young males 351.80 (SD=59.86). Thus, the
young males were faster than young females and the old females were faster than old males.
Figure 24: Box plot of mean for startlights RTs (Gender differences)
Older adults
There is no significant difference in Startlights response time between the old males and old females
(U=293.00, p=0.43, effect size=0.012).
Young adults
There is no significant difference in Startlights response time between the young males and young
females (U=296.00, p=0.29, effect size =0.021).
Startlights task IIRTV
The IQR is higher in older adults that the young group, indicating that dispersion was higher among the
older adults. For old males and old females, IQR is higher in old females than in old males, implying that
dispersion was higher in older females than males. Lastly, the IQR is higher in younger males than
younger females, indicating that dispersion was higher in younger males.
⊘ This is a preview!⊘
Do you want full access?
Subscribe today to unlock all pages.
Trusted by 1+ million students worldwide
1 out of 25
Related Documents


Your All-in-One AI-Powered Toolkit for Academic Success.
+13062052269
info@desklib.com
Available 24*7 on WhatsApp / Email
![[object Object]](/_next/static/media/star-bottom.7253800d.svg)
Unlock your academic potential
Copyright © 2020–2026 A2Z Services. All Rights Reserved. Developed and managed by ZUCOL.