ANZ Group: Analysis of Condensed Consolidated Financials, 2018
VerifiedAdded on 2023/06/04
|36
|19821
|235
Report
AI Summary
This document presents a detailed analysis of the condensed consolidated financial statements, including the income statement, statement of comprehensive income, balance sheet, cash flow statement, and statement of changes in equity. It covers the half-year financial performance of a company, highlighting key figures such as net interest income, operating income, profit after tax, and earnings per share. The report also includes a review of operations, significant events, and auditor's independence declaration. The analysis extends to the company's assets, liabilities, and equity positions, offering insights into its financial health and performance during the specified period. This student contributed document is available on Desklib, a platform offering a wide range of study resources and AI-powered tools for students.
CONDENSED CONSOLIDATED FINANCIAL STATEMENTS - TABLE OF CONTENTS
CONTENTS Page
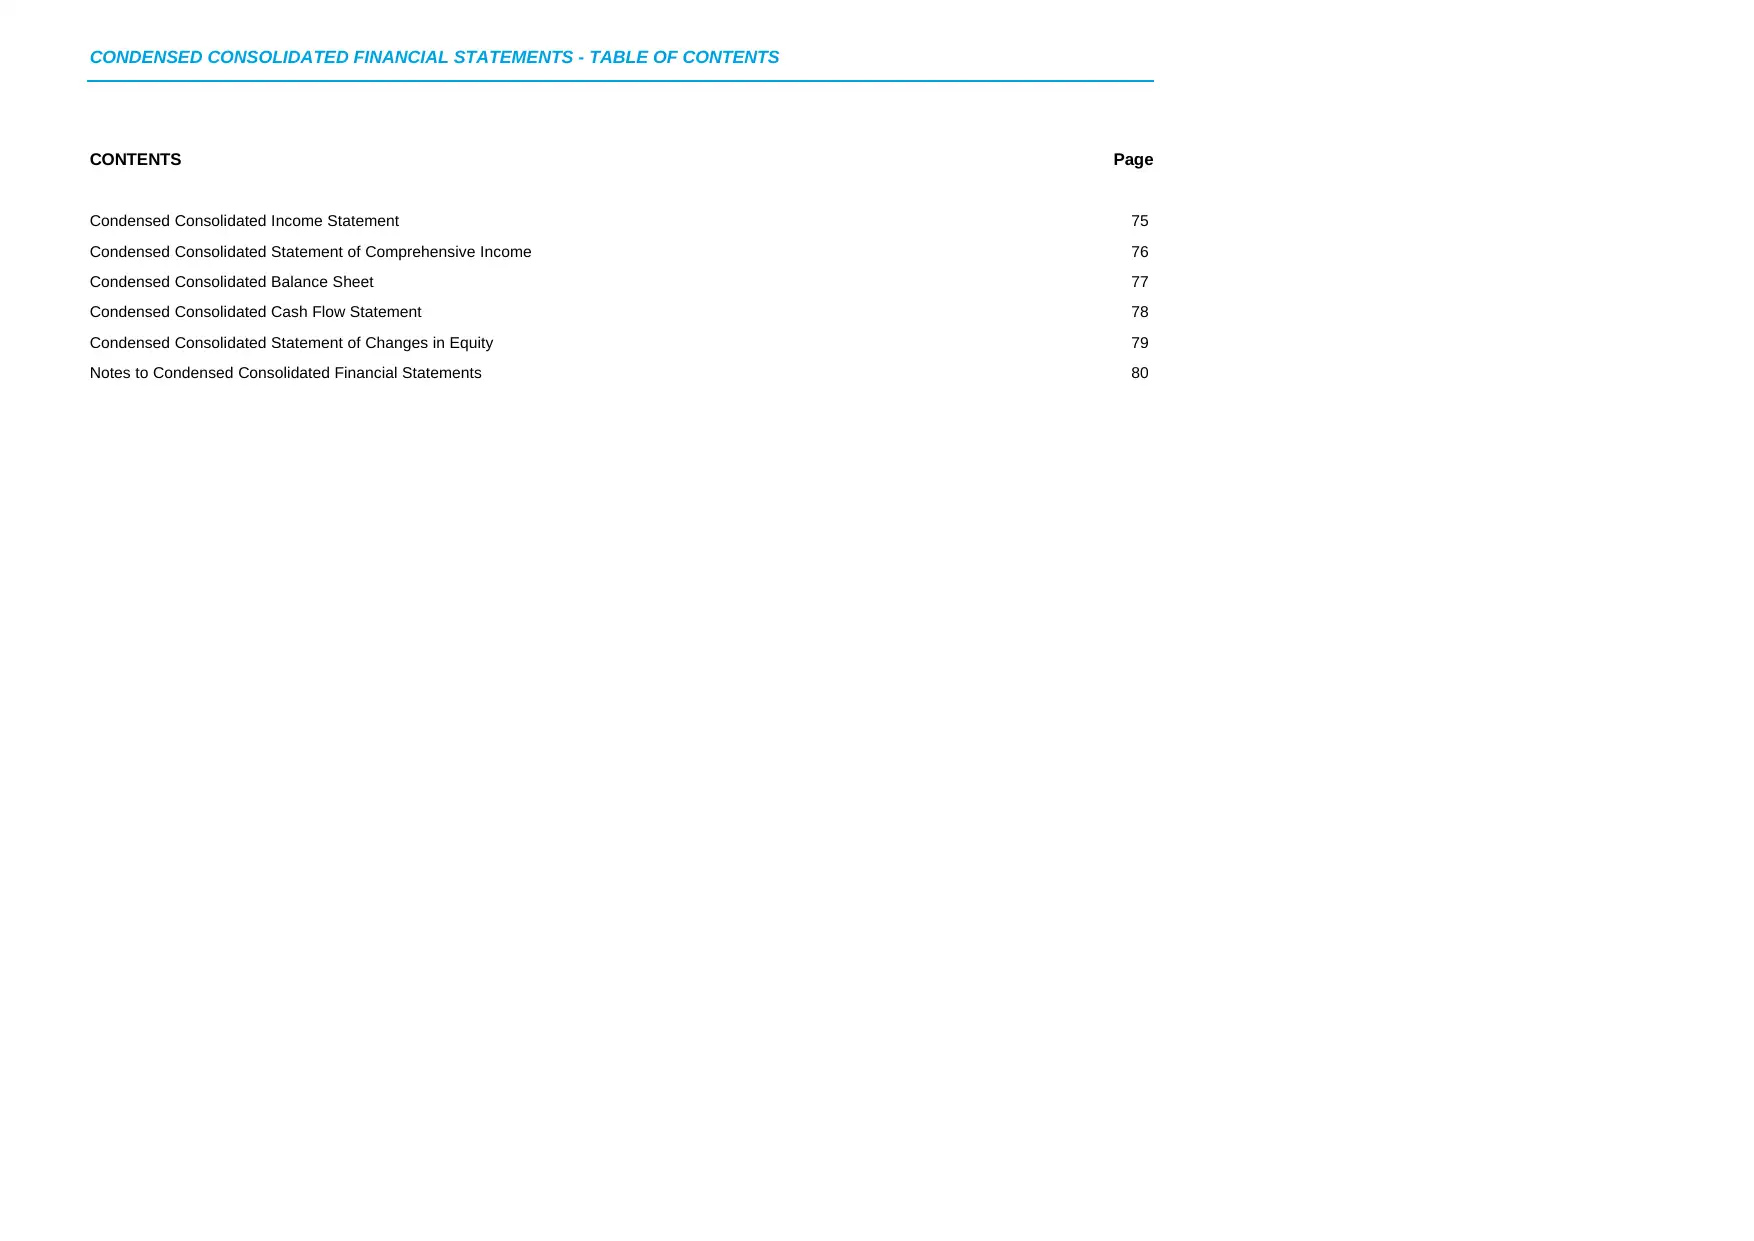
Condensed Consolidated Income Statement 75
Condensed Consolidated Statement of Comprehensive Income 76
Condensed Consolidated Balance Sheet 77
Condensed Consolidated Cash Flow Statement 78
Condensed Consolidated Statement of Changes in Equity 79
Notes to Condensed Consolidated Financial Statements 80
CONTENTS Page
Condensed Consolidated Income Statement 75
Condensed Consolidated Statement of Comprehensive Income 76
Condensed Consolidated Balance Sheet 77
Condensed Consolidated Cash Flow Statement 78
Condensed Consolidated Statement of Changes in Equity 79
Notes to Condensed Consolidated Financial Statements 80
Paraphrase This Document
Need a fresh take? Get an instant paraphrase of this document with our AI Paraphraser
DIRECTORS’ REPORT
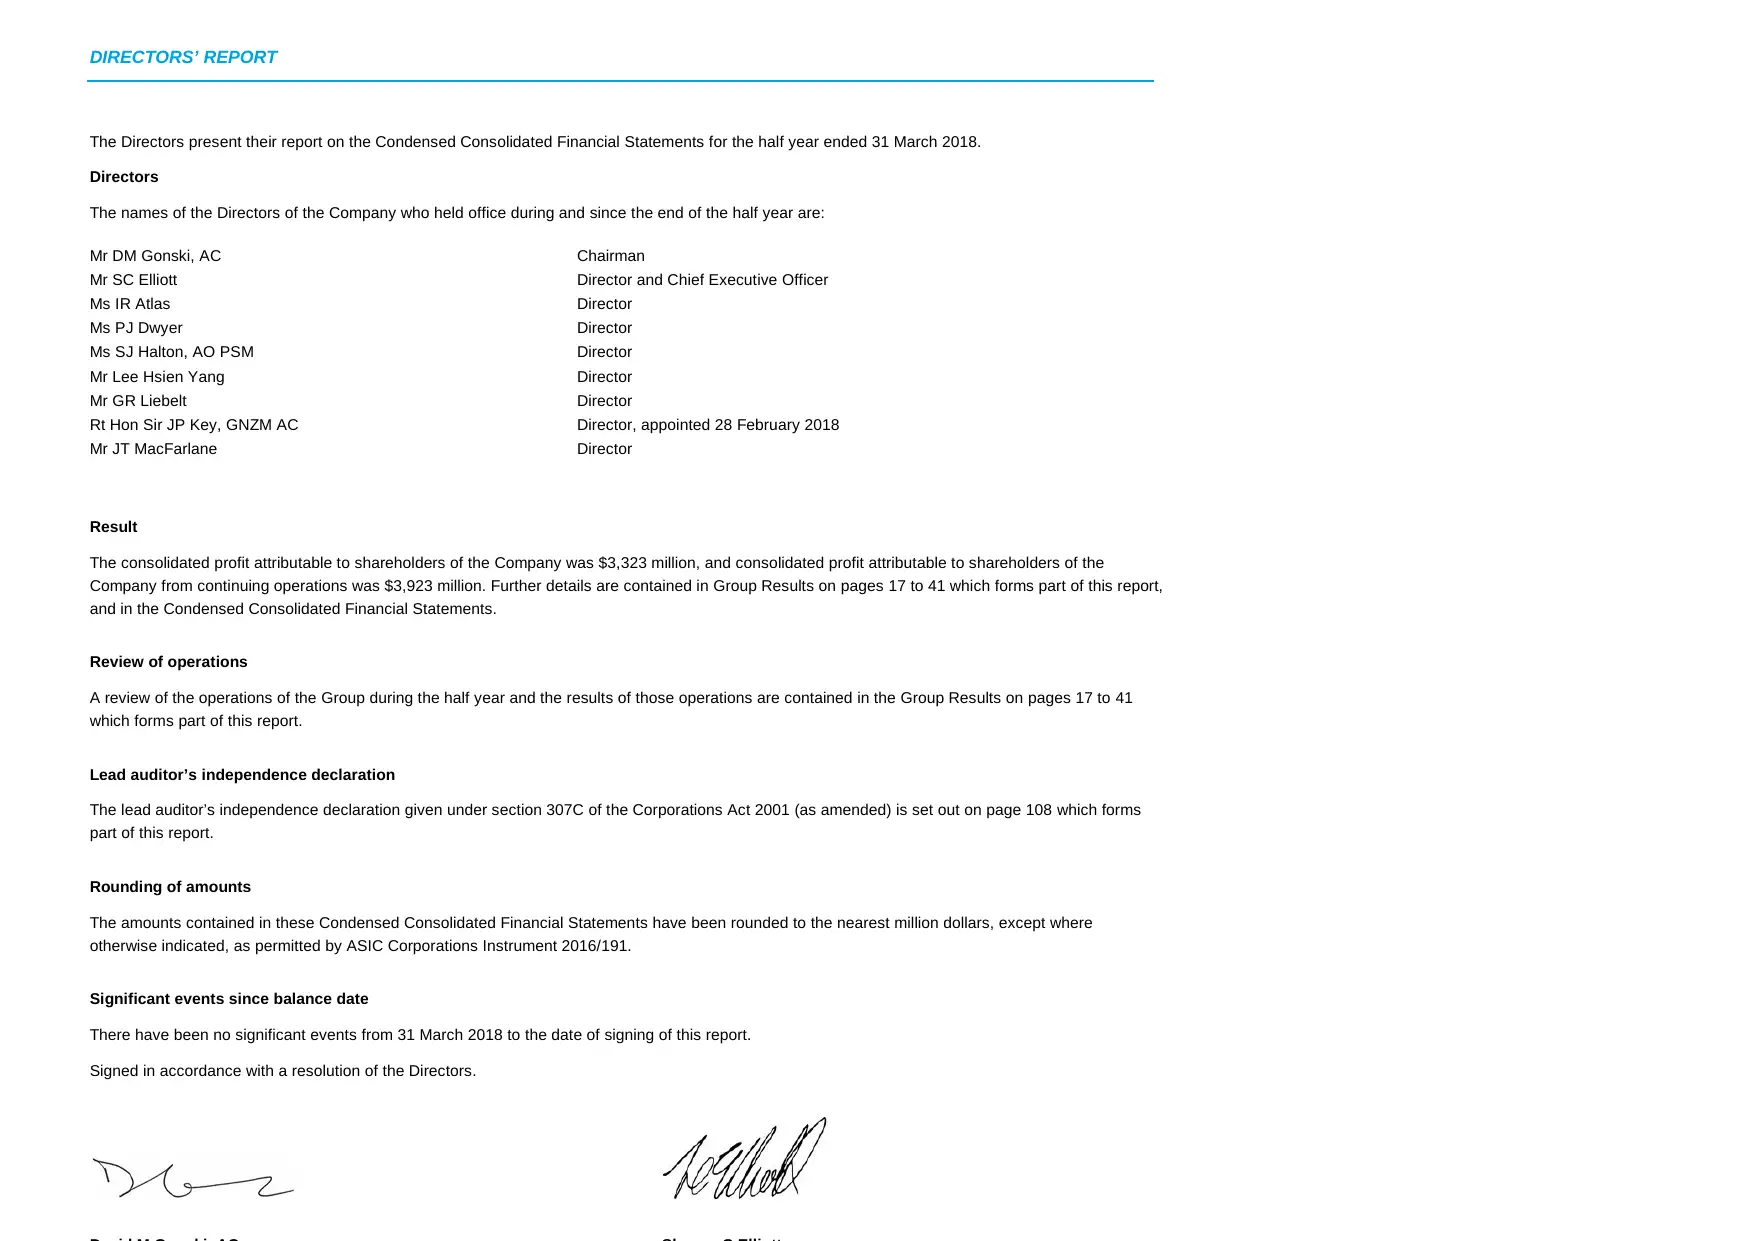
The Directors present their report on the Condensed Consolidated Financial Statements for the half year ended 31 March 2018.
Directors
The names of the Directors of the Company who held office during and since the end of the half year are:
Mr DM Gonski, AC Chairman
Mr SC Elliott Director and Chief Executive Officer
Ms IR Atlas Director
Ms PJ Dwyer Director
Ms SJ Halton, AO PSM Director
Mr Lee Hsien Yang Director
Mr GR Liebelt Director
Rt Hon Sir JP Key, GNZM AC Director, appointed 28 February 2018
Mr JT MacFarlane Director
Result
The consolidated profit attributable to shareholders of the Company was $3,323 million, and consolidated profit attributable to shareholders of the
Company from continuing operations was $3,923 million. Further details are contained in Group Results on pages 17 to 41 which forms part of this report,
and in the Condensed Consolidated Financial Statements.
Review of operations
A review of the operations of the Group during the half year and the results of those operations are contained in the Group Results on pages 17 to 41
which forms part of this report.
Lead auditor’s independence declaration
The lead auditor’s independence declaration given under section 307C of the Corporations Act 2001 (as amended) is set out on page 108 which forms
part of this report.
Rounding of amounts
The amounts contained in these Condensed Consolidated Financial Statements have been rounded to the nearest million dollars, except where
otherwise indicated, as permitted by ASIC Corporations Instrument 2016/191.
Significant events since balance date
There have been no significant events from 31 March 2018 to the date of signing of this report.
Signed in accordance with a resolution of the Directors.
CONDENSED CONSOLIDATED INCOME STATEMENT
Australia and New Zealand Banking Group Limited
Half Year1 Movement
Note
Mar 18
$M
Sep 17
$M
Mar 17
$M
Mar 18
v. Sep 17
Mar 18
v. Mar 17
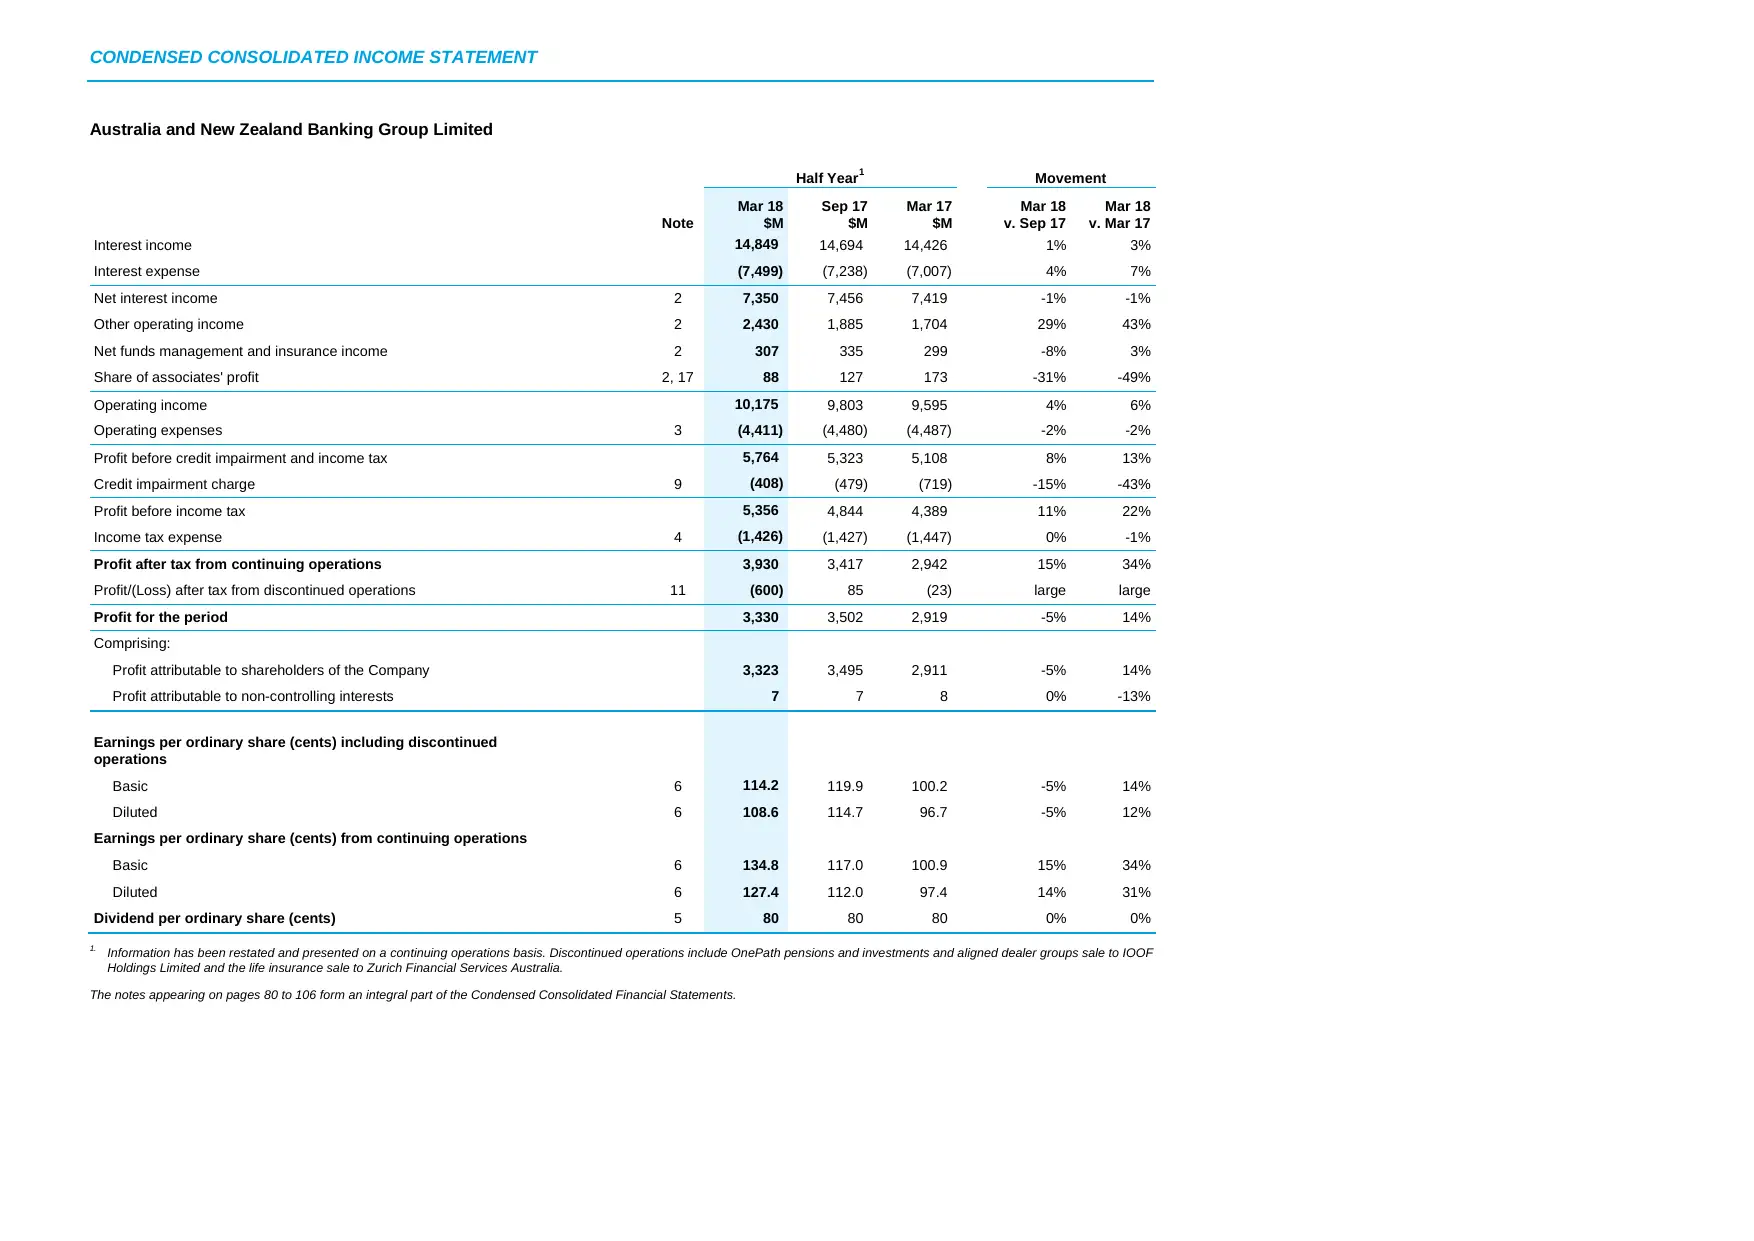
Interest income 14,849 14,694 14,426 1% 3%
Interest expense (7,499) (7,238) (7,007) 4% 7%
Net interest income 2 7,350 7,456 7,419 -1% -1%
Other operating income 2 2,430 1,885 1,704 29% 43%
Net funds management and insurance income 2 307 335 299 -8% 3%
Share of associates' profit 2, 17 88 127 173 -31% -49%
Operating income 10,175 9,803 9,595 4% 6%
Operating expenses 3 (4,411) (4,480) (4,487) -2% -2%
Profit before credit impairment and income tax 5,764 5,323 5,108 8% 13%
Credit impairment charge 9 (408) (479) (719) -15% -43%
Profit before income tax 5,356 4,844 4,389 11% 22%
Income tax expense 4 (1,426) (1,427) (1,447) 0% -1%
Profit after tax from continuing operations 3,930 3,417 2,942 15% 34%
Profit/(Loss) after tax from discontinued operations 11 (600) 85 (23) large large
Profit for the period 3,330 3,502 2,919 -5% 14%
Comprising:
Profit attributable to shareholders of the Company 3,323 3,495 2,911 -5% 14%
Profit attributable to non-controlling interests 7 7 8 0% -13%
Earnings per ordinary share (cents) including discontinued
operations
Basic 6 114.2 119.9 100.2 -5% 14%
Diluted 6 108.6 114.7 96.7 -5% 12%
Earnings per ordinary share (cents) from continuing operations
Basic 6 134.8 117.0 100.9 15% 34%
Diluted 6 127.4 112.0 97.4 14% 31%
Dividend per ordinary share (cents) 5 80 80 80 0% 0%
1. Information has been restated and presented on a continuing operations basis. Discontinued operations include OnePath pensions and investments and aligned dealer groups sale to IOOF
Holdings Limited and the life insurance sale to Zurich Financial Services Australia.
The notes appearing on pages 80 to 106 form an integral part of the Condensed Consolidated Financial Statements.
Australia and New Zealand Banking Group Limited
Half Year1 Movement
Note
Mar 18
$M
Sep 17
$M
Mar 17
$M
Mar 18
v. Sep 17
Mar 18
v. Mar 17
Interest income 14,849 14,694 14,426 1% 3%
Interest expense (7,499) (7,238) (7,007) 4% 7%
Net interest income 2 7,350 7,456 7,419 -1% -1%
Other operating income 2 2,430 1,885 1,704 29% 43%
Net funds management and insurance income 2 307 335 299 -8% 3%
Share of associates' profit 2, 17 88 127 173 -31% -49%
Operating income 10,175 9,803 9,595 4% 6%
Operating expenses 3 (4,411) (4,480) (4,487) -2% -2%
Profit before credit impairment and income tax 5,764 5,323 5,108 8% 13%
Credit impairment charge 9 (408) (479) (719) -15% -43%
Profit before income tax 5,356 4,844 4,389 11% 22%
Income tax expense 4 (1,426) (1,427) (1,447) 0% -1%
Profit after tax from continuing operations 3,930 3,417 2,942 15% 34%
Profit/(Loss) after tax from discontinued operations 11 (600) 85 (23) large large
Profit for the period 3,330 3,502 2,919 -5% 14%
Comprising:
Profit attributable to shareholders of the Company 3,323 3,495 2,911 -5% 14%
Profit attributable to non-controlling interests 7 7 8 0% -13%
Earnings per ordinary share (cents) including discontinued
operations
Basic 6 114.2 119.9 100.2 -5% 14%
Diluted 6 108.6 114.7 96.7 -5% 12%
Earnings per ordinary share (cents) from continuing operations
Basic 6 134.8 117.0 100.9 15% 34%
Diluted 6 127.4 112.0 97.4 14% 31%
Dividend per ordinary share (cents) 5 80 80 80 0% 0%
1. Information has been restated and presented on a continuing operations basis. Discontinued operations include OnePath pensions and investments and aligned dealer groups sale to IOOF
Holdings Limited and the life insurance sale to Zurich Financial Services Australia.
The notes appearing on pages 80 to 106 form an integral part of the Condensed Consolidated Financial Statements.
⊘ This is a preview!⊘
Do you want full access?
Subscribe today to unlock all pages.
Trusted by 1+ million students worldwide
CONDENSED CONSOLIDATED STATEMENT OF COMPREHENSIVE INCOME
Australia and New Zealand Banking Group Limited
Half Year1 Movement
Mar 18
$M
Sep 17
$M
Mar 17
$M
Mar 18
v Sep 17
Mar 18
v Mar 17
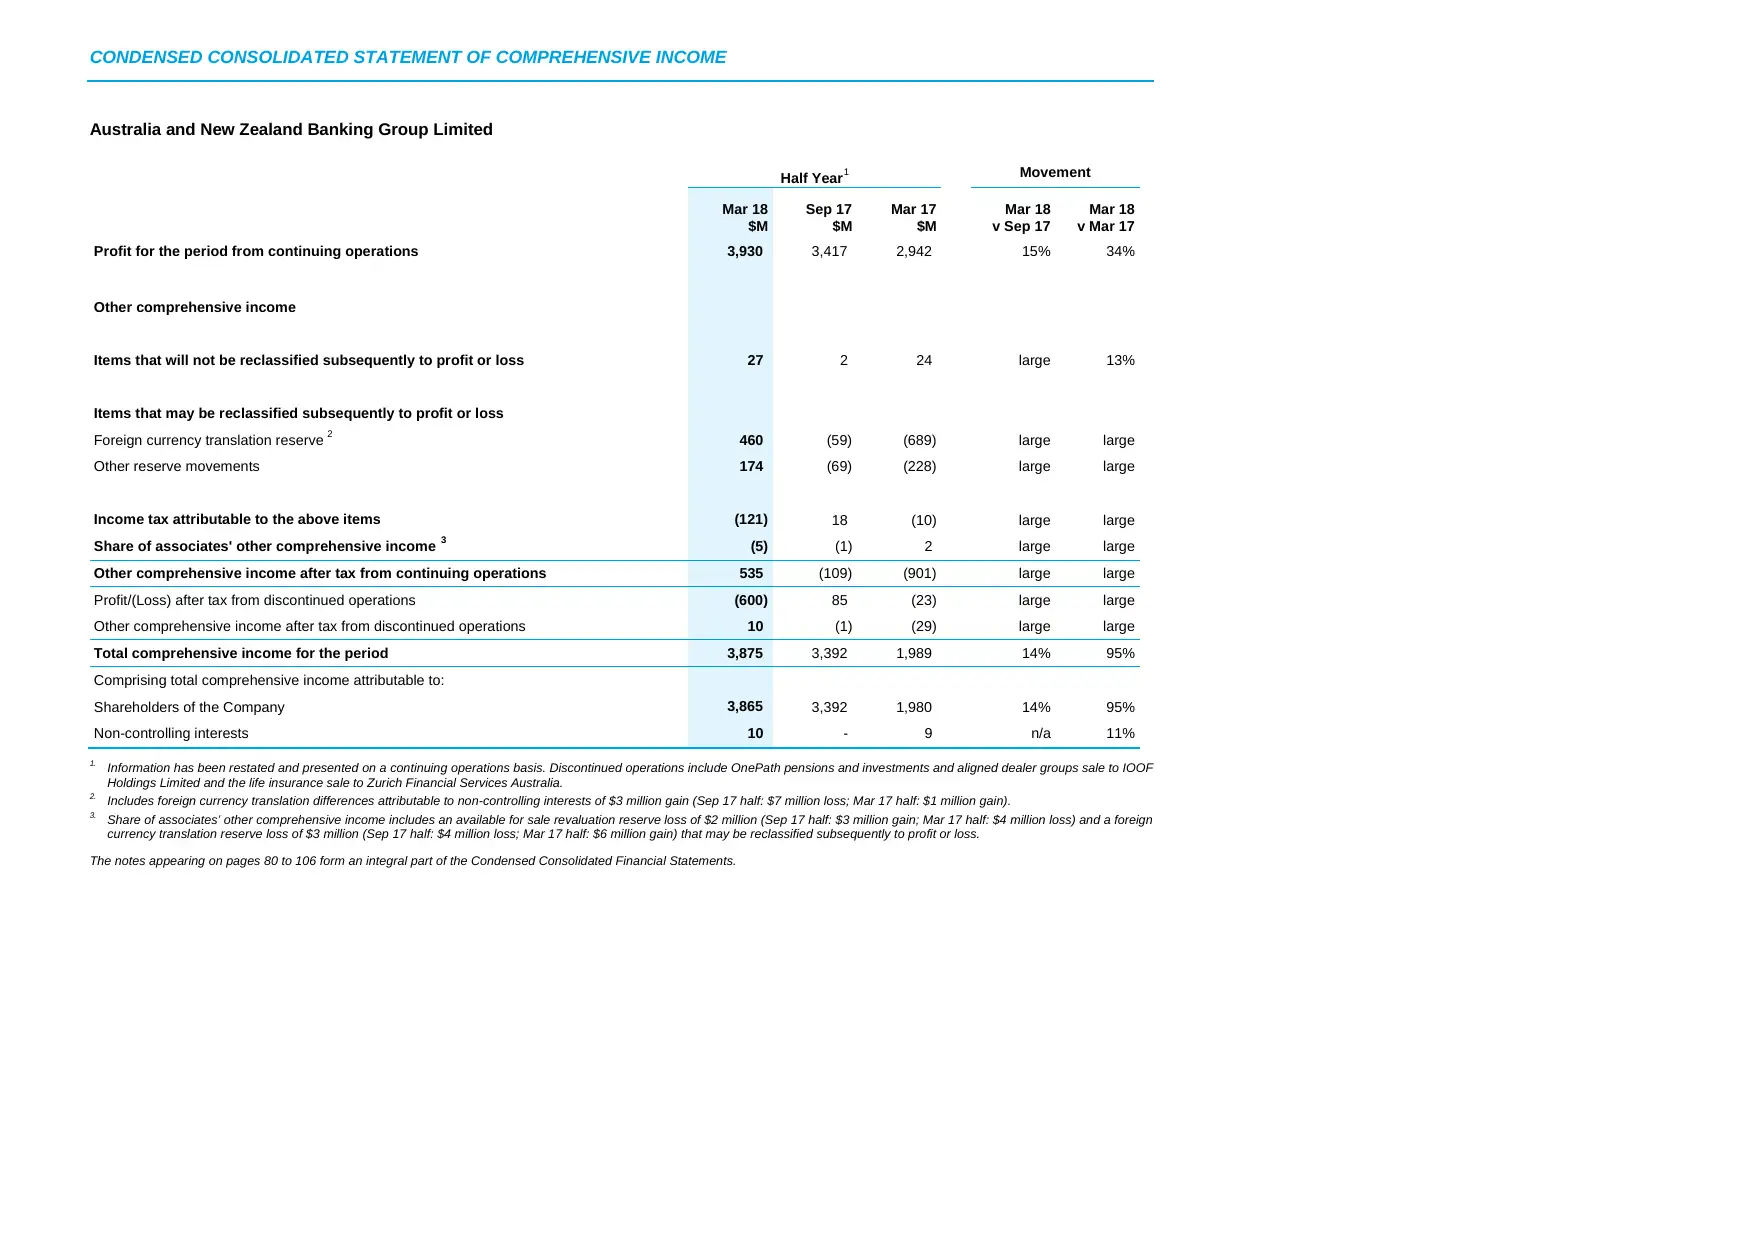
Profit for the period from continuing operations 3,930 3,417 2,942 15% 34%
Other comprehensive income
Items that will not be reclassified subsequently to profit or loss 27 2 24 large 13%
Items that may be reclassified subsequently to profit or loss
Foreign currency translation reserve 2 460 (59) (689) large large
Other reserve movements 174 (69) (228) large large
Income tax attributable to the above items (121) 18 (10) large large
Share of associates' other comprehensive income 3 (5) (1) 2 large large
Other comprehensive income after tax from continuing operations 535 (109) (901) large large
Profit/(Loss) after tax from discontinued operations (600) 85 (23) large large
Other comprehensive income after tax from discontinued operations 10 (1) (29) large large
Total comprehensive income for the period 3,875 3,392 1,989 14% 95%
Comprising total comprehensive income attributable to:
Shareholders of the Company 3,865 3,392 1,980 14% 95%
Non-controlling interests 10 - 9 n/a 11%
1. Information has been restated and presented on a continuing operations basis. Discontinued operations include OnePath pensions and investments and aligned dealer groups sale to IOOF
Holdings Limited and the life insurance sale to Zurich Financial Services Australia.
2. Includes foreign currency translation differences attributable to non-controlling interests of $3 million gain (Sep 17 half: $7 million loss; Mar 17 half: $1 million gain).
3. Share of associates’ other comprehensive income includes an available for sale revaluation reserve loss of $2 million (Sep 17 half: $3 million gain; Mar 17 half: $4 million loss) and a foreign
currency translation reserve loss of $3 million (Sep 17 half: $4 million loss; Mar 17 half: $6 million gain) that may be reclassified subsequently to profit or loss.
The notes appearing on pages 80 to 106 form an integral part of the Condensed Consolidated Financial Statements.
Australia and New Zealand Banking Group Limited
Half Year1 Movement
Mar 18
$M
Sep 17
$M
Mar 17
$M
Mar 18
v Sep 17
Mar 18
v Mar 17
Profit for the period from continuing operations 3,930 3,417 2,942 15% 34%
Other comprehensive income
Items that will not be reclassified subsequently to profit or loss 27 2 24 large 13%
Items that may be reclassified subsequently to profit or loss
Foreign currency translation reserve 2 460 (59) (689) large large
Other reserve movements 174 (69) (228) large large
Income tax attributable to the above items (121) 18 (10) large large
Share of associates' other comprehensive income 3 (5) (1) 2 large large
Other comprehensive income after tax from continuing operations 535 (109) (901) large large
Profit/(Loss) after tax from discontinued operations (600) 85 (23) large large
Other comprehensive income after tax from discontinued operations 10 (1) (29) large large
Total comprehensive income for the period 3,875 3,392 1,989 14% 95%
Comprising total comprehensive income attributable to:
Shareholders of the Company 3,865 3,392 1,980 14% 95%
Non-controlling interests 10 - 9 n/a 11%
1. Information has been restated and presented on a continuing operations basis. Discontinued operations include OnePath pensions and investments and aligned dealer groups sale to IOOF
Holdings Limited and the life insurance sale to Zurich Financial Services Australia.
2. Includes foreign currency translation differences attributable to non-controlling interests of $3 million gain (Sep 17 half: $7 million loss; Mar 17 half: $1 million gain).
3. Share of associates’ other comprehensive income includes an available for sale revaluation reserve loss of $2 million (Sep 17 half: $3 million gain; Mar 17 half: $4 million loss) and a foreign
currency translation reserve loss of $3 million (Sep 17 half: $4 million loss; Mar 17 half: $6 million gain) that may be reclassified subsequently to profit or loss.
The notes appearing on pages 80 to 106 form an integral part of the Condensed Consolidated Financial Statements.
Paraphrase This Document
Need a fresh take? Get an instant paraphrase of this document with our AI Paraphraser
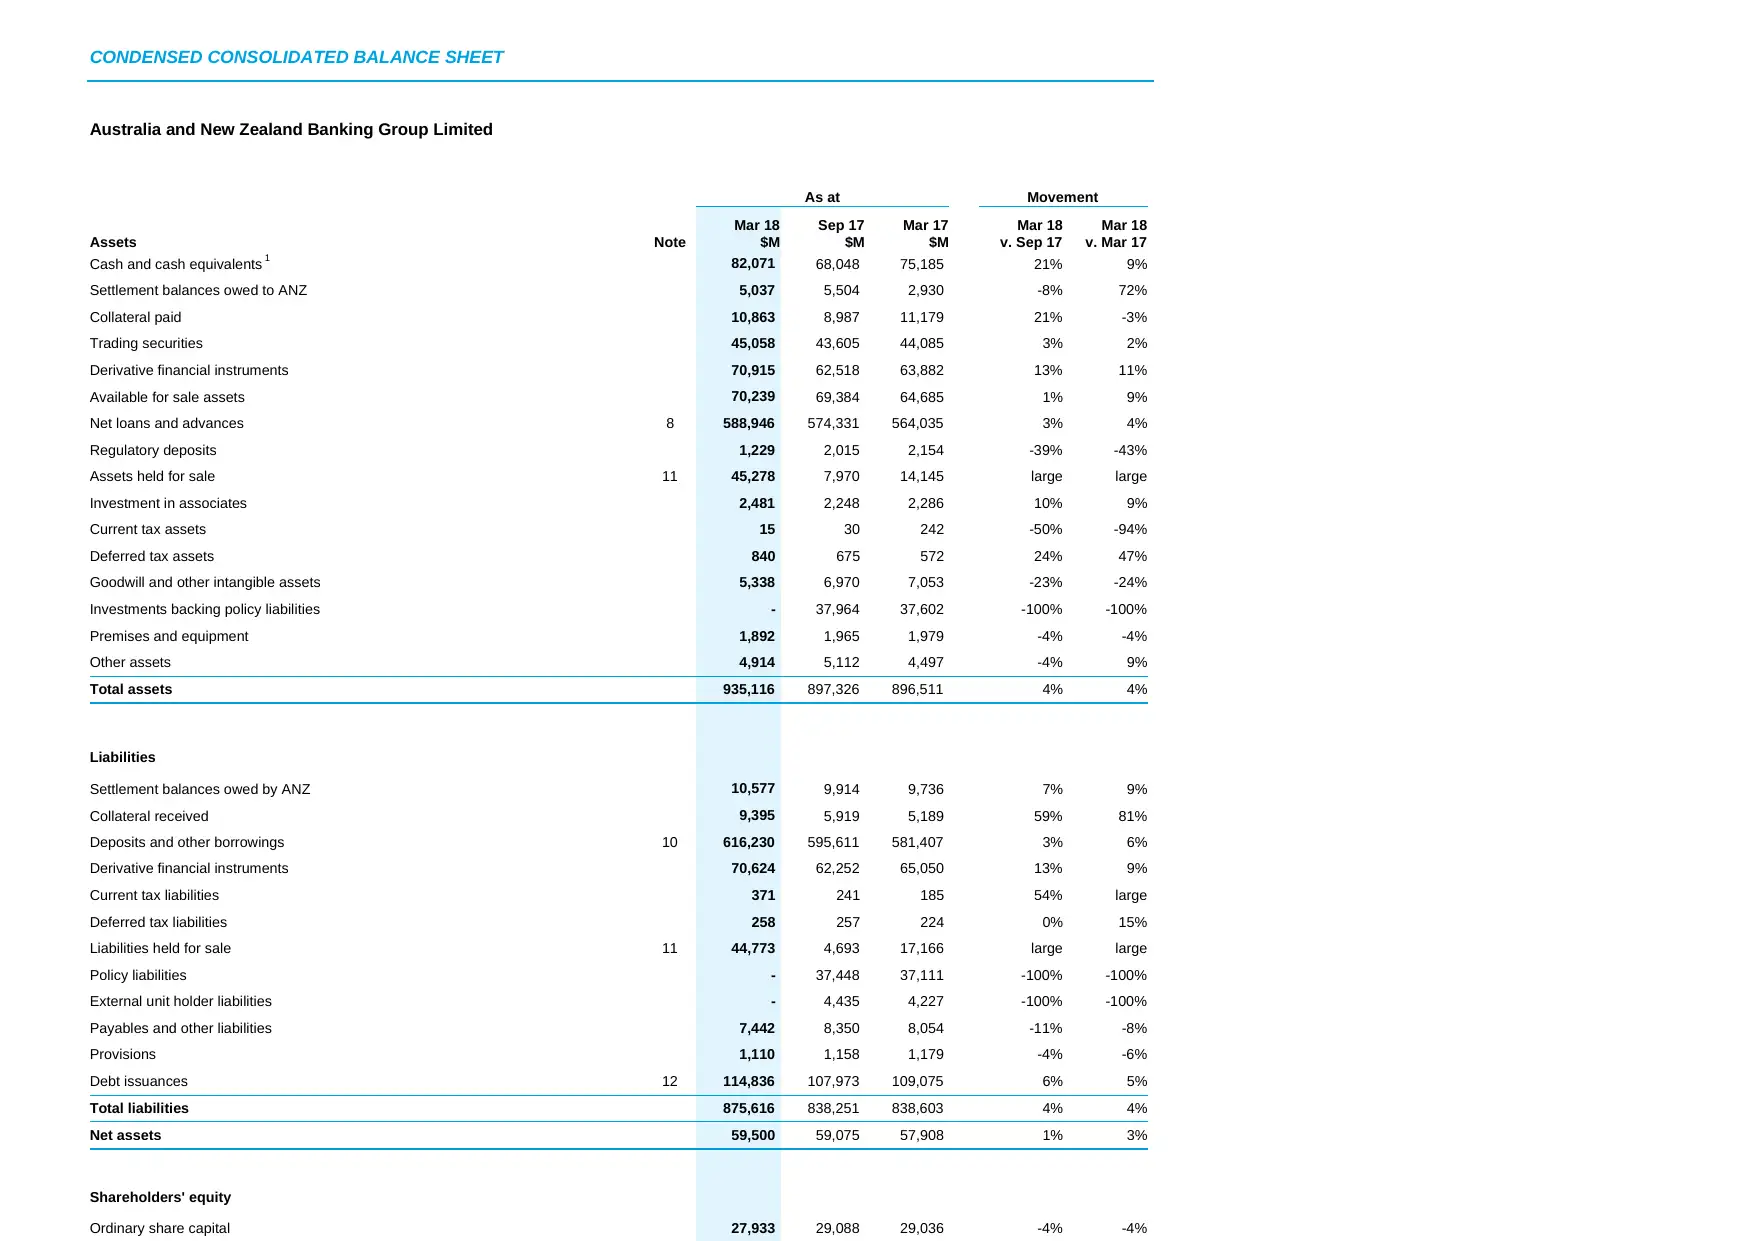
CONDENSED CONSOLIDATED BALANCE SHEET
Australia and New Zealand Banking Group Limited
As at Movement
Assets Note
Mar 18
$M
Sep 17
$M
Mar 17
$M
Mar 18
v. Sep 17
Mar 18
v. Mar 17
Cash and cash equivalents 1 82,071 68,048 75,185 21% 9%
Settlement balances owed to ANZ 5,037 5,504 2,930 -8% 72%
Collateral paid 10,863 8,987 11,179 21% -3%
Trading securities 45,058 43,605 44,085 3% 2%
Derivative financial instruments 70,915 62,518 63,882 13% 11%
Available for sale assets 70,239 69,384 64,685 1% 9%
Net loans and advances 8 588,946 574,331 564,035 3% 4%
Regulatory deposits 1,229 2,015 2,154 -39% -43%
Assets held for sale 11 45,278 7,970 14,145 large large
Investment in associates 2,481 2,248 2,286 10% 9%
Current tax assets 15 30 242 -50% -94%
Deferred tax assets 840 675 572 24% 47%
Goodwill and other intangible assets 5,338 6,970 7,053 -23% -24%
Investments backing policy liabilities - 37,964 37,602 -100% -100%
Premises and equipment 1,892 1,965 1,979 -4% -4%
Other assets 4,914 5,112 4,497 -4% 9%
Total assets 935,116 897,326 896,511 4% 4%
Liabilities
Settlement balances owed by ANZ 10,577 9,914 9,736 7% 9%
Collateral received 9,395 5,919 5,189 59% 81%
Deposits and other borrowings 10 616,230 595,611 581,407 3% 6%
Derivative financial instruments 70,624 62,252 65,050 13% 9%
Current tax liabilities 371 241 185 54% large
Deferred tax liabilities 258 257 224 0% 15%
Liabilities held for sale 11 44,773 4,693 17,166 large large
Policy liabilities - 37,448 37,111 -100% -100%
External unit holder liabilities - 4,435 4,227 -100% -100%
Payables and other liabilities 7,442 8,350 8,054 -11% -8%
Provisions 1,110 1,158 1,179 -4% -6%
Debt issuances 12 114,836 107,973 109,075 6% 5%
Total liabilities 875,616 838,251 838,603 4% 4%
Net assets 59,500 59,075 57,908 1% 3%
Shareholders' equity
Ordinary share capital 27,933 29,088 29,036 -4% -4%
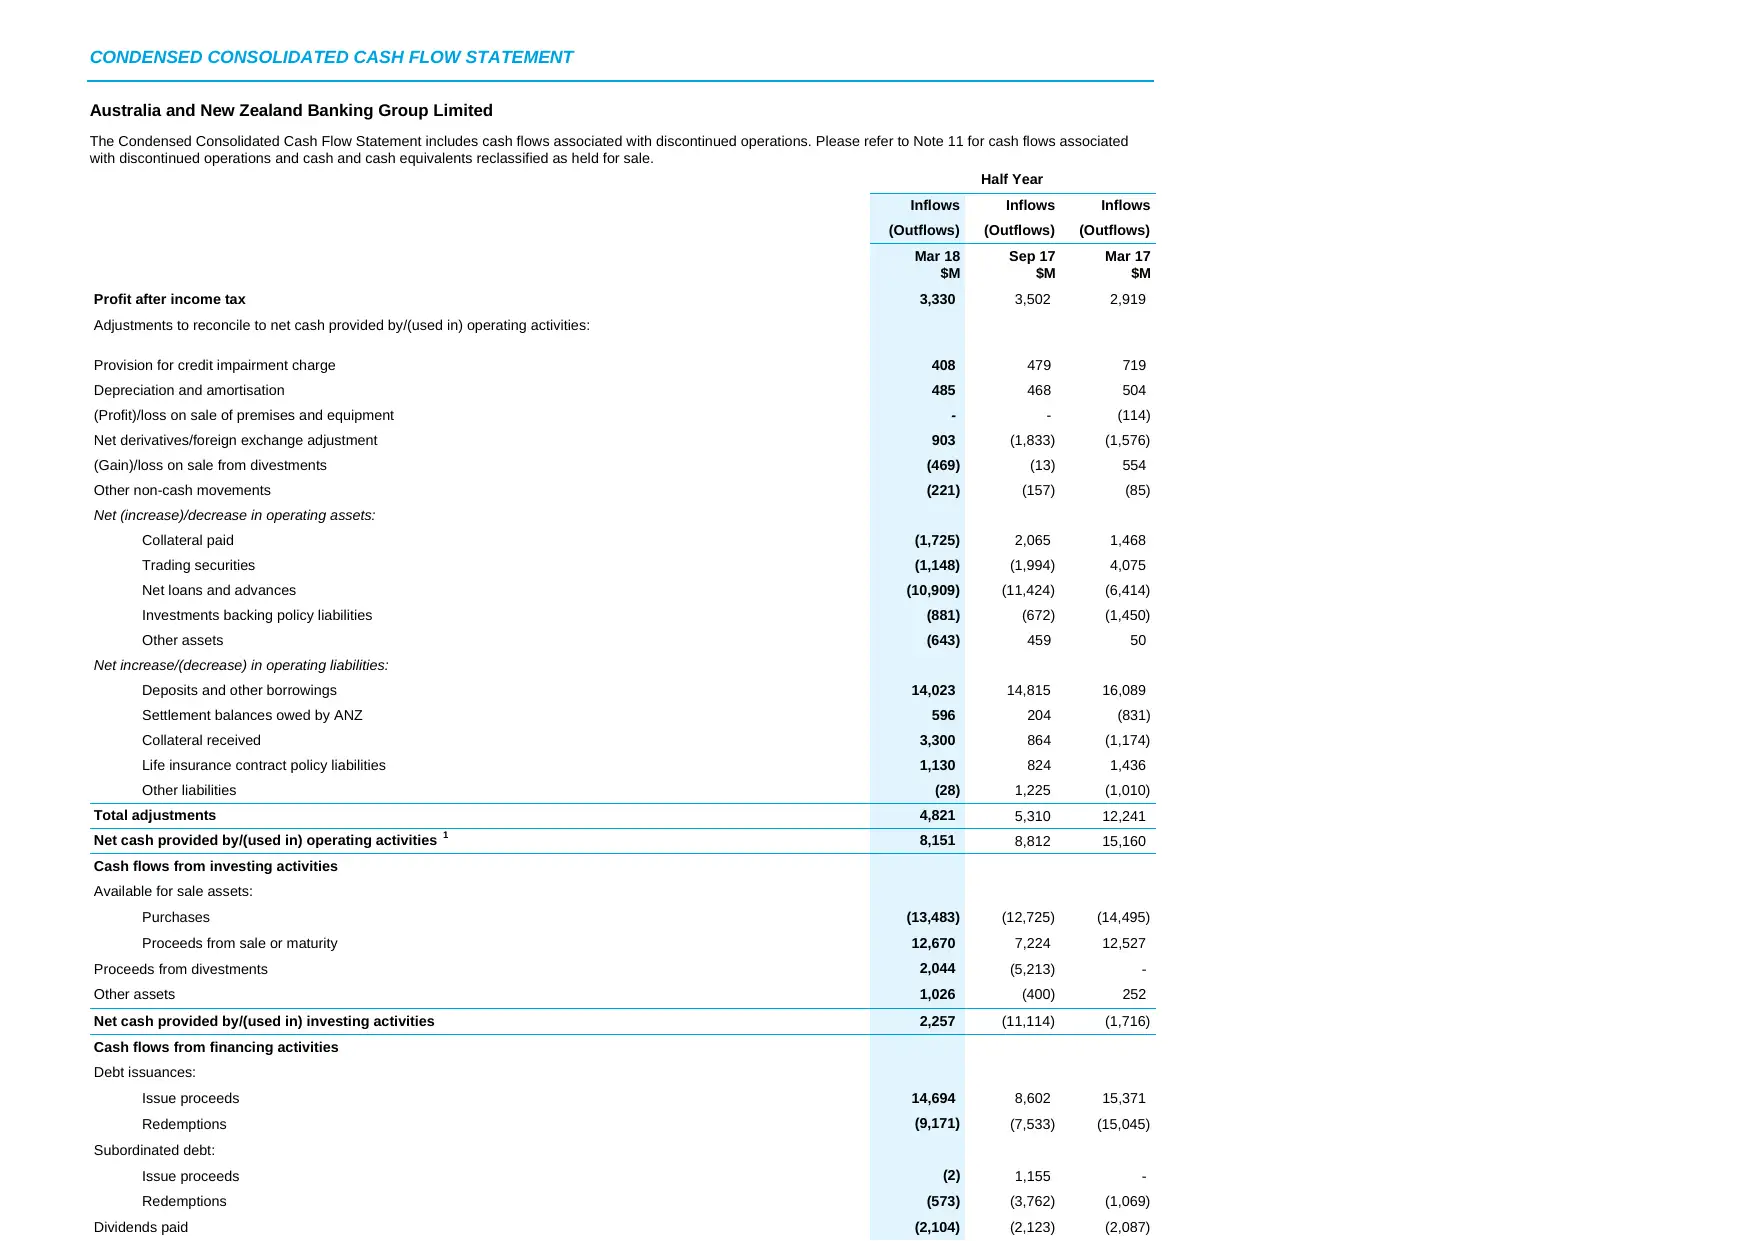
CONDENSED CONSOLIDATED CASH FLOW STATEMENT
Australia and New Zealand Banking Group Limited
The Condensed Consolidated Cash Flow Statement includes cash flows associated with discontinued operations. Please refer to Note 11 for cash flows associated
with discontinued operations and cash and cash equivalents reclassified as held for sale.
Half Year
Inflows Inflows Inflows
(Outflows) (Outflows) (Outflows)
Mar 18
$M
Sep 17
$M
Mar 17
$M
Profit after income tax 3,330 3,502 2,919
Adjustments to reconcile to net cash provided by/(used in) operating activities:
Provision for credit impairment charge 408 479 719
Depreciation and amortisation 485 468 504
(Profit)/loss on sale of premises and equipment - - (114)
Net derivatives/foreign exchange adjustment 903 (1,833) (1,576)
(Gain)/loss on sale from divestments (469) (13) 554
Other non-cash movements (221) (157) (85)
Net (increase)/decrease in operating assets:
Collateral paid (1,725) 2,065 1,468
Trading securities (1,148) (1,994) 4,075
Net loans and advances (10,909) (11,424) (6,414)
Investments backing policy liabilities (881) (672) (1,450)
Other assets (643) 459 50
Net increase/(decrease) in operating liabilities:
Deposits and other borrowings 14,023 14,815 16,089
Settlement balances owed by ANZ 596 204 (831)
Collateral received 3,300 864 (1,174)
Life insurance contract policy liabilities 1,130 824 1,436
Other liabilities (28) 1,225 (1,010)
Total adjustments 4,821 5,310 12,241
Net cash provided by/(used in) operating activities 1 8,151 8,812 15,160
Cash flows from investing activities
Available for sale assets:
Purchases (13,483) (12,725) (14,495)
Proceeds from sale or maturity 12,670 7,224 12,527
Proceeds from divestments 2,044 (5,213) -
Other assets 1,026 (400) 252
Net cash provided by/(used in) investing activities 2,257 (11,114) (1,716)
Cash flows from financing activities
Debt issuances:
Issue proceeds 14,694 8,602 15,371
Redemptions (9,171) (7,533) (15,045)
Subordinated debt:
Issue proceeds (2) 1,155 -
Redemptions (573) (3,762) (1,069)
Dividends paid (2,104) (2,123) (2,087)
⊘ This is a preview!⊘
Do you want full access?
Subscribe today to unlock all pages.
Trusted by 1+ million students worldwide
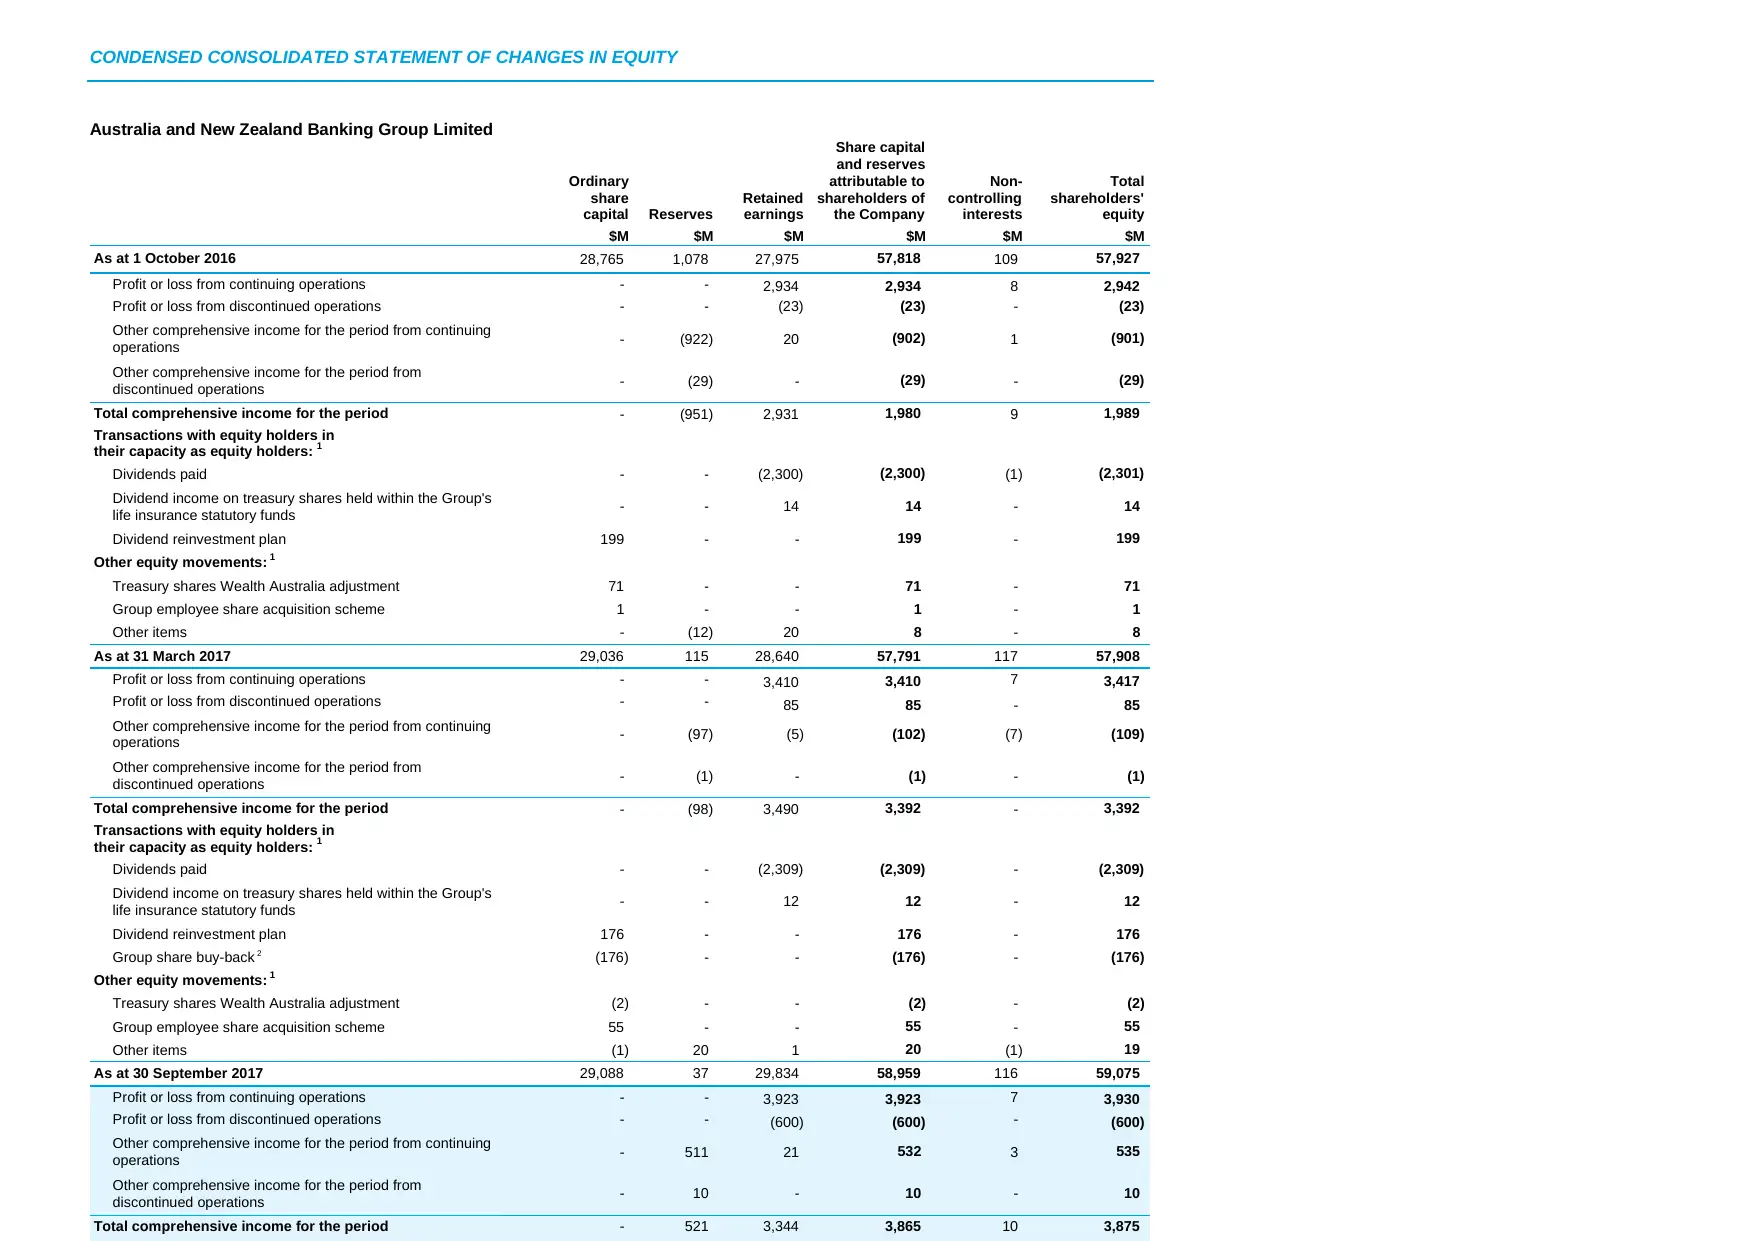
CONDENSED CONSOLIDATED STATEMENT OF CHANGES IN EQUITY
Australia and New Zealand Banking Group Limited
Ordinary
share
capital Reserves
Retained
earnings
Share capital
and reserves
attributable to
shareholders of
the Company
Non-
controlling
interests
Total
shareholders'
equity
$M $M $M $M $M $M
As at 1 October 2016 28,765 1,078 27,975 57,818 109 57,927
Profit or loss from continuing operations - - 2,934 2,934 8 2,942
Profit or loss from discontinued operations - - (23) (23) - (23)
Other comprehensive income for the period from continuing
operations - (922) 20 (902) 1 (901)
Other comprehensive income for the period from
discontinued operations - (29) - (29) - (29)
Total comprehensive income for the period - (951) 2,931 1,980 9 1,989
Transactions with equity holders in
their capacity as equity holders: 1
Dividends paid - - (2,300) (2,300) (1) (2,301)
Dividend income on treasury shares held within the Group's
life insurance statutory funds - - 14 14 - 14
Dividend reinvestment plan 199 - - 199 - 199
Other equity movements: 1
Treasury shares Wealth Australia adjustment 71 - - 71 - 71
Group employee share acquisition scheme 1 - - 1 - 1
Other items - (12) 20 8 - 8
As at 31 March 2017 29,036 115 28,640 57,791 117 57,908
Profit or loss from continuing operations - - 3,410 3,410 7 3,417
Profit or loss from discontinued operations - - 85 85 - 85
Other comprehensive income for the period from continuing
operations - (97) (5) (102) (7) (109)
Other comprehensive income for the period from
discontinued operations - (1) - (1) - (1)
Total comprehensive income for the period - (98) 3,490 3,392 - 3,392
Transactions with equity holders in
their capacity as equity holders: 1
Dividends paid - - (2,309) (2,309) - (2,309)
Dividend income on treasury shares held within the Group's
life insurance statutory funds - - 12 12 - 12
Dividend reinvestment plan 176 - - 176 - 176
Group share buy-back 2 (176) - - (176) - (176)
Other equity movements: 1
Treasury shares Wealth Australia adjustment (2) - - (2) - (2)
Group employee share acquisition scheme 55 - - 55 - 55
Other items (1) 20 1 20 (1) 19
As at 30 September 2017 29,088 37 29,834 58,959 116 59,075
Profit or loss from continuing operations - - 3,923 3,923 7 3,930
Profit or loss from discontinued operations - - (600) (600) - (600)
Other comprehensive income for the period from continuing
operations - 511 21 532 3 535
Other comprehensive income for the period from
discontinued operations - 10 - 10 - 10
Total comprehensive income for the period - 521 3,344 3,865 10 3,875
Paraphrase This Document
Need a fresh take? Get an instant paraphrase of this document with our AI Paraphraser
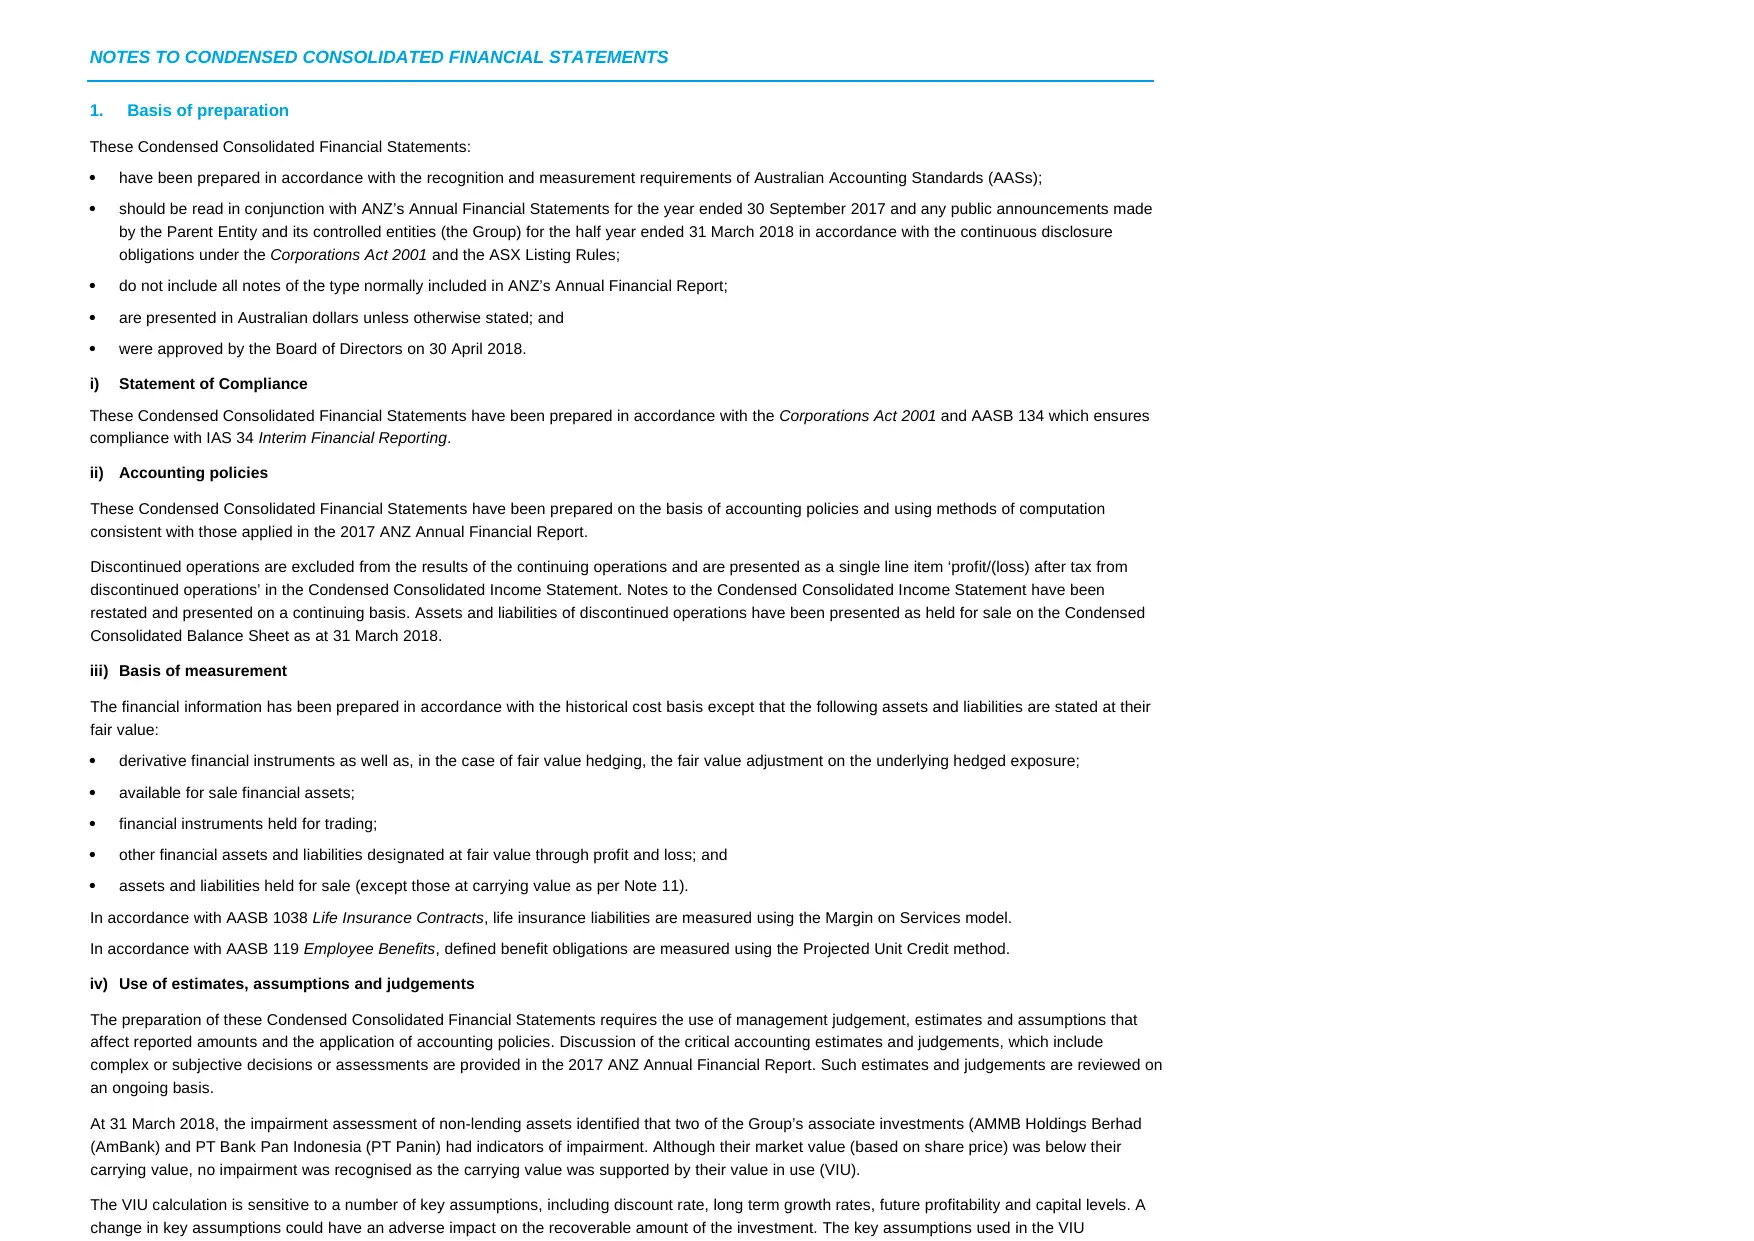
NOTES TO CONDENSED CONSOLIDATED FINANCIAL STATEMENTS
1. Basis of preparation
These Condensed Consolidated Financial Statements:
have been prepared in accordance with the recognition and measurement requirements of Australian Accounting Standards (AASs);
should be read in conjunction with ANZ’s Annual Financial Statements for the year ended 30 September 2017 and any public announcements made
by the Parent Entity and its controlled entities (the Group) for the half year ended 31 March 2018 in accordance with the continuous disclosure
obligations under the Corporations Act 2001 and the ASX Listing Rules;
do not include all notes of the type normally included in ANZ’s Annual Financial Report;
are presented in Australian dollars unless otherwise stated; and
were approved by the Board of Directors on 30 April 2018.
i) Statement of Compliance
These Condensed Consolidated Financial Statements have been prepared in accordance with the Corporations Act 2001 and AASB 134 which ensures
compliance with IAS 34 Interim Financial Reporting.
ii) Accounting policies
These Condensed Consolidated Financial Statements have been prepared on the basis of accounting policies and using methods of computation
consistent with those applied in the 2017 ANZ Annual Financial Report.
Discontinued operations are excluded from the results of the continuing operations and are presented as a single line item ‘profit/(loss) after tax from
discontinued operations’ in the Condensed Consolidated Income Statement. Notes to the Condensed Consolidated Income Statement have been
restated and presented on a continuing basis. Assets and liabilities of discontinued operations have been presented as held for sale on the Condensed
Consolidated Balance Sheet as at 31 March 2018.
iii) Basis of measurement
The financial information has been prepared in accordance with the historical cost basis except that the following assets and liabilities are stated at their
fair value:
derivative financial instruments as well as, in the case of fair value hedging, the fair value adjustment on the underlying hedged exposure;
available for sale financial assets;
financial instruments held for trading;
other financial assets and liabilities designated at fair value through profit and loss; and
assets and liabilities held for sale (except those at carrying value as per Note 11).
In accordance with AASB 1038 Life Insurance Contracts, life insurance liabilities are measured using the Margin on Services model.
In accordance with AASB 119 Employee Benefits, defined benefit obligations are measured using the Projected Unit Credit method.
iv) Use of estimates, assumptions and judgements
The preparation of these Condensed Consolidated Financial Statements requires the use of management judgement, estimates and assumptions that
affect reported amounts and the application of accounting policies. Discussion of the critical accounting estimates and judgements, which include
complex or subjective decisions or assessments are provided in the 2017 ANZ Annual Financial Report. Such estimates and judgements are reviewed on
an ongoing basis.
At 31 March 2018, the impairment assessment of non-lending assets identified that two of the Group’s associate investments (AMMB Holdings Berhad
(AmBank) and PT Bank Pan Indonesia (PT Panin) had indicators of impairment. Although their market value (based on share price) was below their
carrying value, no impairment was recognised as the carrying value was supported by their value in use (VIU).
The VIU calculation is sensitive to a number of key assumptions, including discount rate, long term growth rates, future profitability and capital levels. A
change in key assumptions could have an adverse impact on the recoverable amount of the investment. The key assumptions used in the VIU
NOTES TO CONDENSED CONSOLIDATED FINANCIAL STATEMENTS
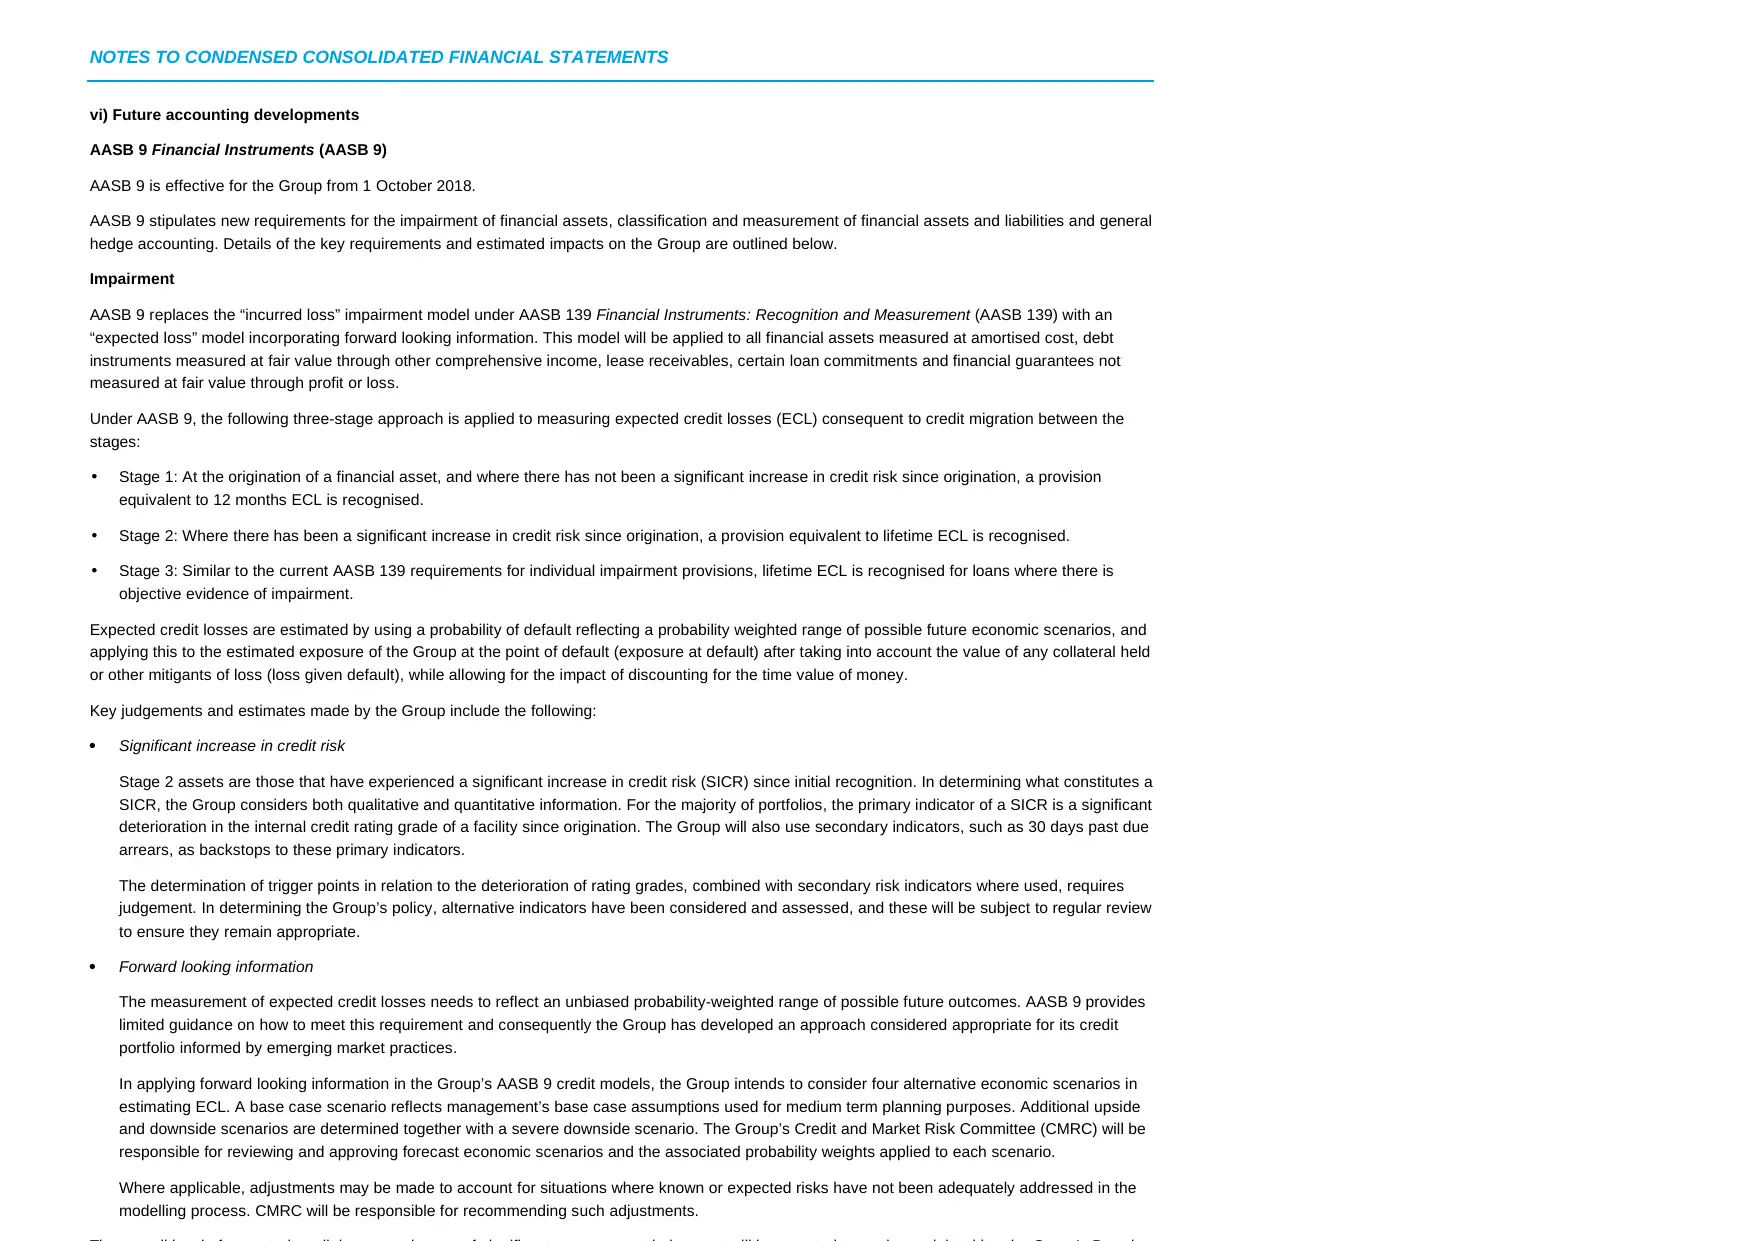
vi) Future accounting developments
AASB 9 Financial Instruments (AASB 9)
AASB 9 is effective for the Group from 1 October 2018.
AASB 9 stipulates new requirements for the impairment of financial assets, classification and measurement of financial assets and liabilities and general
hedge accounting. Details of the key requirements and estimated impacts on the Group are outlined below.
Impairment
AASB 9 replaces the “incurred loss” impairment model under AASB 139 Financial Instruments: Recognition and Measurement (AASB 139) with an
“expected loss” model incorporating forward looking information. This model will be applied to all financial assets measured at amortised cost, debt
instruments measured at fair value through other comprehensive income, lease receivables, certain loan commitments and financial guarantees not
measured at fair value through profit or loss.
Under AASB 9, the following three-stage approach is applied to measuring expected credit losses (ECL) consequent to credit migration between the
stages:
• Stage 1: At the origination of a financial asset, and where there has not been a significant increase in credit risk since origination, a provision
equivalent to 12 months ECL is recognised.
• Stage 2: Where there has been a significant increase in credit risk since origination, a provision equivalent to lifetime ECL is recognised.
• Stage 3: Similar to the current AASB 139 requirements for individual impairment provisions, lifetime ECL is recognised for loans where there is
objective evidence of impairment.
Expected credit losses are estimated by using a probability of default reflecting a probability weighted range of possible future economic scenarios, and
applying this to the estimated exposure of the Group at the point of default (exposure at default) after taking into account the value of any collateral held
or other mitigants of loss (loss given default), while allowing for the impact of discounting for the time value of money.
Key judgements and estimates made by the Group include the following:
Significant increase in credit risk
Stage 2 assets are those that have experienced a significant increase in credit risk (SICR) since initial recognition. In determining what constitutes a
SICR, the Group considers both qualitative and quantitative information. For the majority of portfolios, the primary indicator of a SICR is a significant
deterioration in the internal credit rating grade of a facility since origination. The Group will also use secondary indicators, such as 30 days past due
arrears, as backstops to these primary indicators.
The determination of trigger points in relation to the deterioration of rating grades, combined with secondary risk indicators where used, requires
judgement. In determining the Group’s policy, alternative indicators have been considered and assessed, and these will be subject to regular review
to ensure they remain appropriate.
Forward looking information
The measurement of expected credit losses needs to reflect an unbiased probability-weighted range of possible future outcomes. AASB 9 provides
limited guidance on how to meet this requirement and consequently the Group has developed an approach considered appropriate for its credit
portfolio informed by emerging market practices.
In applying forward looking information in the Group’s AASB 9 credit models, the Group intends to consider four alternative economic scenarios in
estimating ECL. A base case scenario reflects management’s base case assumptions used for medium term planning purposes. Additional upside
and downside scenarios are determined together with a severe downside scenario. The Group’s Credit and Market Risk Committee (CMRC) will be
responsible for reviewing and approving forecast economic scenarios and the associated probability weights applied to each scenario.
Where applicable, adjustments may be made to account for situations where known or expected risks have not been adequately addressed in the
modelling process. CMRC will be responsible for recommending such adjustments.
⊘ This is a preview!⊘
Do you want full access?
Subscribe today to unlock all pages.
Trusted by 1+ million students worldwide
NOTES TO CONDENSED CONSOLIDATED FINANCIAL STATEMENTS
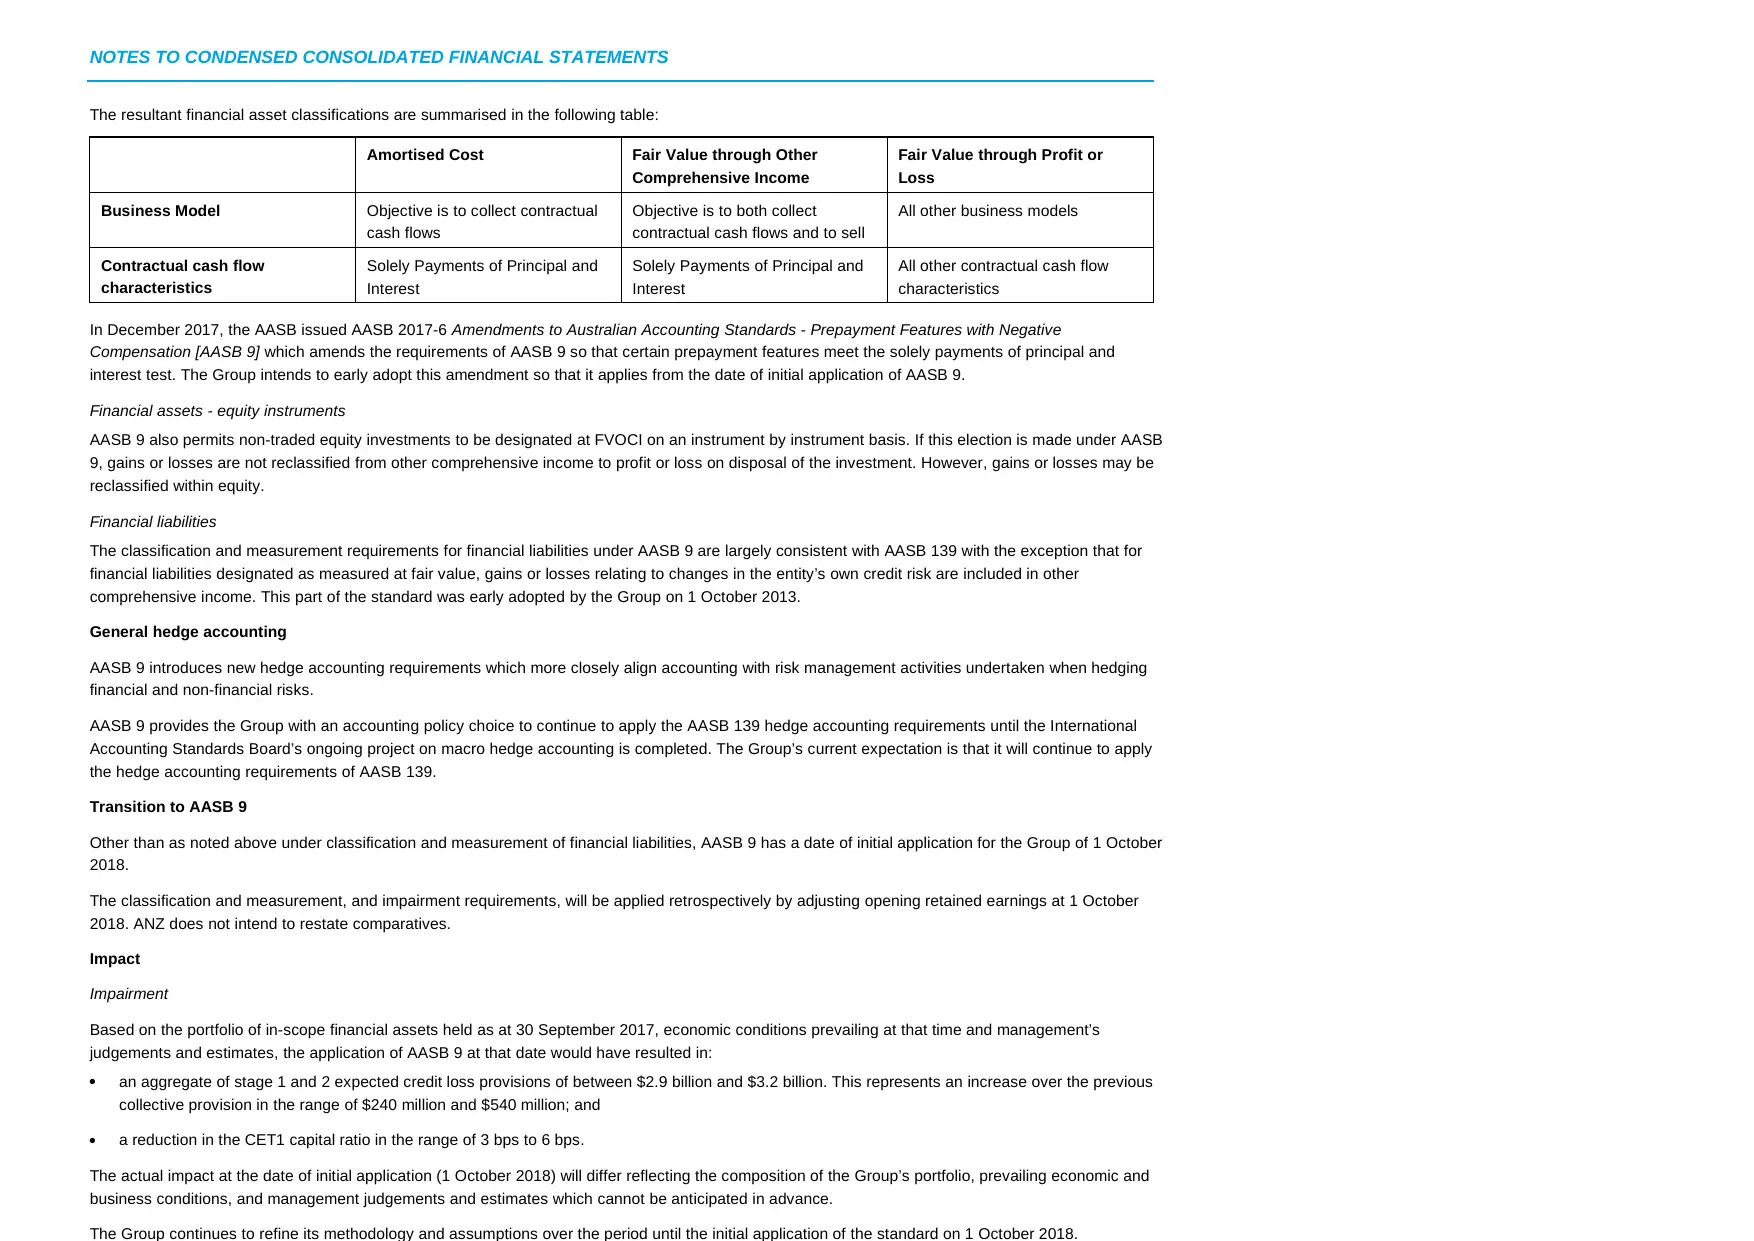
The resultant financial asset classifications are summarised in the following table:
Amortised Cost Fair Value through Other
Comprehensive Income
Fair Value through Profit or
Loss
Business Model Objective is to collect contractual
cash flows
Objective is to both collect
contractual cash flows and to sell
All other business models
Contractual cash flow
characteristics
Solely Payments of Principal and
Interest
Solely Payments of Principal and
Interest
All other contractual cash flow
characteristics
In December 2017, the AASB issued AASB 2017-6 Amendments to Australian Accounting Standards - Prepayment Features with Negative
Compensation [AASB 9] which amends the requirements of AASB 9 so that certain prepayment features meet the solely payments of principal and
interest test. The Group intends to early adopt this amendment so that it applies from the date of initial application of AASB 9.
Financial assets - equity instruments
AASB 9 also permits non-traded equity investments to be designated at FVOCI on an instrument by instrument basis. If this election is made under AASB
9, gains or losses are not reclassified from other comprehensive income to profit or loss on disposal of the investment. However, gains or losses may be
reclassified within equity.
Financial liabilities
The classification and measurement requirements for financial liabilities under AASB 9 are largely consistent with AASB 139 with the exception that for
financial liabilities designated as measured at fair value, gains or losses relating to changes in the entity’s own credit risk are included in other
comprehensive income. This part of the standard was early adopted by the Group on 1 October 2013.
General hedge accounting
AASB 9 introduces new hedge accounting requirements which more closely align accounting with risk management activities undertaken when hedging
financial and non-financial risks.
AASB 9 provides the Group with an accounting policy choice to continue to apply the AASB 139 hedge accounting requirements until the International
Accounting Standards Board’s ongoing project on macro hedge accounting is completed. The Group’s current expectation is that it will continue to apply
the hedge accounting requirements of AASB 139.
Transition to AASB 9
Other than as noted above under classification and measurement of financial liabilities, AASB 9 has a date of initial application for the Group of 1 October
2018.
The classification and measurement, and impairment requirements, will be applied retrospectively by adjusting opening retained earnings at 1 October
2018. ANZ does not intend to restate comparatives.
Impact
Impairment
Based on the portfolio of in-scope financial assets held as at 30 September 2017, economic conditions prevailing at that time and management’s
judgements and estimates, the application of AASB 9 at that date would have resulted in:
an aggregate of stage 1 and 2 expected credit loss provisions of between $2.9 billion and $3.2 billion. This represents an increase over the previous
collective provision in the range of $240 million and $540 million; and
a reduction in the CET1 capital ratio in the range of 3 bps to 6 bps.
The actual impact at the date of initial application (1 October 2018) will differ reflecting the composition of the Group’s portfolio, prevailing economic and
business conditions, and management judgements and estimates which cannot be anticipated in advance.
The Group continues to refine its methodology and assumptions over the period until the initial application of the standard on 1 October 2018.
Paraphrase This Document
Need a fresh take? Get an instant paraphrase of this document with our AI Paraphraser
NOTES TO CONDENSED CONSOLIDATED FINANCIAL STATEMENTS
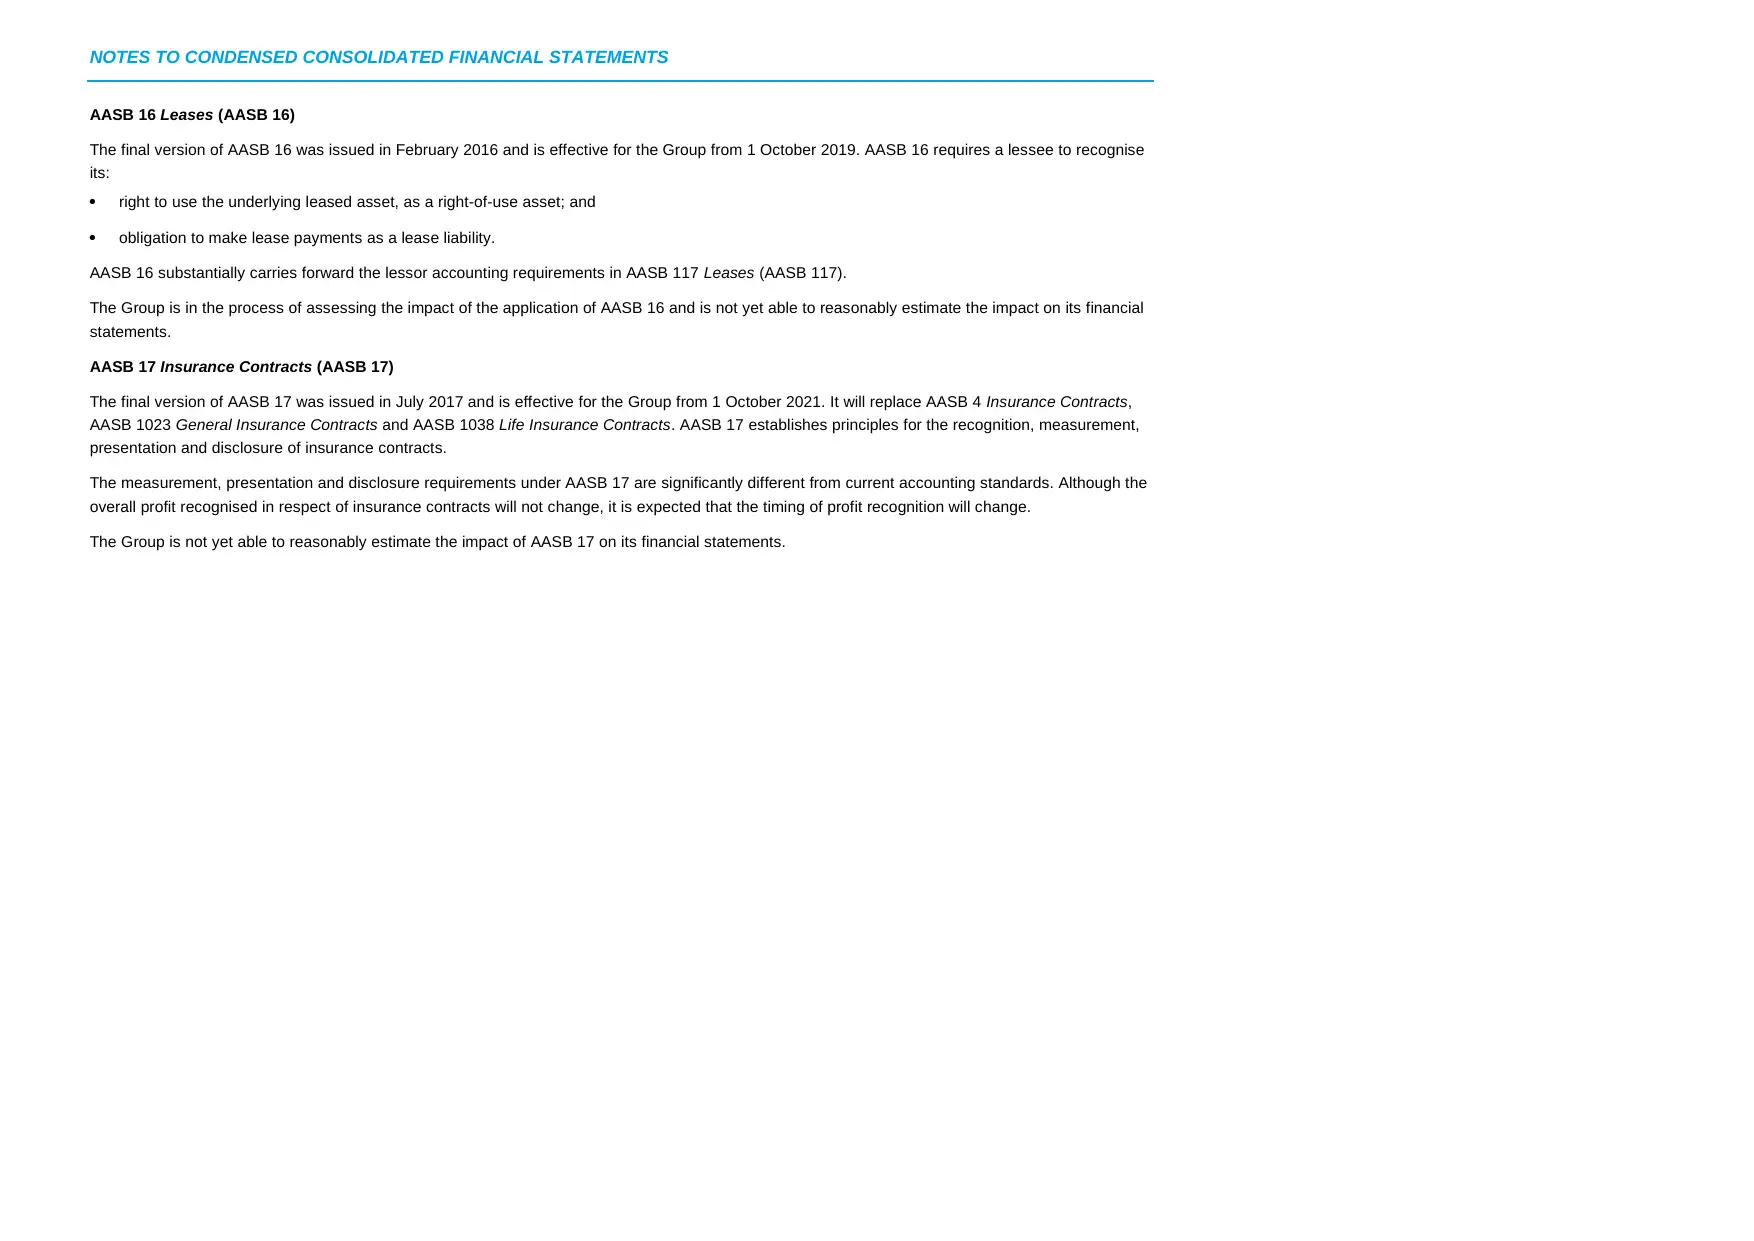
AASB 16 Leases (AASB 16)
The final version of AASB 16 was issued in February 2016 and is effective for the Group from 1 October 2019. AASB 16 requires a lessee to recognise
its:
right to use the underlying leased asset, as a right-of-use asset; and
obligation to make lease payments as a lease liability.
AASB 16 substantially carries forward the lessor accounting requirements in AASB 117 Leases (AASB 117).
The Group is in the process of assessing the impact of the application of AASB 16 and is not yet able to reasonably estimate the impact on its financial
statements.
AASB 17 Insurance Contracts (AASB 17)
The final version of AASB 17 was issued in July 2017 and is effective for the Group from 1 October 2021. It will replace AASB 4 Insurance Contracts,
AASB 1023 General Insurance Contracts and AASB 1038 Life Insurance Contracts. AASB 17 establishes principles for the recognition, measurement,
presentation and disclosure of insurance contracts.
The measurement, presentation and disclosure requirements under AASB 17 are significantly different from current accounting standards. Although the
overall profit recognised in respect of insurance contracts will not change, it is expected that the timing of profit recognition will change.
The Group is not yet able to reasonably estimate the impact of AASB 17 on its financial statements.
NOTES TO CONDENSED CONSOLIDATED FINANCIAL STATEMENTS
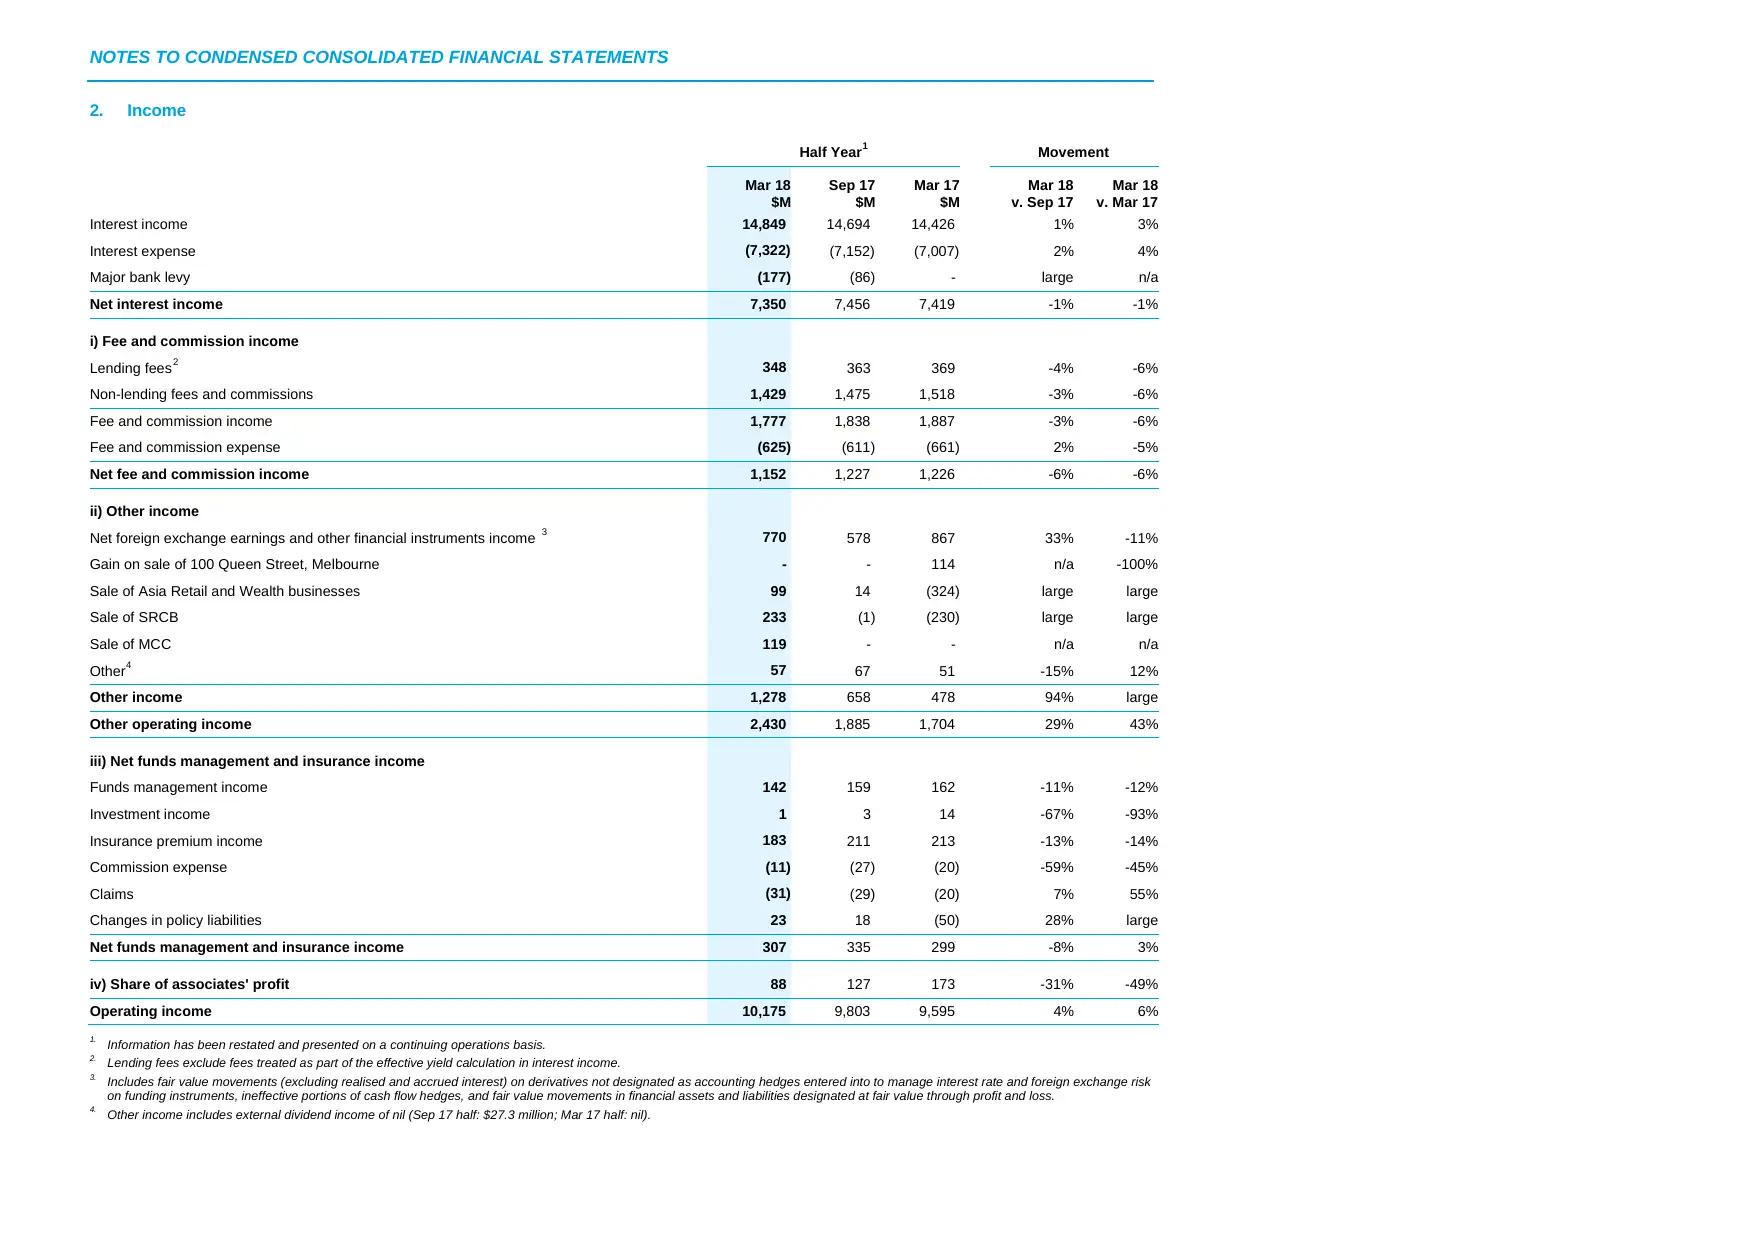
2. Income
Half Year1 Movement
Mar 18
$M
Sep 17
$M
Mar 17
$M
Mar 18
v. Sep 17
Mar 18
v. Mar 17
Interest income 14,849 14,694 14,426 1% 3%
Interest expense (7,322) (7,152) (7,007) 2% 4%
Major bank levy (177) (86) - large n/a
Net interest income 7,350 7,456 7,419 -1% -1%
i) Fee and commission income
Lending fees2 348 363 369 -4% -6%
Non-lending fees and commissions 1,429 1,475 1,518 -3% -6%
Fee and commission income 1,777 1,838 1,887 -3% -6%
Fee and commission expense (625) (611) (661) 2% -5%
Net fee and commission income 1,152 1,227 1,226 -6% -6%
ii) Other income
Net foreign exchange earnings and other financial instruments income 3 770 578 867 33% -11%
Gain on sale of 100 Queen Street, Melbourne - - 114 n/a -100%
Sale of Asia Retail and Wealth businesses 99 14 (324) large large
Sale of SRCB 233 (1) (230) large large
Sale of MCC 119 - - n/a n/a
Other4 57 67 51 -15% 12%
Other income 1,278 658 478 94% large
Other operating income 2,430 1,885 1,704 29% 43%
iii) Net funds management and insurance income
Funds management income 142 159 162 -11% -12%
Investment income 1 3 14 -67% -93%
Insurance premium income 183 211 213 -13% -14%
Commission expense (11) (27) (20) -59% -45%
Claims (31) (29) (20) 7% 55%
Changes in policy liabilities 23 18 (50) 28% large
Net funds management and insurance income 307 335 299 -8% 3%
iv) Share of associates' profit 88 127 173 -31% -49%
Operating income 10,175 9,803 9,595 4% 6%
1. Information has been restated and presented on a continuing operations basis.
2. Lending fees exclude fees treated as part of the effective yield calculation in interest income.
3. Includes fair value movements (excluding realised and accrued interest) on derivatives not designated as accounting hedges entered into to manage interest rate and foreign exchange risk
on funding instruments, ineffective portions of cash flow hedges, and fair value movements in financial assets and liabilities designated at fair value through profit and loss.
4. Other income includes external dividend income of nil (Sep 17 half: $27.3 million; Mar 17 half: nil).
⊘ This is a preview!⊘
Do you want full access?
Subscribe today to unlock all pages.
Trusted by 1+ million students worldwide
1 out of 36


Your All-in-One AI-Powered Toolkit for Academic Success.
+13062052269
info@desklib.com
Available 24*7 on WhatsApp / Email
![[object Object]](/_next/static/media/star-bottom.7253800d.svg)
Unlock your academic potential
Copyright © 2020–2026 A2Z Services. All Rights Reserved. Developed and managed by ZUCOL.