ANZ Bank Financial Performance: Masters Level Detailed Report
VerifiedAdded on 2023/06/11
|18
|4289
|382
Report
AI Summary
This report provides a detailed financial analysis of ANZ Bank, starting with a company description and ownership structure, including substantial shareholders and key personnel. It computes fundamental ratios to assess the company's solvency and performs a comparative analysis of the share price against the all ordinary index, supplemented by graphical representations. The report calculates the beta value and expected rate of return using the Capital Asset Pricing Model (CAPM) and evaluates the weighted average cost of capital (WACC). Additionally, it considers the debt ratio and dividend policy, culminating in investment recommendations based on the analysis. The report aims to provide financial advice to a wealthy investor based on the financial performance of ANZ Bank.
Running head: FINANCE FOR BUISNESS - MASTERS
Finance for Business- Masters
Name of the Student
Name of the University
Authors Note
Course ID
Finance for Business- Masters
Name of the Student
Name of the University
Authors Note
Course ID
Paraphrase This Document
Need a fresh take? Get an instant paraphrase of this document with our AI Paraphraser
1FINANCE FOR BUISNESS - MASTERS
Table of Contents
Introduction:...............................................................................................................................2
Brief Description of Company:..................................................................................................2
Ownership-Governance Structure:.............................................................................................3
Substantial sharehold ers:......................................................................................................3
Main People:..........................................................................................................................4
Fundamental Ratios:...................................................................................................................5
Short term Solvency:..............................................................................................................5
Long Term Solvency:.............................................................................................................5
Asset Utilization Ratios:........................................................................................................5
Profitability Ratios:................................................................................................................6
Market Value Ratios:.............................................................................................................6
Graphical Descriptions of share price results:...........................................................................7
Comparative analysis of the share price:...................................................................................8
Significant factor influencing share price of the ANZ Bank:....................................................9
Computations of the Beta Values and expected rate of returns using CAPM:..........................9
Calculated beta of ANZ Bank:...............................................................................................9
Calculation of required rate of return for the company’s shares:.........................................10
Conservative of making Investment:...................................................................................10
Weighted Average Cost of Capital:.........................................................................................11
Implications of the higher weighted average cost of capital on management perspective:. 11

2FINANCE FOR BUISNESS - MASTERS
Debt ratio:.................................................................................................................................12
Dividend policy:.......................................................................................................................12
Letter of Recommendations:....................................................................................................12
Conclusion:..............................................................................................................................13
References................................................................................................................................14
⊘ This is a preview!⊘
Do you want full access?
Subscribe today to unlock all pages.
Trusted by 1+ million students worldwide
3FINANCE FOR BUISNESS - MASTERS
Introduction:
The report is based on the determination of the financial position of the ANZ Bank.
The report would be providing the descriptive analysis of the company based on the share
price movement. The report begins with the description of the company along with the
outline of core activities that in which the company operates. Furthermore, the report would
be providing the ownership governance structure of the company. The report would be
highlighting the main substantial shareholders that holds more than 20% of the shareholdings.
Furthermore, a list of the main people of the ANZ Bank will be reported that forms the part
of the governance. A computation of the fundamental ratios would be carried out to
determine solvency of the company.
A comparative analysis of the share price would be performed to understanding the
volatility that is involved in the share price against the all ordinary index. A graphical
representation would be depicting the movement of the share price and factors that contribute
to such movement. The computation of the beta would be performed which would further
accompany required rate of return by using the tool of weighted average cost of capital. The
debt ratio and the dividend policy of the company would be considered as this form the basis
of letter of recommendations.
Brief Description of Company:
Australia and New Zealand Banking Group Ltd is commonly known as the ANZ
Bank. The bank is the third largest in terms of the market capitalisation in Australia. The
Australian operations of the ANZ Bank makes up the biggest part of the business. ANZ Bank
has the proud heritage of more than 180 years (Anz.com 2018). The banks operate in thirty-
four global markets having its representation in Australia, New Zealand, Asia, Pacific,
Europe, America and Middle East. The headquarter of the ANZ Bank is located in
Paraphrase This Document
Need a fresh take? Get an instant paraphrase of this document with our AI Paraphraser
4FINANCE FOR BUISNESS - MASTERS
Melbourne. The bank first commenced its operations as the Bank of Australasia during 1835
in Sydney and commenced its operations in Melbourne 1838.
The business of the ANZ Bank is about creating relationships that helps in creating
value (Anz.com 2018). The company combines the energy and commitment of its people
with the power of technology and data in order to deliver the innovative and convenient
services. This ultimately creates the differences for the customers and communities in which
ANZ Bank operates.
Ownership-Governance Structure:
Substantial sharehold ers:
Name of the Shareholders Total ordinary shares held Percentage of shares held
Blackrock Group 148,984,864 5.07%
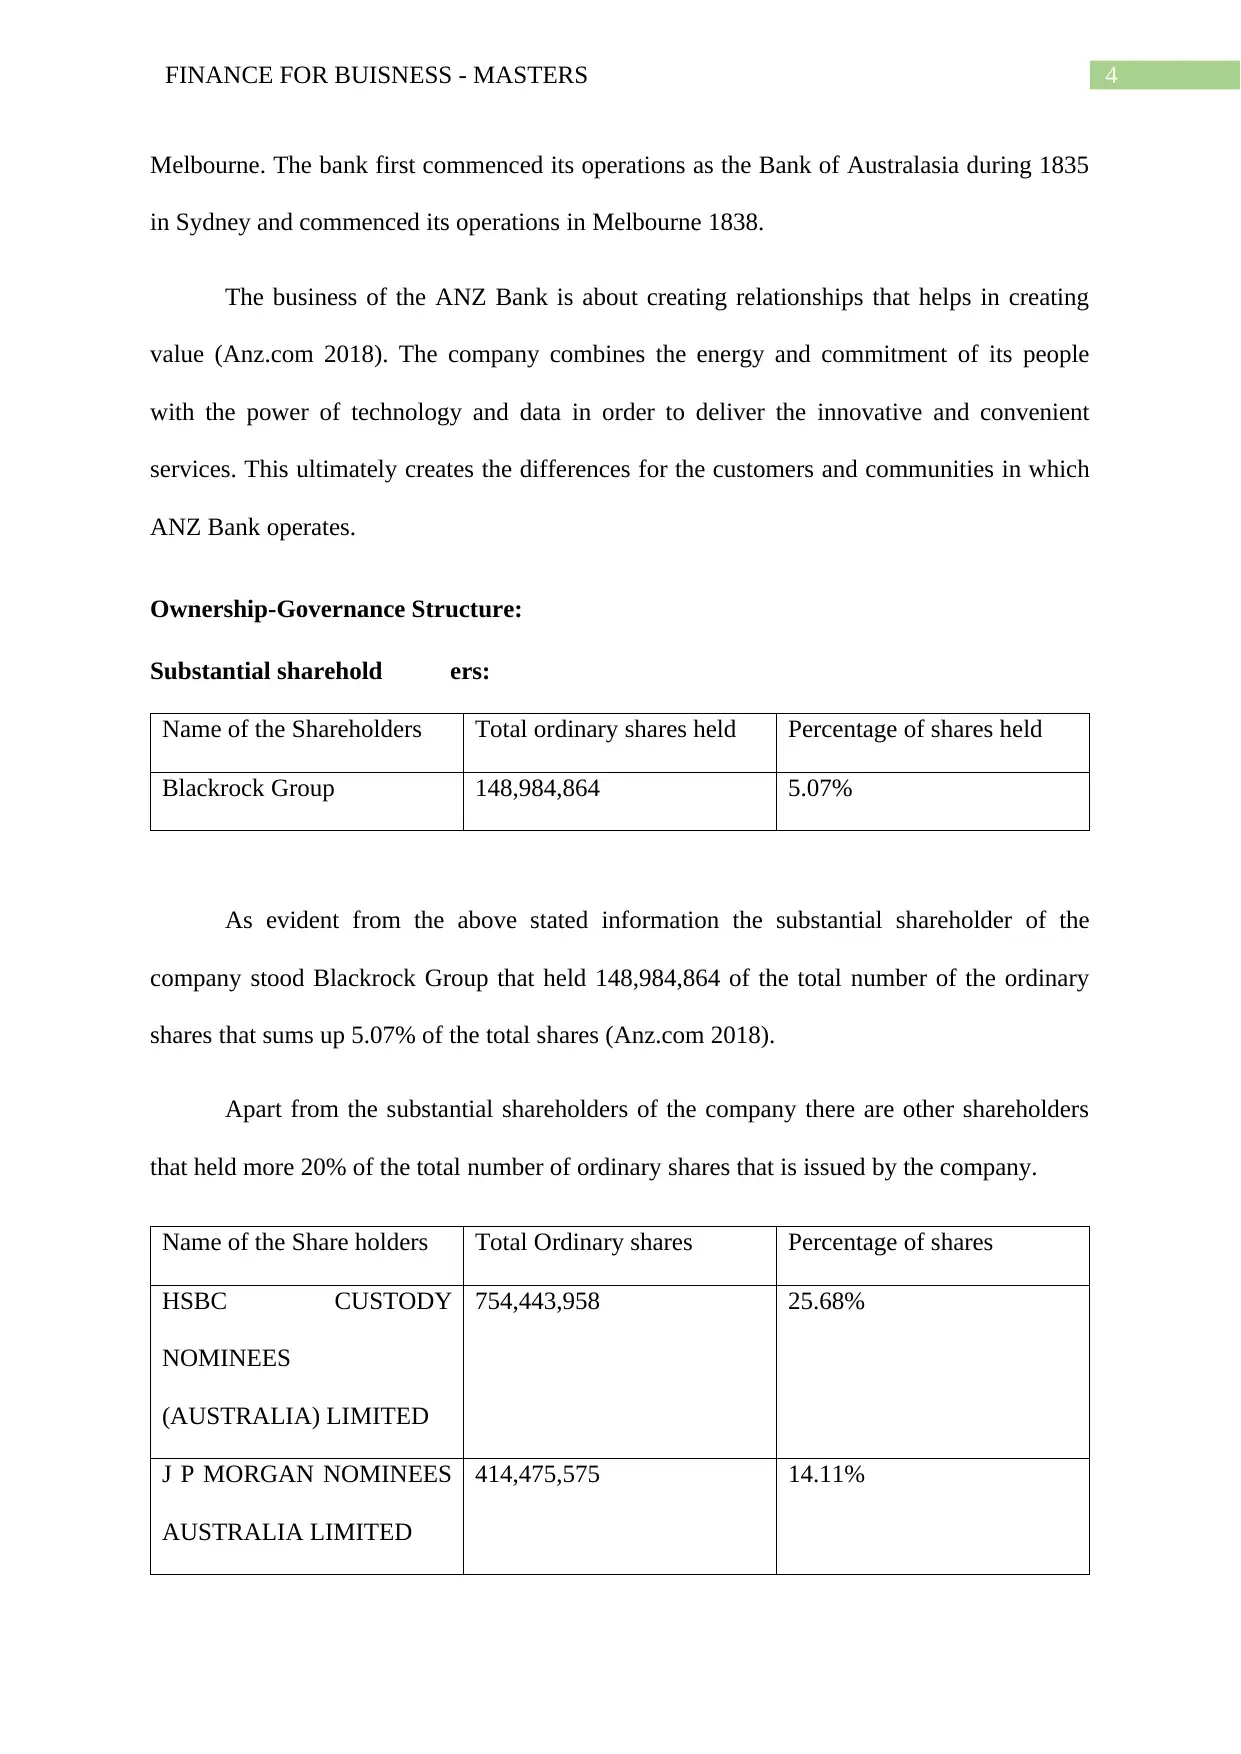
As evident from the above stated information the substantial shareholder of the
company stood Blackrock Group that held 148,984,864 of the total number of the ordinary
shares that sums up 5.07% of the total shares (Anz.com 2018).
Apart from the substantial shareholders of the company there are other shareholders
that held more 20% of the total number of ordinary shares that is issued by the company.
Name of the Share holders Total Ordinary shares Percentage of shares
HSBC CUSTODY
NOMINEES
(AUSTRALIA) LIMITED
754,443,958 25.68%
J P MORGAN NOMINEES
AUSTRALIA LIMITED
414,475,575 14.11%
Melbourne. The bank first commenced its operations as the Bank of Australasia during 1835
in Sydney and commenced its operations in Melbourne 1838.
The business of the ANZ Bank is about creating relationships that helps in creating
value (Anz.com 2018). The company combines the energy and commitment of its people
with the power of technology and data in order to deliver the innovative and convenient
services. This ultimately creates the differences for the customers and communities in which
ANZ Bank operates.
Ownership-Governance Structure:
Substantial sharehold ers:
Name of the Shareholders Total ordinary shares held Percentage of shares held
Blackrock Group 148,984,864 5.07%
As evident from the above stated information the substantial shareholder of the
company stood Blackrock Group that held 148,984,864 of the total number of the ordinary
shares that sums up 5.07% of the total shares (Anz.com 2018).
Apart from the substantial shareholders of the company there are other shareholders
that held more 20% of the total number of ordinary shares that is issued by the company.
Name of the Share holders Total Ordinary shares Percentage of shares
HSBC CUSTODY
NOMINEES
(AUSTRALIA) LIMITED
754,443,958 25.68%
J P MORGAN NOMINEES
AUSTRALIA LIMITED
414,475,575 14.11%
5FINANCE FOR BUISNESS - MASTERS
CITICORP NOMINEES
PTY LIMITED
195,729,817 6.66%
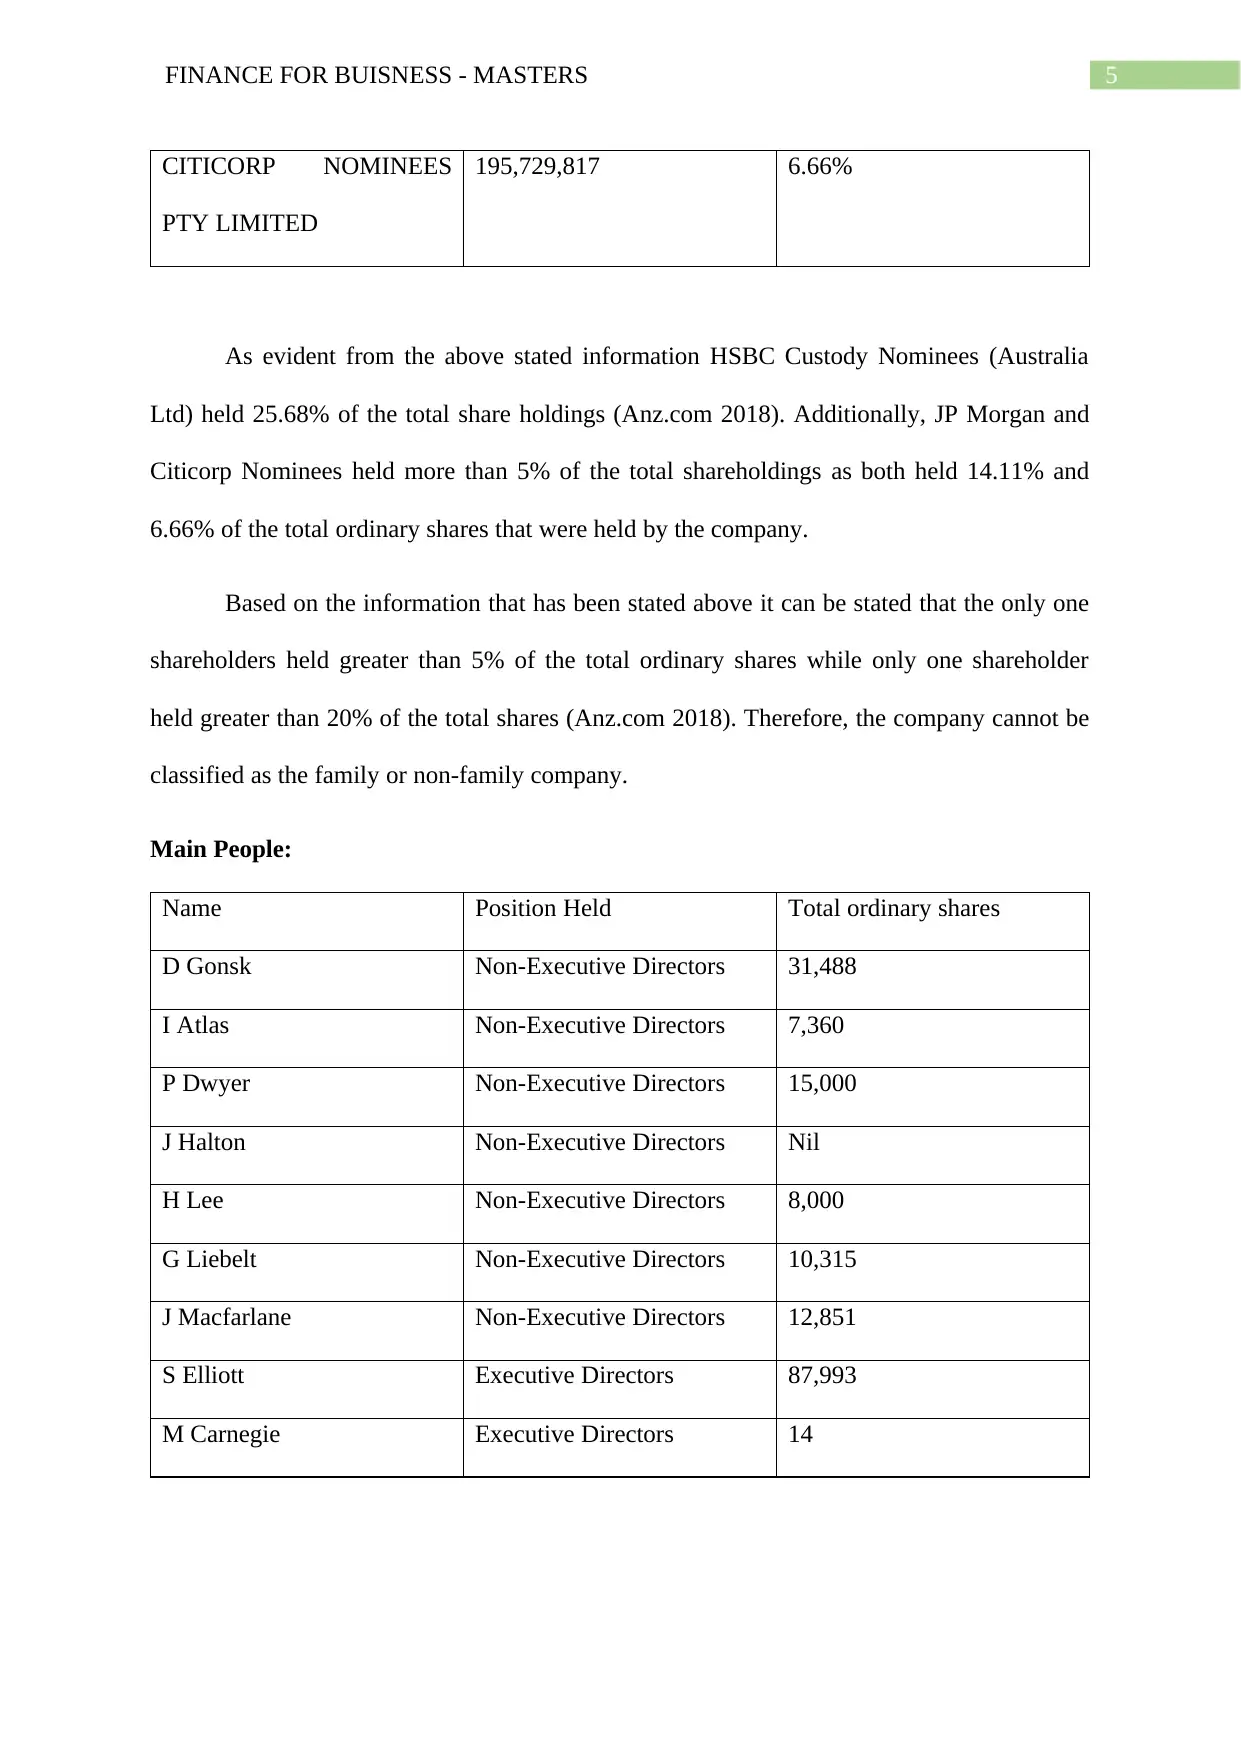
As evident from the above stated information HSBC Custody Nominees (Australia
Ltd) held 25.68% of the total share holdings (Anz.com 2018). Additionally, JP Morgan and
Citicorp Nominees held more than 5% of the total shareholdings as both held 14.11% and
6.66% of the total ordinary shares that were held by the company.
Based on the information that has been stated above it can be stated that the only one
shareholders held greater than 5% of the total ordinary shares while only one shareholder
held greater than 20% of the total shares (Anz.com 2018). Therefore, the company cannot be
classified as the family or non-family company.
Main People:
Name Position Held Total ordinary shares
D Gonsk Non-Executive Directors 31,488
I Atlas Non-Executive Directors 7,360
P Dwyer Non-Executive Directors 15,000
J Halton Non-Executive Directors Nil
H Lee Non-Executive Directors 8,000
G Liebelt Non-Executive Directors 10,315
J Macfarlane Non-Executive Directors 12,851
S Elliott Executive Directors 87,993
M Carnegie Executive Directors 14
CITICORP NOMINEES
PTY LIMITED
195,729,817 6.66%
As evident from the above stated information HSBC Custody Nominees (Australia
Ltd) held 25.68% of the total share holdings (Anz.com 2018). Additionally, JP Morgan and
Citicorp Nominees held more than 5% of the total shareholdings as both held 14.11% and
6.66% of the total ordinary shares that were held by the company.
Based on the information that has been stated above it can be stated that the only one
shareholders held greater than 5% of the total ordinary shares while only one shareholder
held greater than 20% of the total shares (Anz.com 2018). Therefore, the company cannot be
classified as the family or non-family company.
Main People:
Name Position Held Total ordinary shares
D Gonsk Non-Executive Directors 31,488
I Atlas Non-Executive Directors 7,360
P Dwyer Non-Executive Directors 15,000
J Halton Non-Executive Directors Nil
H Lee Non-Executive Directors 8,000
G Liebelt Non-Executive Directors 10,315
J Macfarlane Non-Executive Directors 12,851
S Elliott Executive Directors 87,993
M Carnegie Executive Directors 14
⊘ This is a preview!⊘
Do you want full access?
Subscribe today to unlock all pages.
Trusted by 1+ million students worldwide
6FINANCE FOR BUISNESS - MASTERS
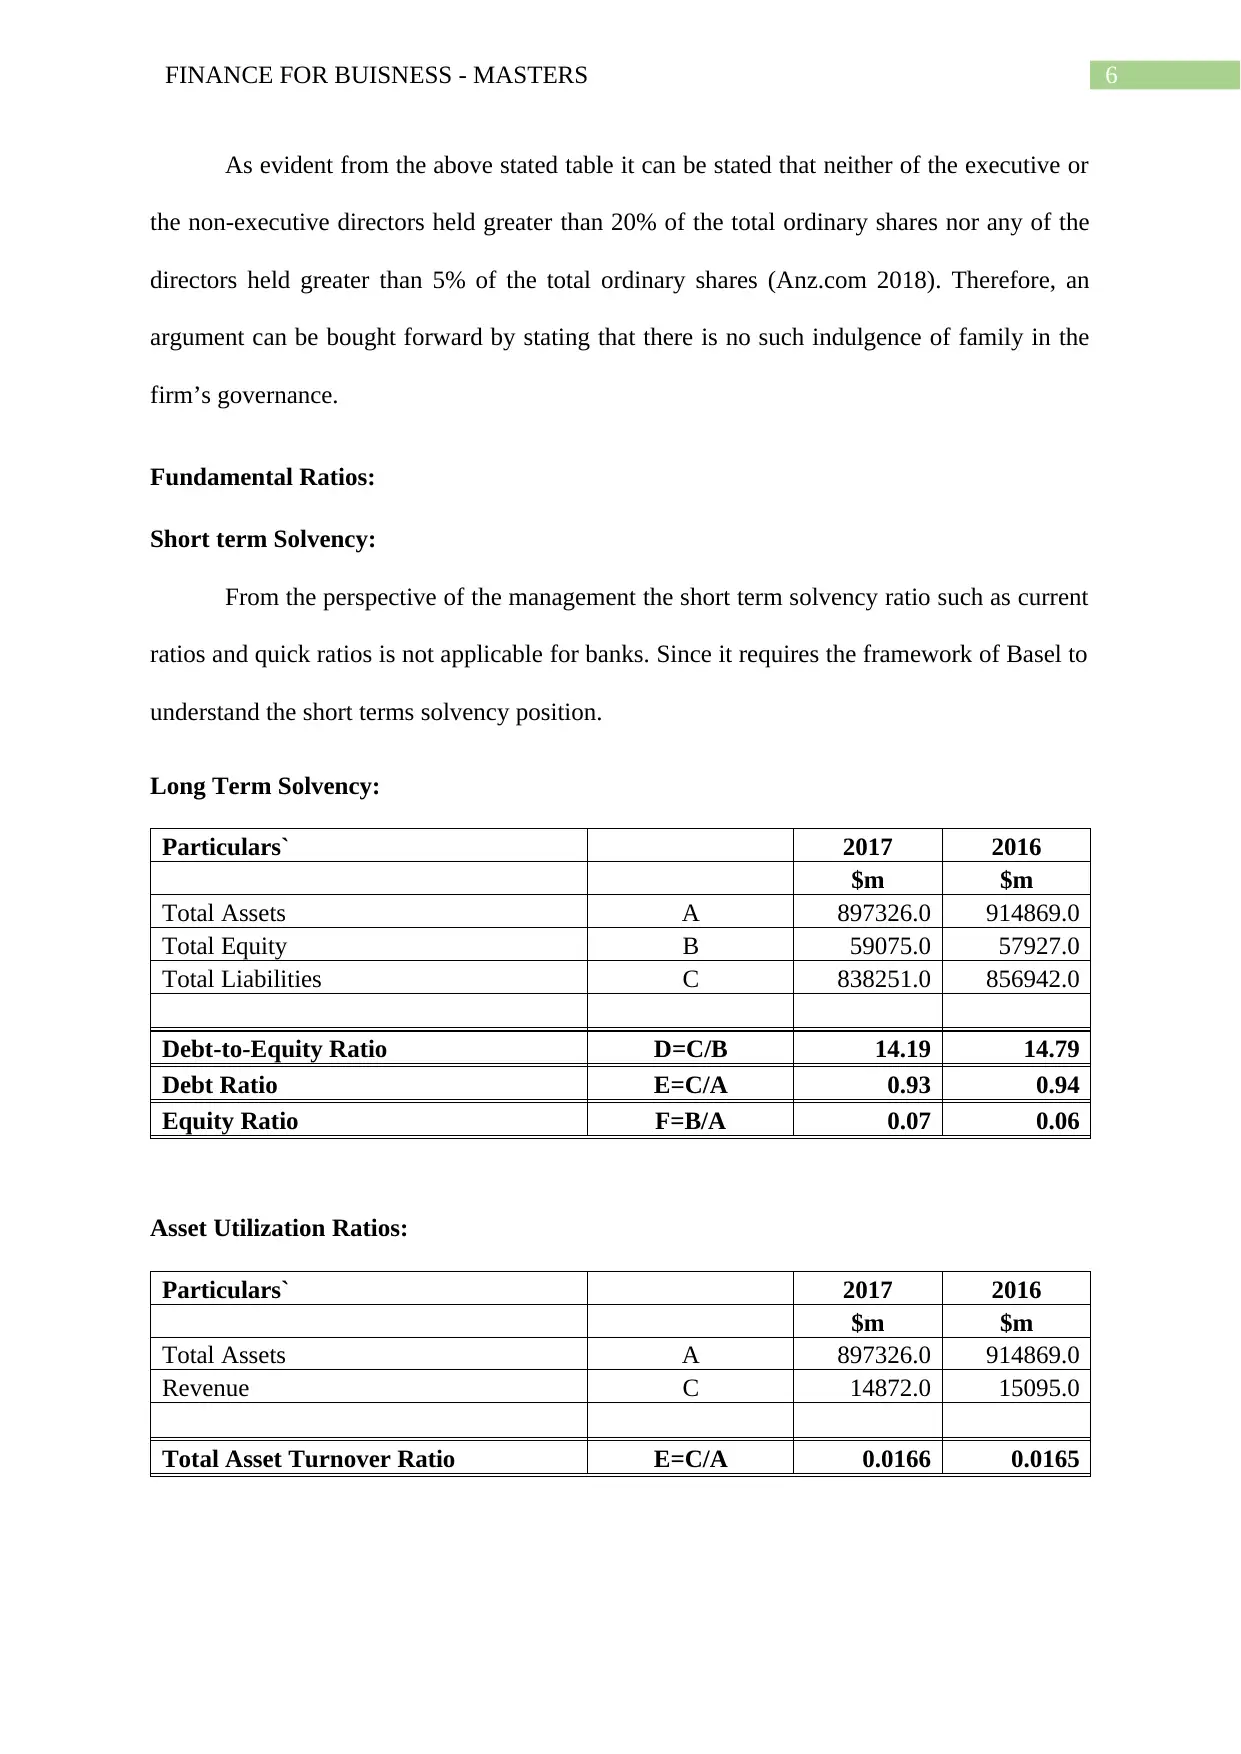
As evident from the above stated table it can be stated that neither of the executive or
the non-executive directors held greater than 20% of the total ordinary shares nor any of the
directors held greater than 5% of the total ordinary shares (Anz.com 2018). Therefore, an
argument can be bought forward by stating that there is no such indulgence of family in the
firm’s governance.
Fundamental Ratios:
Short term Solvency:
From the perspective of the management the short term solvency ratio such as current
ratios and quick ratios is not applicable for banks. Since it requires the framework of Basel to
understand the short terms solvency position.
Long Term Solvency:
Particulars` 2017 2016
$m $m
Total Assets A 897326.0 914869.0
Total Equity B 59075.0 57927.0
Total Liabilities C 838251.0 856942.0
Debt-to-Equity Ratio D=C/B 14.19 14.79
Debt Ratio E=C/A 0.93 0.94
Equity Ratio F=B/A 0.07 0.06
Asset Utilization Ratios:
Particulars` 2017 2016
$m $m
Total Assets A 897326.0 914869.0
Revenue C 14872.0 15095.0
Total Asset Turnover Ratio E=C/A 0.0166 0.0165
Paraphrase This Document
Need a fresh take? Get an instant paraphrase of this document with our AI Paraphraser
7FINANCE FOR BUISNESS - MASTERS
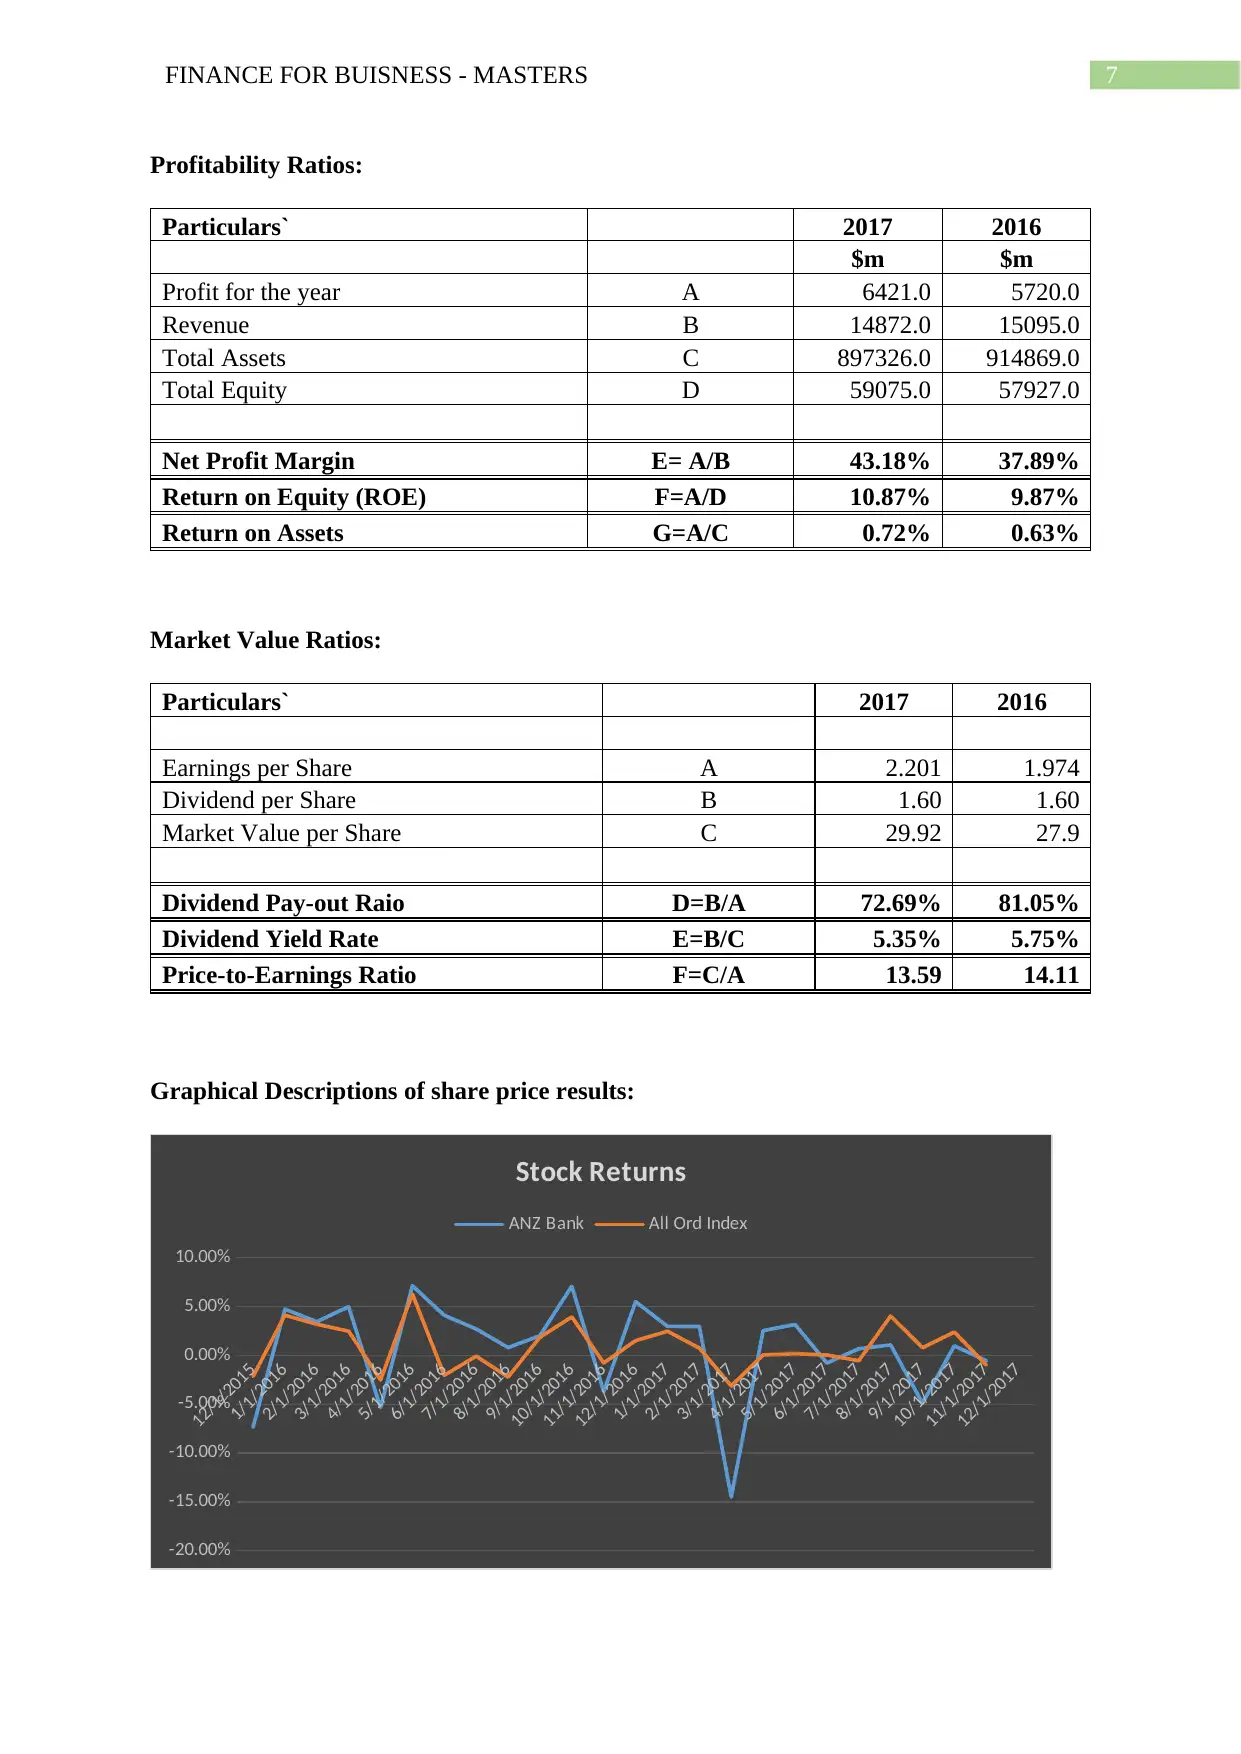
Profitability Ratios:
Particulars` 2017 2016
$m $m
Profit for the year A 6421.0 5720.0
Revenue B 14872.0 15095.0
Total Assets C 897326.0 914869.0
Total Equity D 59075.0 57927.0
Net Profit Margin E= A/B 43.18% 37.89%
Return on Equity (ROE) F=A/D 10.87% 9.87%
Return on Assets G=A/C 0.72% 0.63%
Market Value Ratios:
Particulars` 2017 2016
Earnings per Share A 2.201 1.974
Dividend per Share B 1.60 1.60
Market Value per Share C 29.92 27.9
Dividend Pay-out Raio D=B/A 72.69% 81.05%
Dividend Yield Rate E=B/C 5.35% 5.75%
Price-to-Earnings Ratio F=C/A 13.59 14.11
Graphical Descriptions of share price results:
12/1/2015
1/1/2016
2/1/2016
3/1/2016
4/1/2016
5/1/2016
6/1/2016
7/1/2016
8/1/2016
9/1/2016
10/1/2016
11/1/2016
12/1/2016
1/1/2017
2/1/2017
3/1/2017
4/1/2017
5/1/2017
6/1/2017
7/1/2017
8/1/2017
9/1/2017
10/1/2017
11/1/2017
12/1/2017
-20.00%
-15.00%
-10.00%
-5.00%
0.00%
5.00%
10.00%
Stock Returns
ANZ Bank All Ord Index
8FINANCE FOR BUISNESS - MASTERS
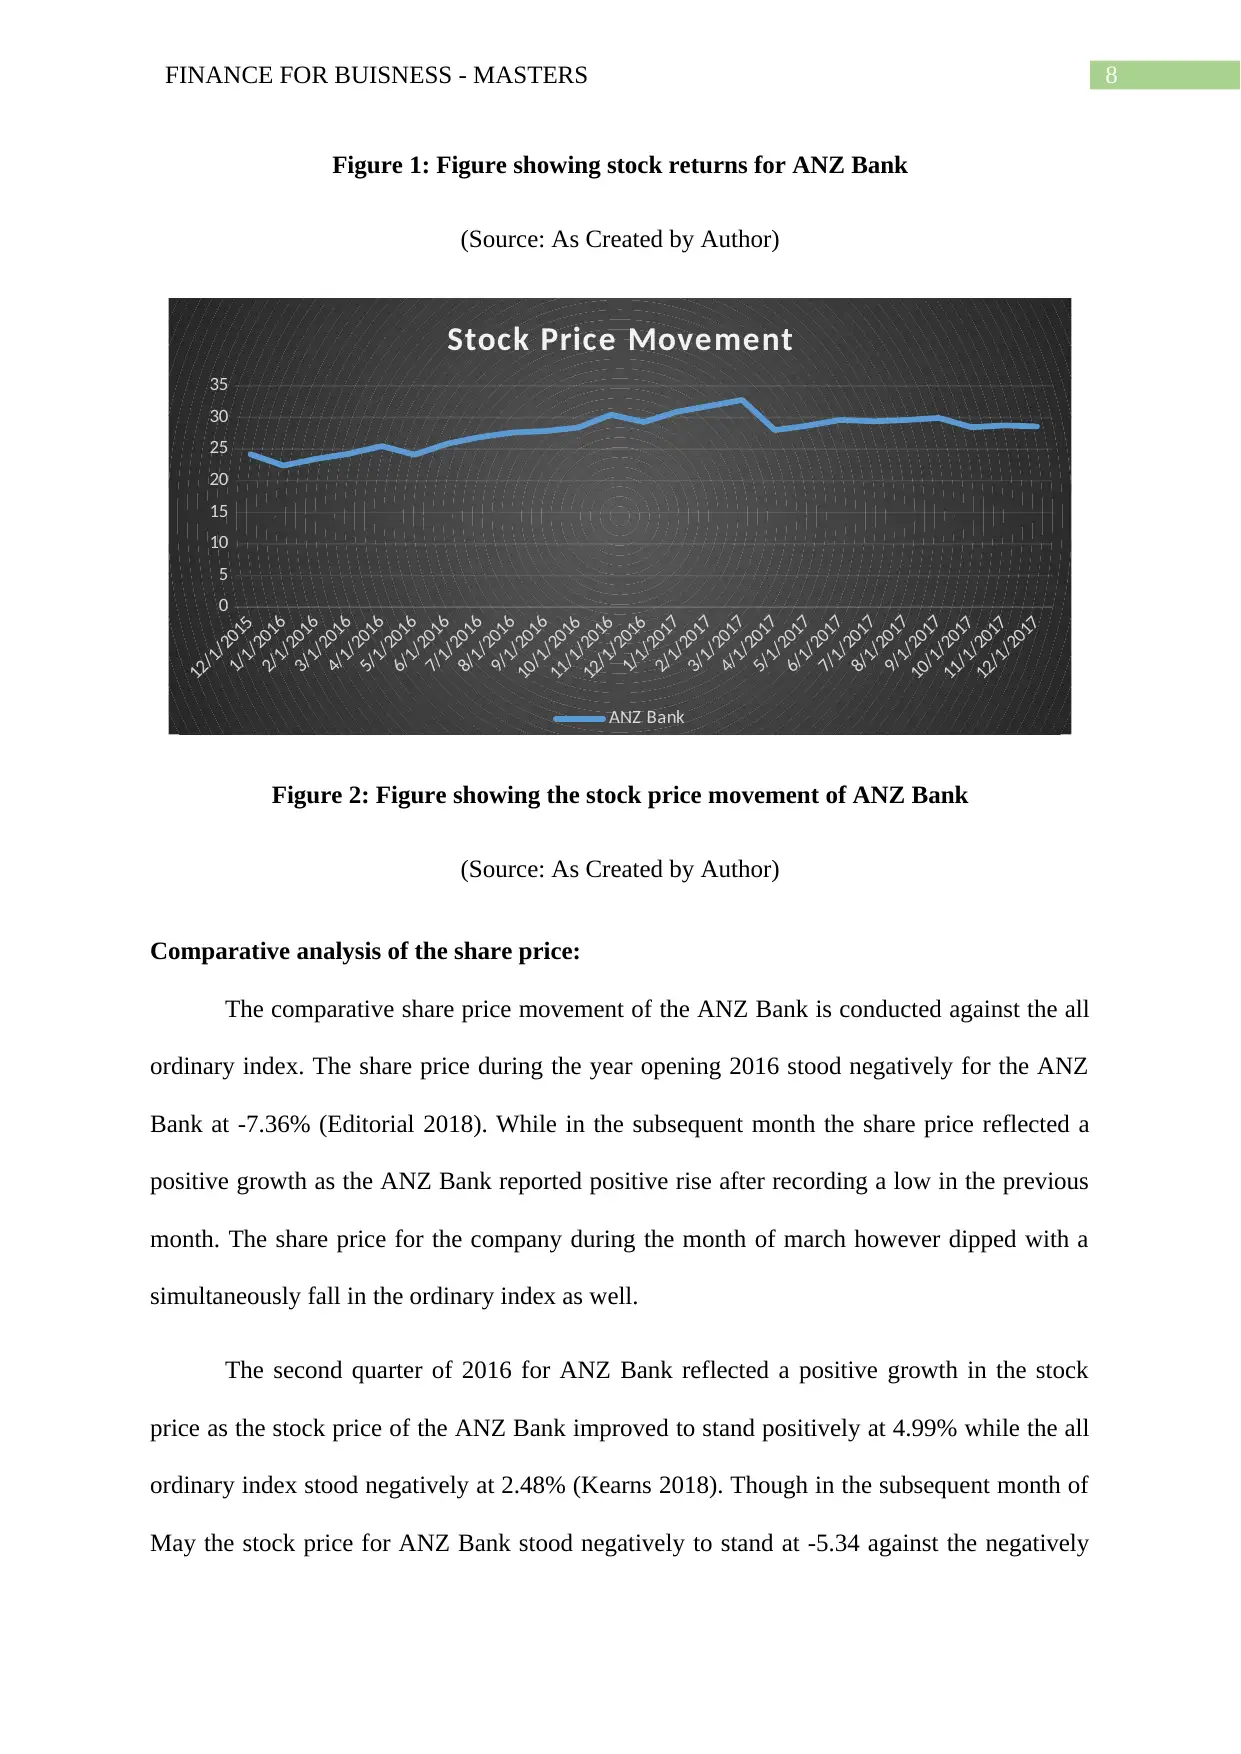
Figure 1: Figure showing stock returns for ANZ Bank
(Source: As Created by Author)
12/1/2015
1/1/2016
2/1/2016
3/1/2016
4/1/2016
5/1/2016
6/1/2016
7/1/2016
8/1/2016
9/1/2016
10/1/2016
11/1/2016
12/1/2016
1/1/2017
2/1/2017
3/1/2017
4/1/2017
5/1/2017
6/1/2017
7/1/2017
8/1/2017
9/1/2017
10/1/2017
11/1/2017
12/1/2017
0
5
10
15
20
25
30
35
Stock Price Movement
ANZ Bank
Figure 2: Figure showing the stock price movement of ANZ Bank
(Source: As Created by Author)
Comparative analysis of the share price:
The comparative share price movement of the ANZ Bank is conducted against the all
ordinary index. The share price during the year opening 2016 stood negatively for the ANZ
Bank at -7.36% (Editorial 2018). While in the subsequent month the share price reflected a
positive growth as the ANZ Bank reported positive rise after recording a low in the previous
month. The share price for the company during the month of march however dipped with a
simultaneously fall in the ordinary index as well.
The second quarter of 2016 for ANZ Bank reflected a positive growth in the stock
price as the stock price of the ANZ Bank improved to stand positively at 4.99% while the all
ordinary index stood negatively at 2.48% (Kearns 2018). Though in the subsequent month of
May the stock price for ANZ Bank stood negatively to stand at -5.34 against the negatively
⊘ This is a preview!⊘
Do you want full access?
Subscribe today to unlock all pages.
Trusted by 1+ million students worldwide
9FINANCE FOR BUISNESS - MASTERS
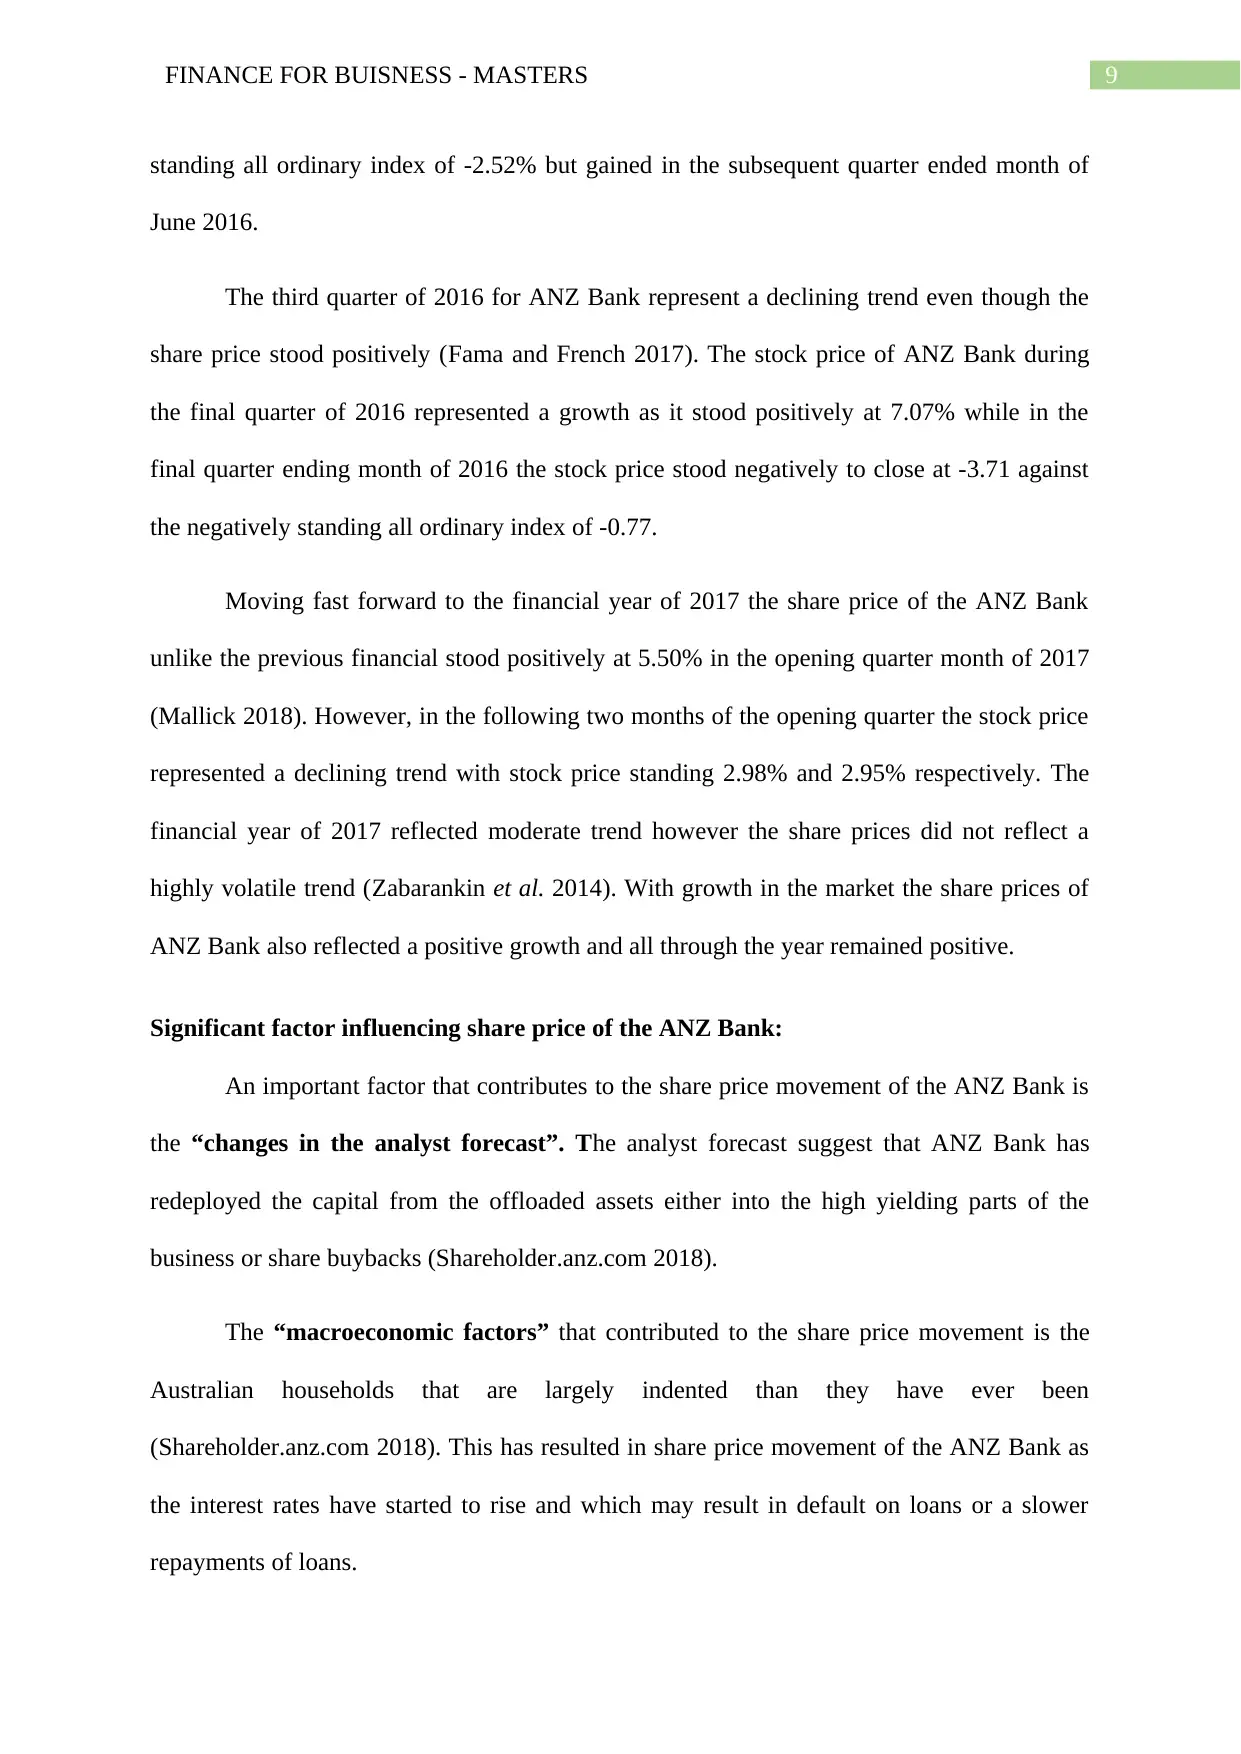
standing all ordinary index of -2.52% but gained in the subsequent quarter ended month of
June 2016.
The third quarter of 2016 for ANZ Bank represent a declining trend even though the
share price stood positively (Fama and French 2017). The stock price of ANZ Bank during
the final quarter of 2016 represented a growth as it stood positively at 7.07% while in the
final quarter ending month of 2016 the stock price stood negatively to close at -3.71 against
the negatively standing all ordinary index of -0.77.
Moving fast forward to the financial year of 2017 the share price of the ANZ Bank
unlike the previous financial stood positively at 5.50% in the opening quarter month of 2017
(Mallick 2018). However, in the following two months of the opening quarter the stock price
represented a declining trend with stock price standing 2.98% and 2.95% respectively. The
financial year of 2017 reflected moderate trend however the share prices did not reflect a
highly volatile trend (Zabarankin et al. 2014). With growth in the market the share prices of
ANZ Bank also reflected a positive growth and all through the year remained positive.
Significant factor influencing share price of the ANZ Bank:
An important factor that contributes to the share price movement of the ANZ Bank is
the “changes in the analyst forecast”. The analyst forecast suggest that ANZ Bank has
redeployed the capital from the offloaded assets either into the high yielding parts of the
business or share buybacks (Shareholder.anz.com 2018).
The “macroeconomic factors” that contributed to the share price movement is the
Australian households that are largely indented than they have ever been
(Shareholder.anz.com 2018). This has resulted in share price movement of the ANZ Bank as
the interest rates have started to rise and which may result in default on loans or a slower
repayments of loans.
Paraphrase This Document
Need a fresh take? Get an instant paraphrase of this document with our AI Paraphraser
10FINANCE FOR BUISNESS - MASTERS
Another important factor that contributed to the share price movement of the ANZ
Bank is the “changes in the management” (Bhattacharya 2015). The bank appointed Mike
Smith as the Asian expansion strategy which became very apparent the company arguably
focused on the costly shareholders (Shareholder.anz.com 2018). These factors ultimately
contribute to the share price movement of the ANZ Bank.
The “changes in the management earnings forecast” is held as the most important
factor that contributed to the share price movement of the ANZ Bank (Barberis et al. 2015).
The management strategy of the Asian expansion lacked focus resulting the annual return
over the period to be close 11.5% (Shareholder.anz.com 2018). The needlessly costly
shareholders did not fared as per the management earnings expectations and a minimal
growth in earnings was noticed.
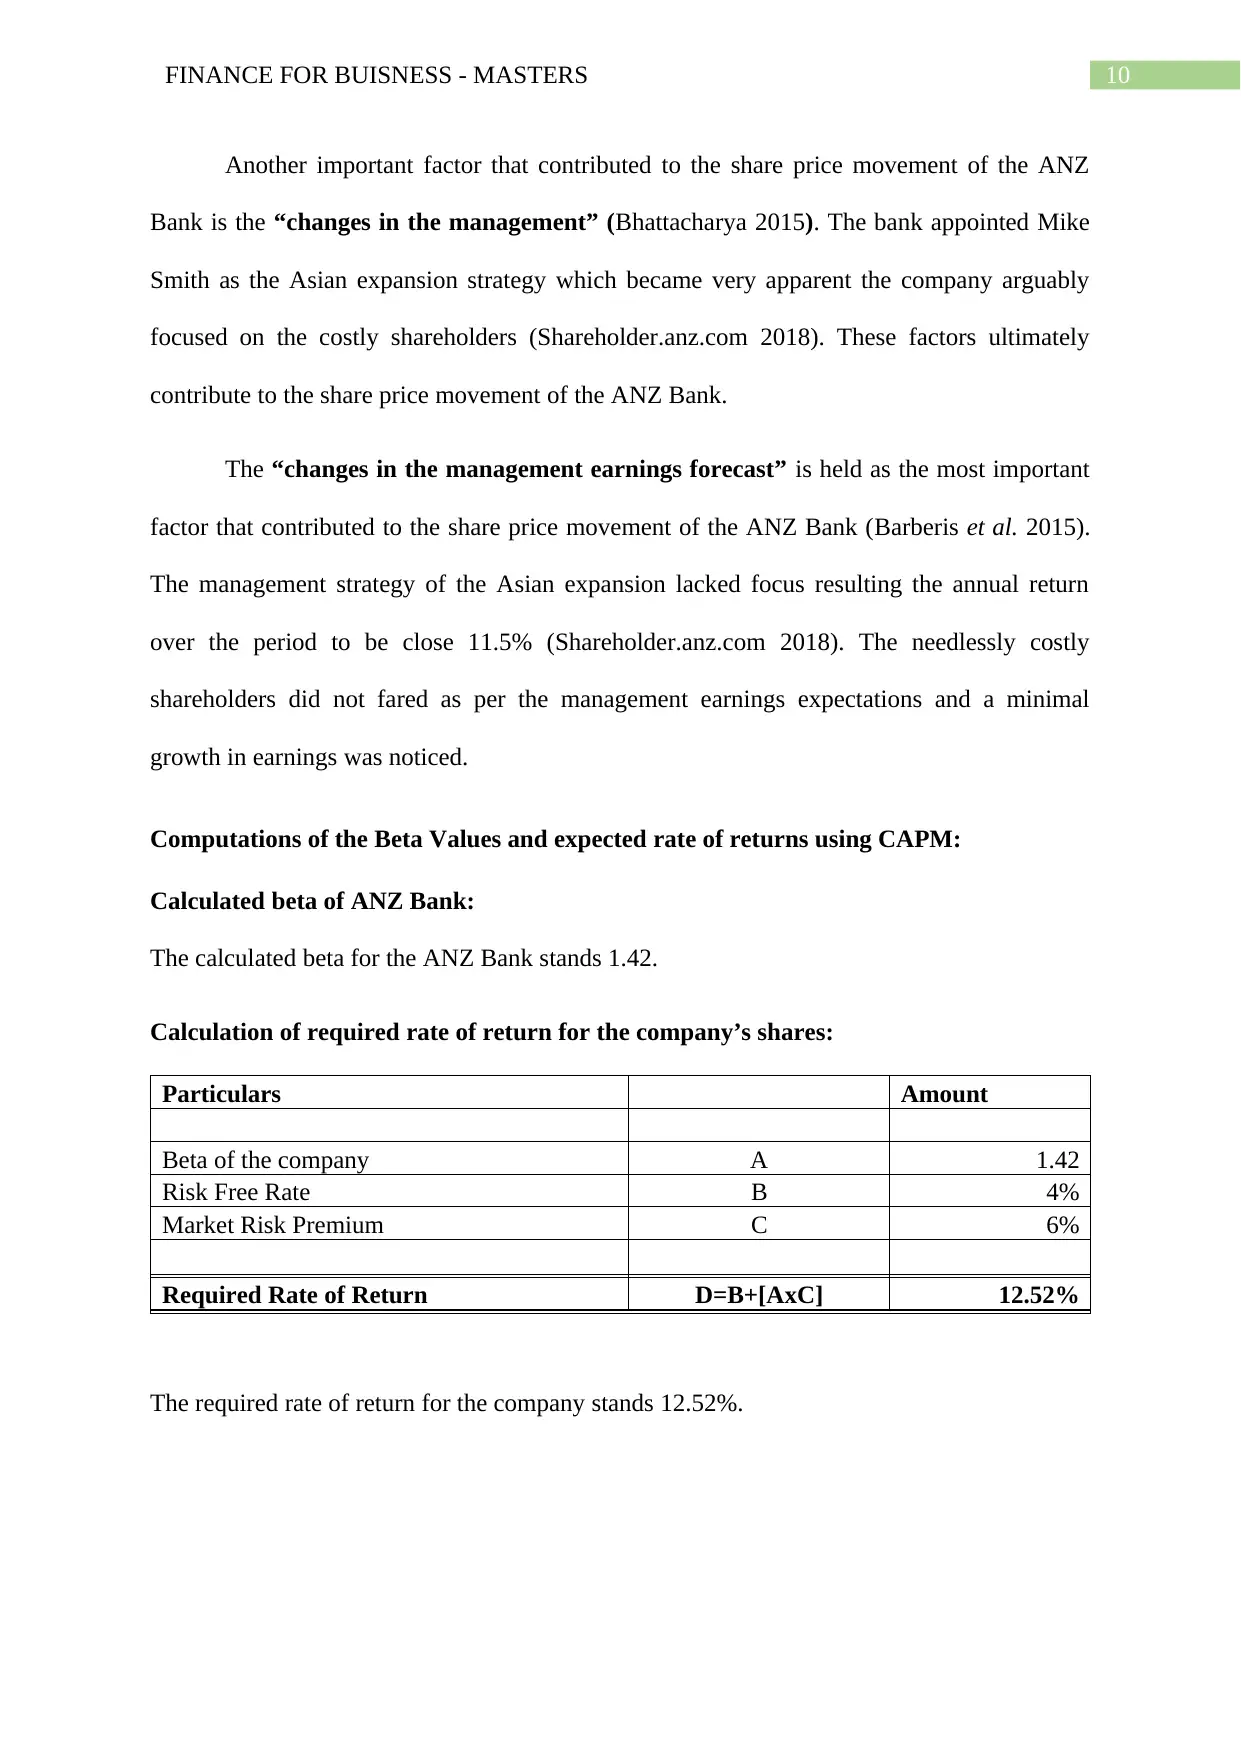
Computations of the Beta Values and expected rate of returns using CAPM:
Calculated beta of ANZ Bank:
The calculated beta for the ANZ Bank stands 1.42.
Calculation of required rate of return for the company’s shares:
Particulars Amount
Beta of the company A 1.42
Risk Free Rate B 4%
Market Risk Premium C 6%
Required Rate of Return D=B+[AxC] 12.52%
The required rate of return for the company stands 12.52%.
Another important factor that contributed to the share price movement of the ANZ
Bank is the “changes in the management” (Bhattacharya 2015). The bank appointed Mike
Smith as the Asian expansion strategy which became very apparent the company arguably
focused on the costly shareholders (Shareholder.anz.com 2018). These factors ultimately
contribute to the share price movement of the ANZ Bank.
The “changes in the management earnings forecast” is held as the most important
factor that contributed to the share price movement of the ANZ Bank (Barberis et al. 2015).
The management strategy of the Asian expansion lacked focus resulting the annual return
over the period to be close 11.5% (Shareholder.anz.com 2018). The needlessly costly
shareholders did not fared as per the management earnings expectations and a minimal
growth in earnings was noticed.
Computations of the Beta Values and expected rate of returns using CAPM:
Calculated beta of ANZ Bank:
The calculated beta for the ANZ Bank stands 1.42.
Calculation of required rate of return for the company’s shares:
Particulars Amount
Beta of the company A 1.42
Risk Free Rate B 4%
Market Risk Premium C 6%
Required Rate of Return D=B+[AxC] 12.52%
The required rate of return for the company stands 12.52%.
11FINANCE FOR BUISNESS - MASTERS
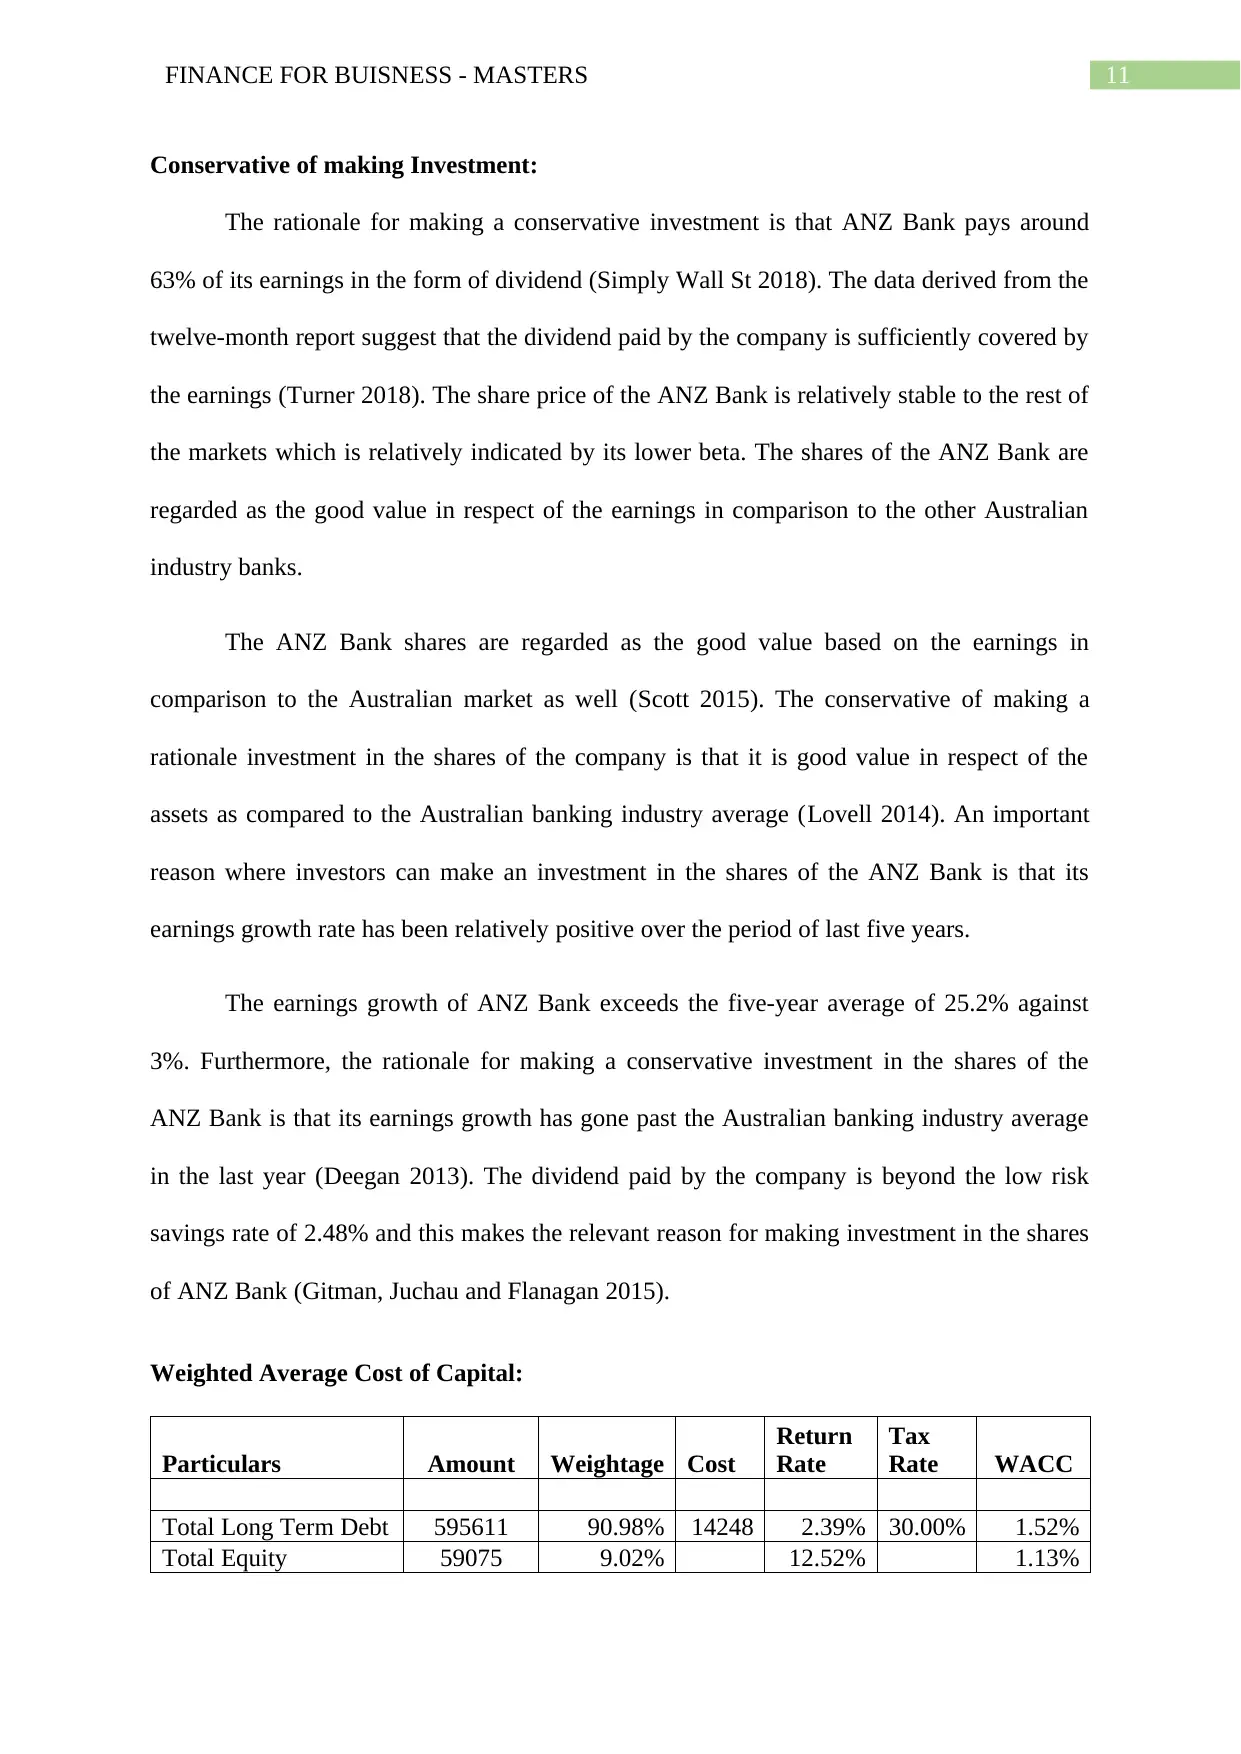
Conservative of making Investment:
The rationale for making a conservative investment is that ANZ Bank pays around
63% of its earnings in the form of dividend (Simply Wall St 2018). The data derived from the
twelve-month report suggest that the dividend paid by the company is sufficiently covered by
the earnings (Turner 2018). The share price of the ANZ Bank is relatively stable to the rest of
the markets which is relatively indicated by its lower beta. The shares of the ANZ Bank are
regarded as the good value in respect of the earnings in comparison to the other Australian
industry banks.
The ANZ Bank shares are regarded as the good value based on the earnings in
comparison to the Australian market as well (Scott 2015). The conservative of making a
rationale investment in the shares of the company is that it is good value in respect of the
assets as compared to the Australian banking industry average (Lovell 2014). An important
reason where investors can make an investment in the shares of the ANZ Bank is that its
earnings growth rate has been relatively positive over the period of last five years.
The earnings growth of ANZ Bank exceeds the five-year average of 25.2% against
3%. Furthermore, the rationale for making a conservative investment in the shares of the
ANZ Bank is that its earnings growth has gone past the Australian banking industry average
in the last year (Deegan 2013). The dividend paid by the company is beyond the low risk
savings rate of 2.48% and this makes the relevant reason for making investment in the shares
of ANZ Bank (Gitman, Juchau and Flanagan 2015).
Weighted Average Cost of Capital:
Particulars Amount Weightage Cost
Return
Rate
Tax
Rate WACC
Total Long Term Debt 595611 90.98% 14248 2.39% 30.00% 1.52%
Total Equity 59075 9.02% 12.52% 1.13%
⊘ This is a preview!⊘
Do you want full access?
Subscribe today to unlock all pages.
Trusted by 1+ million students worldwide
1 out of 18
Related Documents


Your All-in-One AI-Powered Toolkit for Academic Success.
+13062052269
info@desklib.com
Available 24*7 on WhatsApp / Email
![[object Object]](/_next/static/media/star-bottom.7253800d.svg)
Unlock your academic potential
Copyright © 2020–2026 A2Z Services. All Rights Reserved. Developed and managed by ZUCOL.