Quantitative Analysis: Forecasting Future Returns of ANZ Bank Stock

Verified

Added on  2023/06/10

|9
|1537
|395
Report
AI Summary
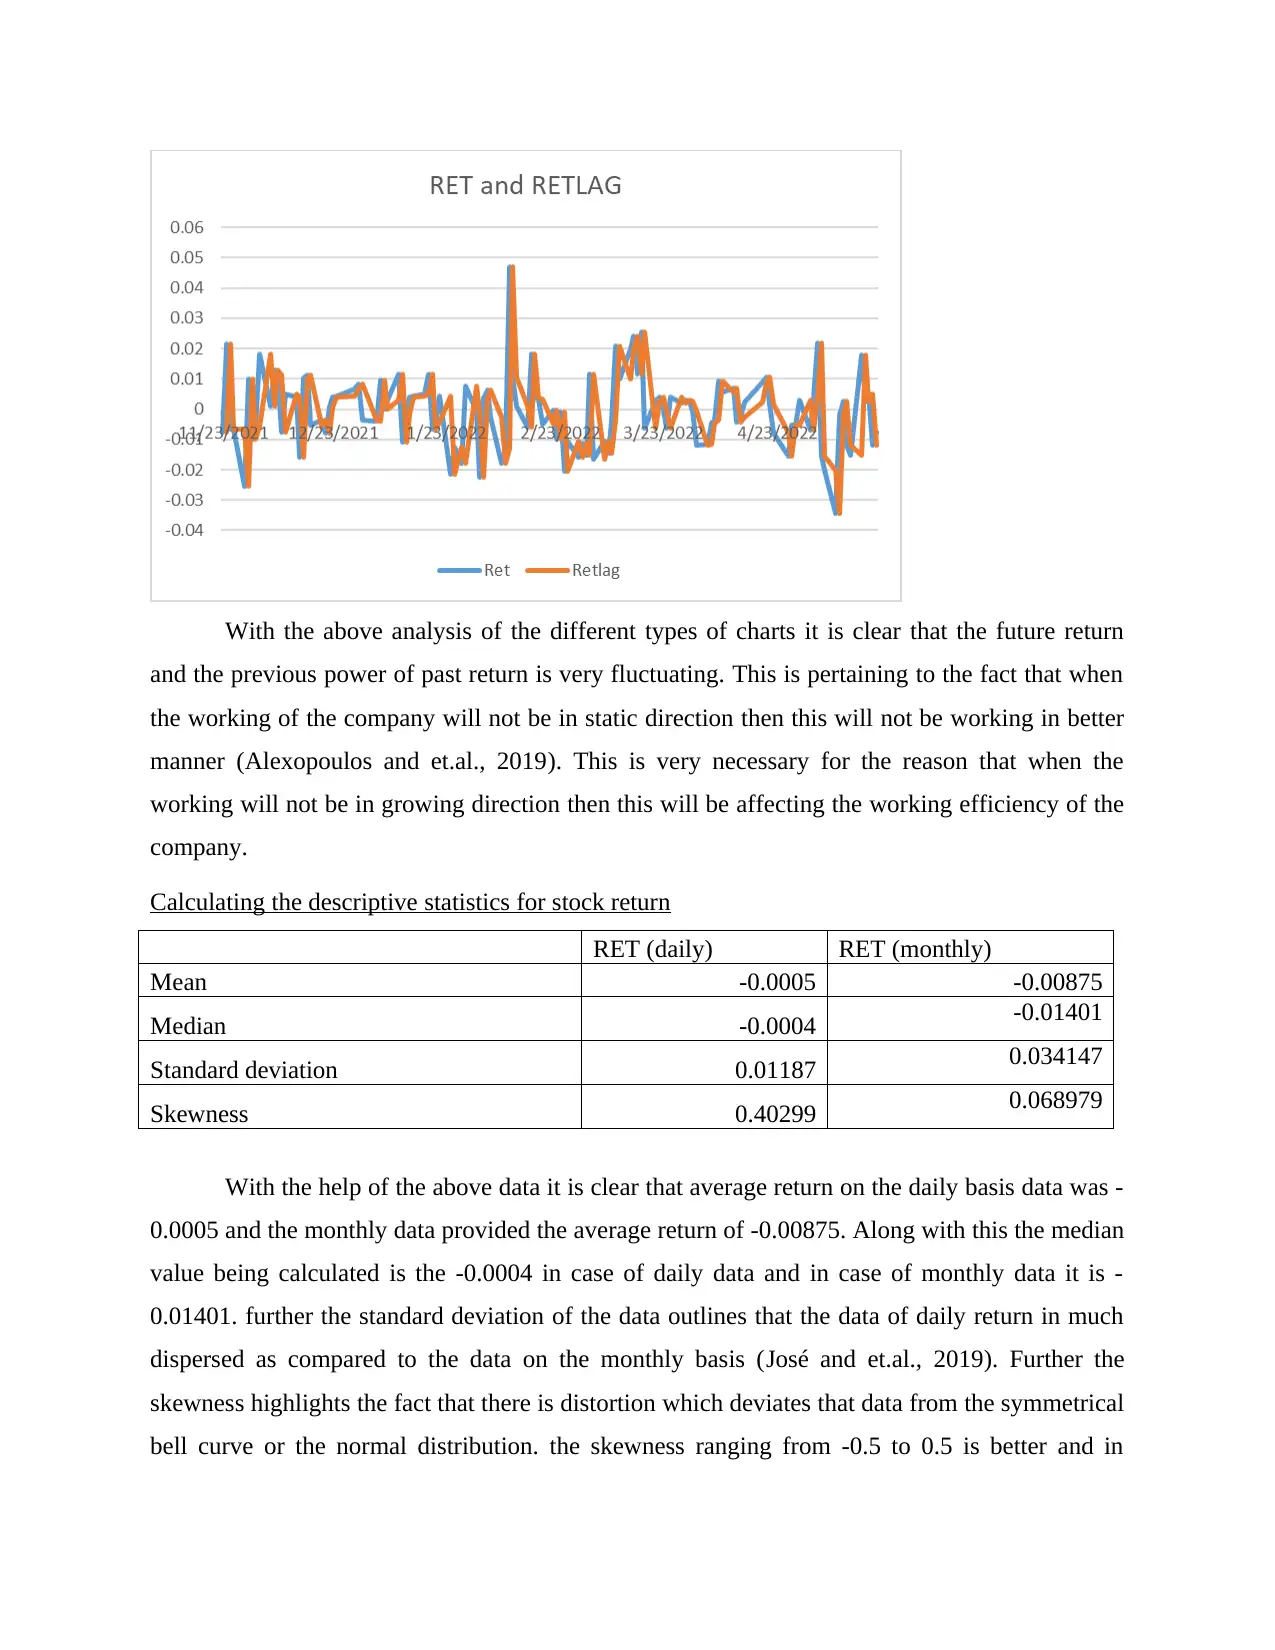
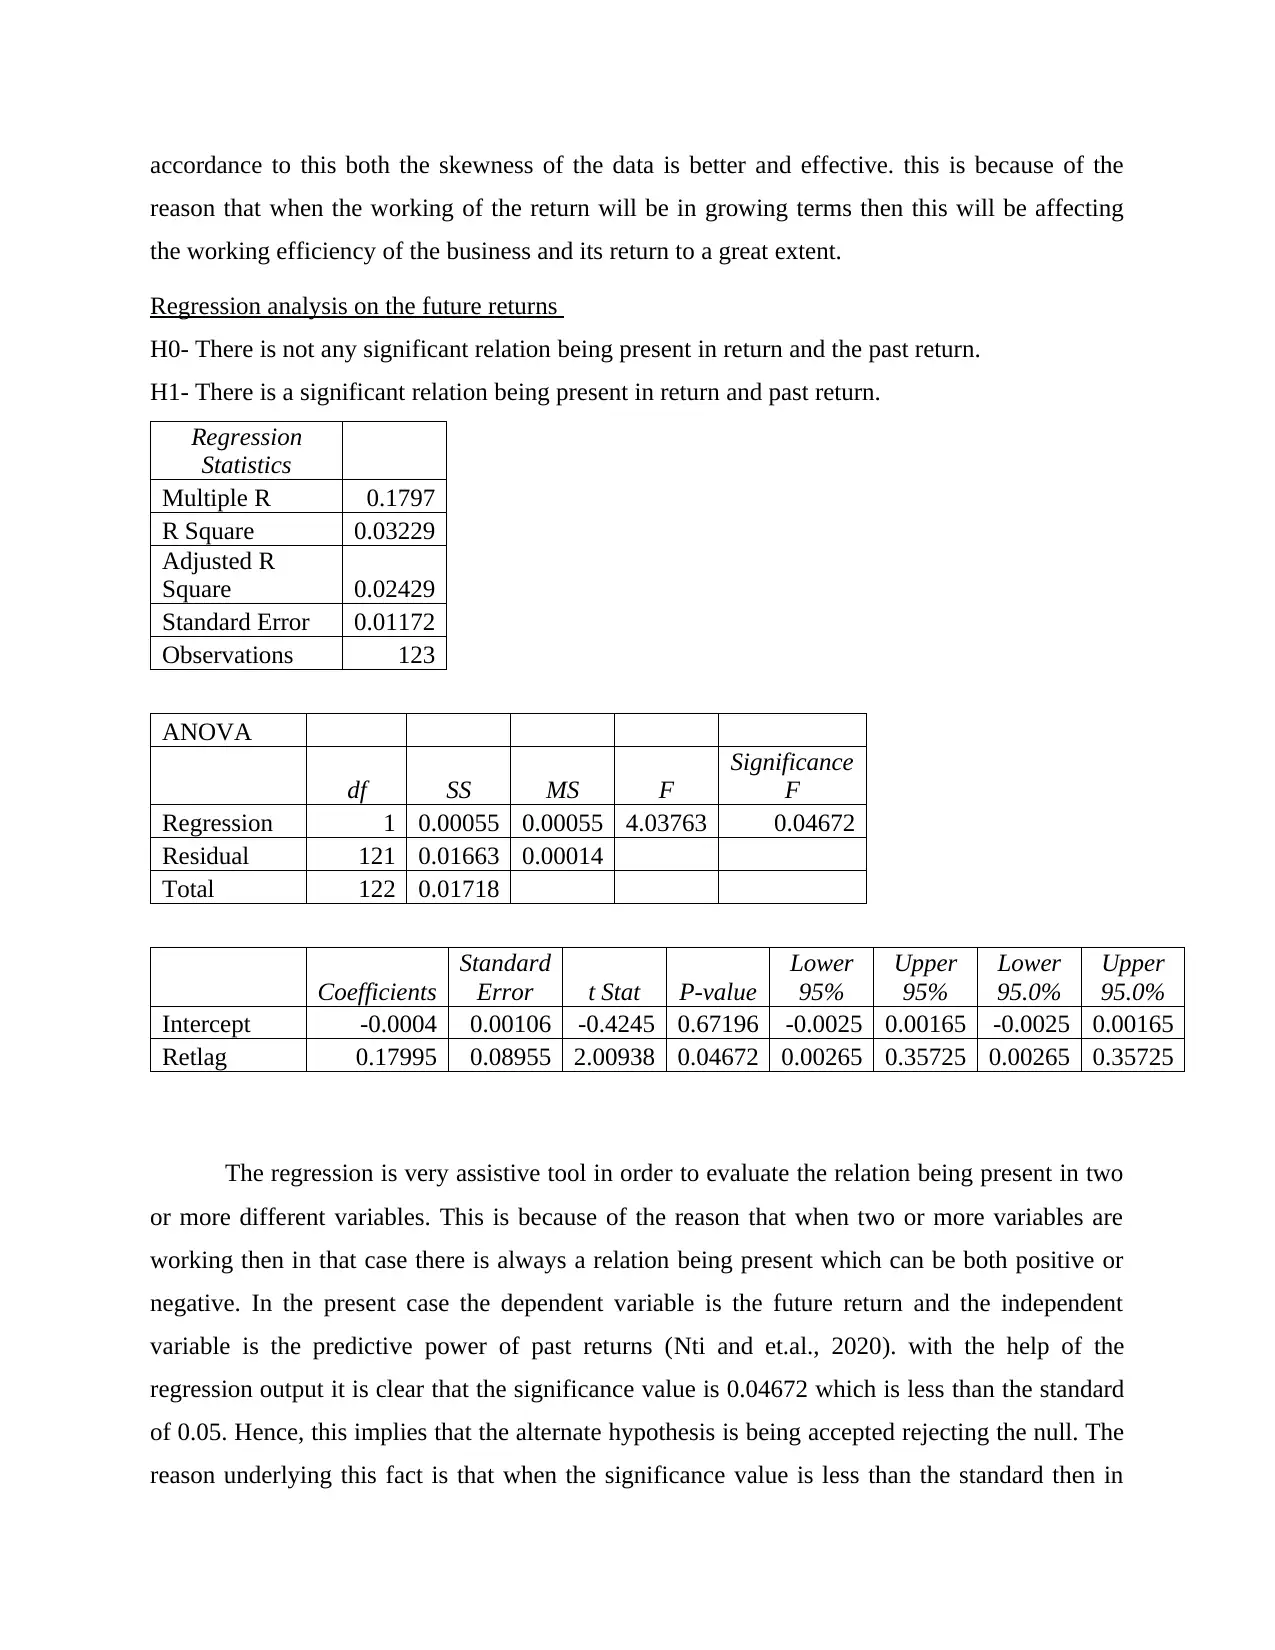
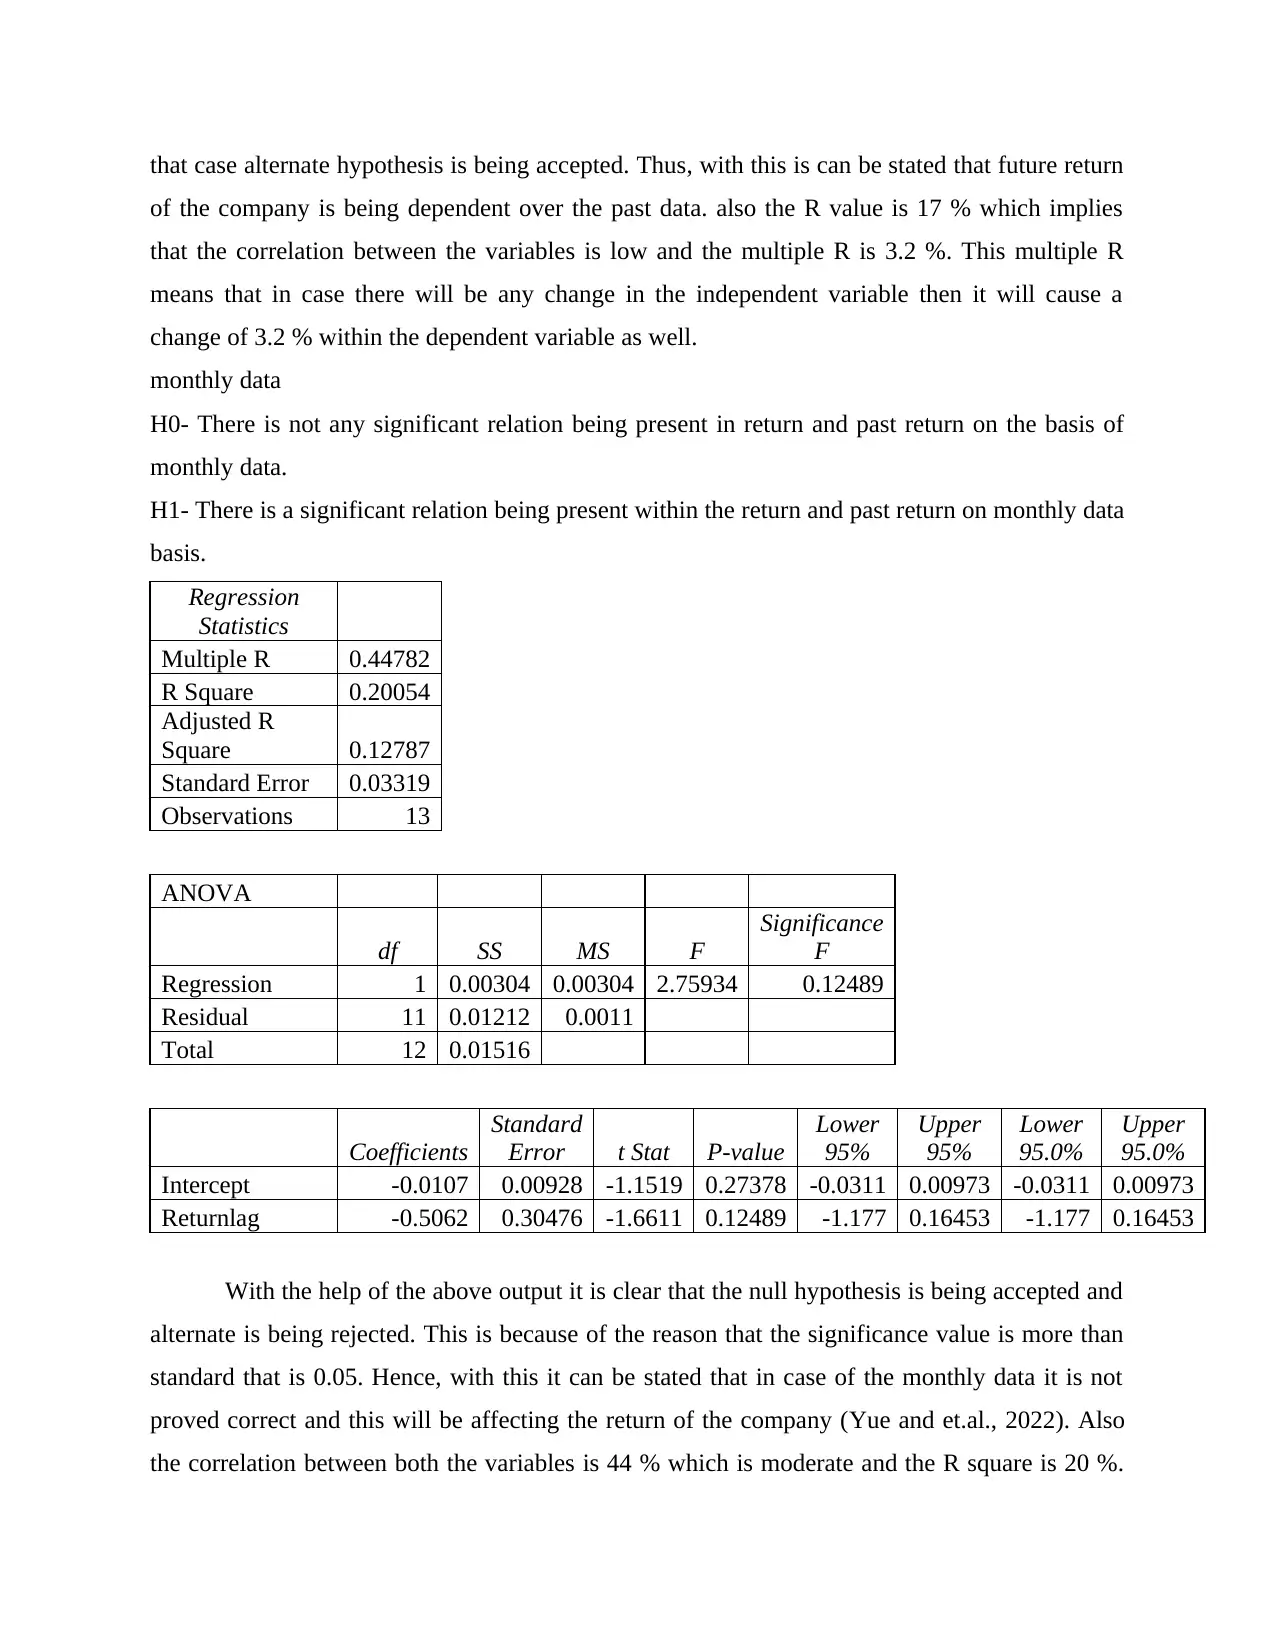
This report provides a quantitative analysis of ANZ Bank's stock returns, focusing on forecasting future performance based on historical data. Utilizing daily stock price data over the past six months, the analysis includes graphical data presentation, descriptive statistics calculation, and regression analysis. The descriptive statistics reveal average daily and monthly returns, standard deviation, and skewness, while the regression analysis assesses the relationship between past and future returns. The findings suggest a significant relationship between past and future returns based on daily data, but not on monthly data. The report concludes with recommendations for ANZ Bank, emphasizing the importance of employing diverse forecasting techniques and analyzing competitor data to enhance working efficiency and returns. This student-contributed document is available on Desklib.
Document Page
Forecasting and quantitative
analysis
tabler-icon-diamond-filled.svg

Paraphrase This Document

Need a fresh take? Get an instant paraphrase of this document with our AI Paraphraser
Document Page
TABLE OF CONTENTS
INTRODUCTION...........................................................................................................................3
MAIN BODY...................................................................................................................................3
Presenting the data graphically...................................................................................................3
Calculating the descriptive statistics for stock return.................................................................5
Regression analysis on the future returns....................................................................................6
CONCLUSION AND RECOMMENDAITON...............................................................................8
REFERENCES................................................................................................................................9
Document Page
INTRODUCTION
Business forecasting is being defined as the prediction of the future working on the basis
of the past data. this is very necessary for the reason that when the analysis is being undertaken
on the basis of the past data then the future prediction is very easy and will be appropriate as
well. The current report is based on ANZ bank which is Australia and New Zealand banking
group which is a banking and financial service working as a multinational company. The present
report will outline the analysis of the returns data of ANZ bank in order to predict the future
return on the basis of the existing historical data. The time interval chosen for the analysis of the
data is daily and the time period selected is past 6 months (Australia and New Zealand Banking
Group Limited (ANZ.AX), 2022). The analysis will be undertaken on the open price of the
company stock price and then with help of this the past return (RETLAG) and the future returns
(RET) will be calculated. Along with this with help of regression analysis the future prediction
will be made in order to improve the working of the company.
MAIN BODY
Presenting the data graphically
Document Page
tabler-icon-diamond-filled.svg

Paraphrase This Document

Need a fresh take? Get an instant paraphrase of this document with our AI Paraphraser
Document Page
With the above analysis of the different types of charts it is clear that the future return
and the previous power of past return is very fluctuating. This is pertaining to the fact that when
the working of the company will not be in static direction then this will not be working in better
manner (Alexopoulos and et.al., 2019). This is very necessary for the reason that when the
working will not be in growing direction then this will be affecting the working efficiency of the
company.
Calculating the descriptive statistics for stock return
RET (daily) RET (monthly)
Mean -0.0005 -0.00875
Median -0.0004 -0.01401
Standard deviation 0.01187 0.034147
Skewness 0.40299 0.068979
With the help of the above data it is clear that average return on the daily basis data was -
0.0005 and the monthly data provided the average return of -0.00875. Along with this the median
value being calculated is the -0.0004 in case of daily data and in case of monthly data it is -
0.01401. further the standard deviation of the data outlines that the data of daily return in much
dispersed as compared to the data on the monthly basis (José and et.al., 2019). Further the
skewness highlights the fact that there is distortion which deviates that data from the symmetrical
bell curve or the normal distribution. the skewness ranging from -0.5 to 0.5 is better and in
Document Page
accordance to this both the skewness of the data is better and effective. this is because of the
reason that when the working of the return will be in growing terms then this will be affecting
the working efficiency of the business and its return to a great extent.
Regression analysis on the future returns
H0- There is not any significant relation being present in return and the past return.
H1- There is a significant relation being present in return and past return.
Regression
Statistics
Multiple R 0.1797
R Square 0.03229
Adjusted R
Square 0.02429
Standard Error 0.01172
Observations 123
ANOVA
df SS MS F
Significance
F
Regression 1 0.00055 0.00055 4.03763 0.04672
Residual 121 0.01663 0.00014
Total 122 0.01718
Coefficients
Standard
Error t Stat P-value
Lower
95%
Upper
95%
Lower
95.0%
Upper
95.0%
Intercept -0.0004 0.00106 -0.4245 0.67196 -0.0025 0.00165 -0.0025 0.00165
Retlag 0.17995 0.08955 2.00938 0.04672 0.00265 0.35725 0.00265 0.35725
The regression is very assistive tool in order to evaluate the relation being present in two
or more different variables. This is because of the reason that when two or more variables are
working then in that case there is always a relation being present which can be both positive or
negative. In the present case the dependent variable is the future return and the independent
variable is the predictive power of past returns (Nti and et.al., 2020). with the help of the
regression output it is clear that the significance value is 0.04672 which is less than the standard
of 0.05. Hence, this implies that the alternate hypothesis is being accepted rejecting the null. The
reason underlying this fact is that when the significance value is less than the standard then in
Document Page
that case alternate hypothesis is being accepted. Thus, with this is can be stated that future return
of the company is being dependent over the past data. also the R value is 17 % which implies
that the correlation between the variables is low and the multiple R is 3.2 %. This multiple R
means that in case there will be any change in the independent variable then it will cause a
change of 3.2 % within the dependent variable as well.
monthly data
H0- There is not any significant relation being present in return and past return on the basis of
monthly data.
H1- There is a significant relation being present within the return and past return on monthly data
basis.
Regression
Statistics
Multiple R 0.44782
R Square 0.20054
Adjusted R
Square 0.12787
Standard Error 0.03319
Observations 13
ANOVA
df SS MS F
Significance
F
Regression 1 0.00304 0.00304 2.75934 0.12489
Residual 11 0.01212 0.0011
Total 12 0.01516
Coefficients
Standard
Error t Stat P-value
Lower
95%
Upper
95%
Lower
95.0%
Upper
95.0%
Intercept -0.0107 0.00928 -1.1519 0.27378 -0.0311 0.00973 -0.0311 0.00973
Returnlag -0.5062 0.30476 -1.6611 0.12489 -1.177 0.16453 -1.177 0.16453
With the help of the above output it is clear that the null hypothesis is being accepted and
alternate is being rejected. This is because of the reason that the significance value is more than
standard that is 0.05. Hence, with this it can be stated that in case of the monthly data it is not
proved correct and this will be affecting the return of the company (Yue and et.al., 2022). Also
the correlation between both the variables is 44 % which is moderate and the R square is 20 %.
tabler-icon-diamond-filled.svg

Paraphrase This Document

Need a fresh take? Get an instant paraphrase of this document with our AI Paraphraser
Document Page
This simply means that the changes taking place within the independent variable will be causing
the changes in the dependent variable that is future returns as well.
CONCLUSION AND RECOMMENDAITON
In the end it can be concluded that for the successful working of the company it is very
necessary that company implements good forecasting techniques. This is very essential for the
reason that when the proper forecasting will not be used then it will be affecting the working of
the company. the above report evaluated that use of descriptive and regression analysis is
important in order to analyse and forecast the data in better and effective manner. The above
analysis highlighted the fact that in case of daily data the hypothesis is being proved and in case
of monthly data it is not being proved correct.
some of the recommendation being provided to ANZ bank to improve the working and
returns of the company are as follows-
it is recommended that company must use the different types of the tools for the analysis
of the past data in order to predict the future values as well.
Along with this it is advisable to company to evaluate the data of the competitor as well.
In case the data of the competitor will be analysed in proper manner then this will be improving
the working efficiency of the business. This is because of the reason that it will be providing a
base to ANZ bank for making their own strategy.
Document Page
REFERENCES
Books and Journals
Alexopoulos, N. and et.al., 2019, November. Poster: Towards Automated Quantitative Analysis
and Forecasting of Vulnerability Discoveries in Debian GNU/Linux. In Proceedings of the
2019 ACM SIGSAC Conference on Computer and Communications Security (pp. 2677-
2679).
José, M. and et.al., 2019. Quantitative forecasting black (pyrogenic) carbon in soils by
chemometric analysis of infrared spectra. Journal of environmental management. 251.
p.109567.
Nti, I. K. and et.al., 2020. Electricity load forecasting: a systematic review. Journal of Electrical
Systems and Information Technology. 7(1). pp.1-19.
Yue, J. C. and et.al., 2022. A study of forecasting tennis matches via the Glicko model. Plos
one. 17(4). p.e0266838.
Online
Australia and New Zealand Banking Group Limited (ANZ.AX). 2022. [Online]. available
through: < https://finance.yahoo.com/quote/anz.ax/>
chevron_up_icon
1 out of 9
circle_padding
hide_on_mobile
zoom_out_icon
[object Object]