Financial Ratio Analysis Report: ANZ Banking Group (2016-2017)
VerifiedAdded on 2021/06/14
|10
|1988
|26
Report
AI Summary
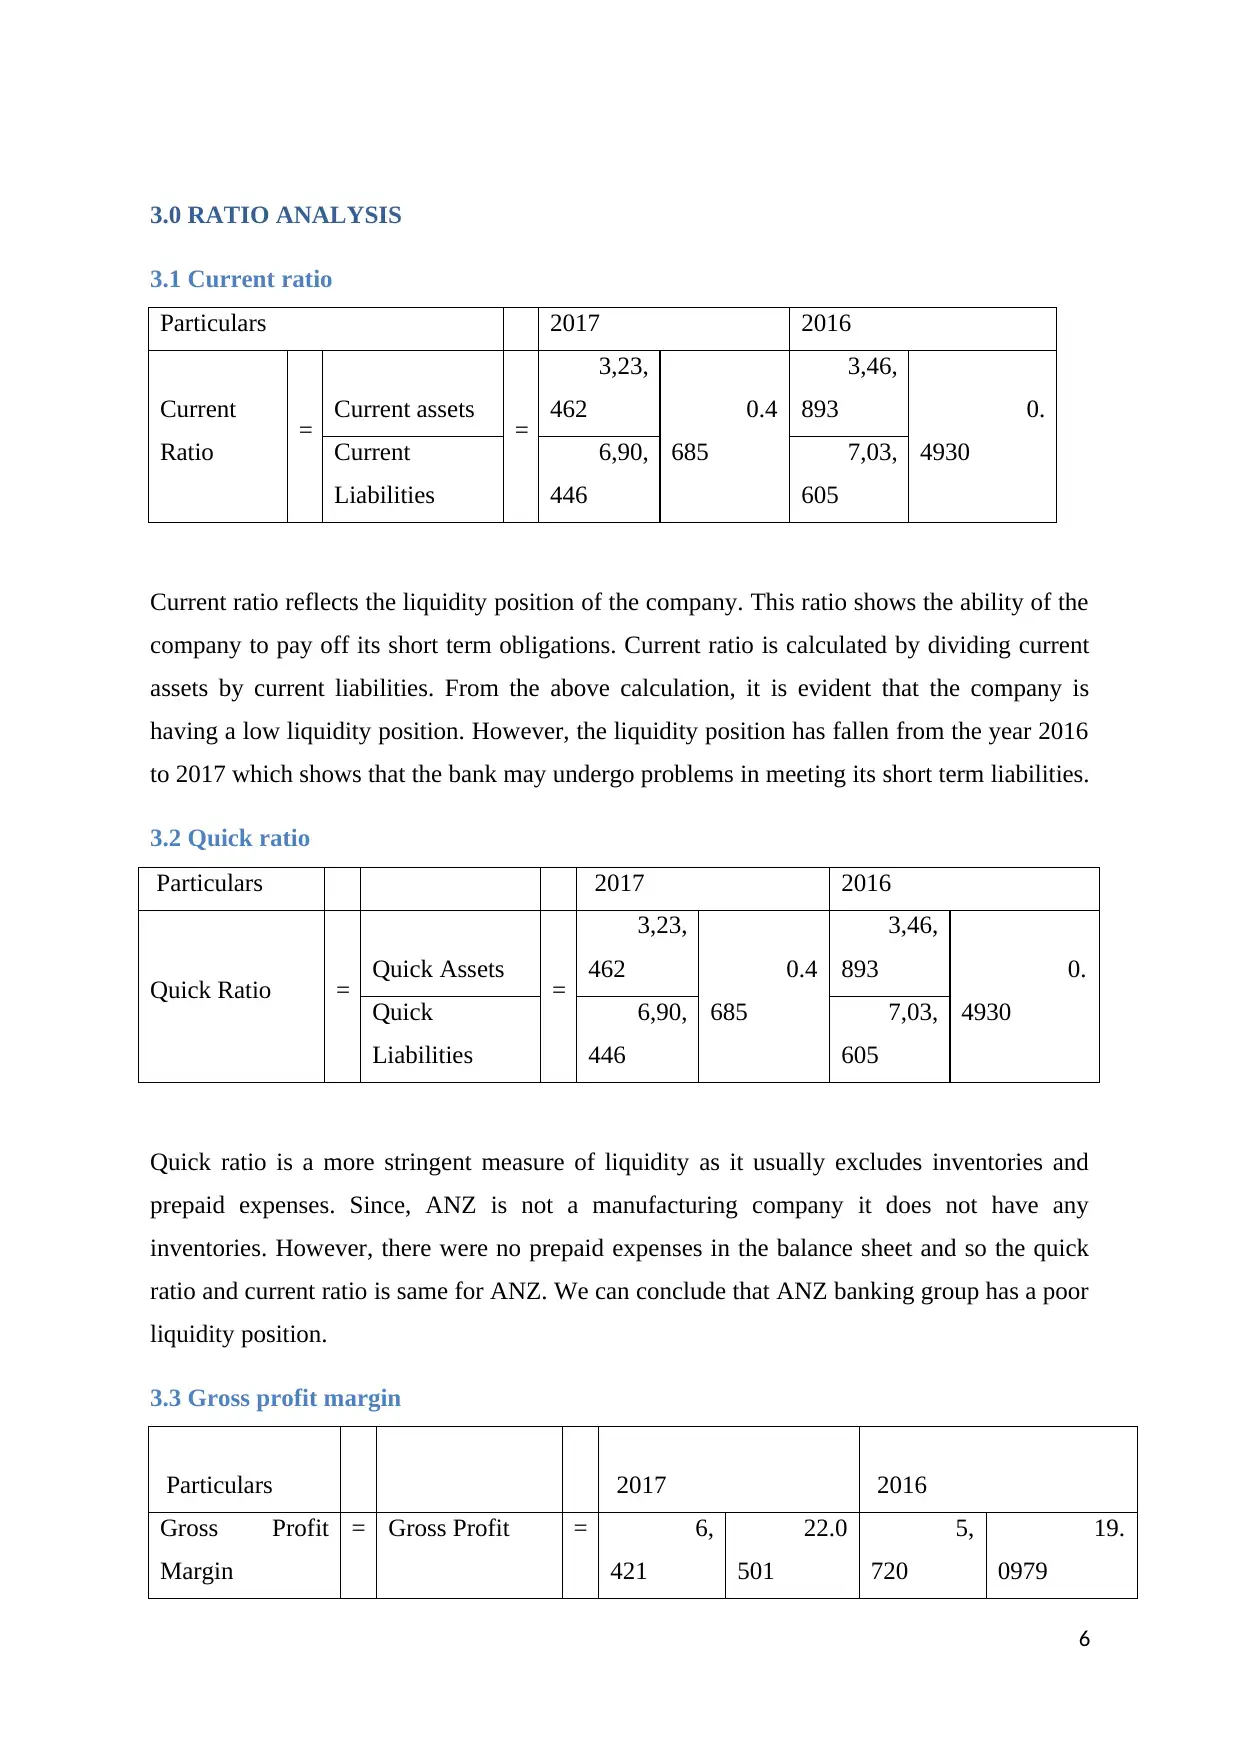
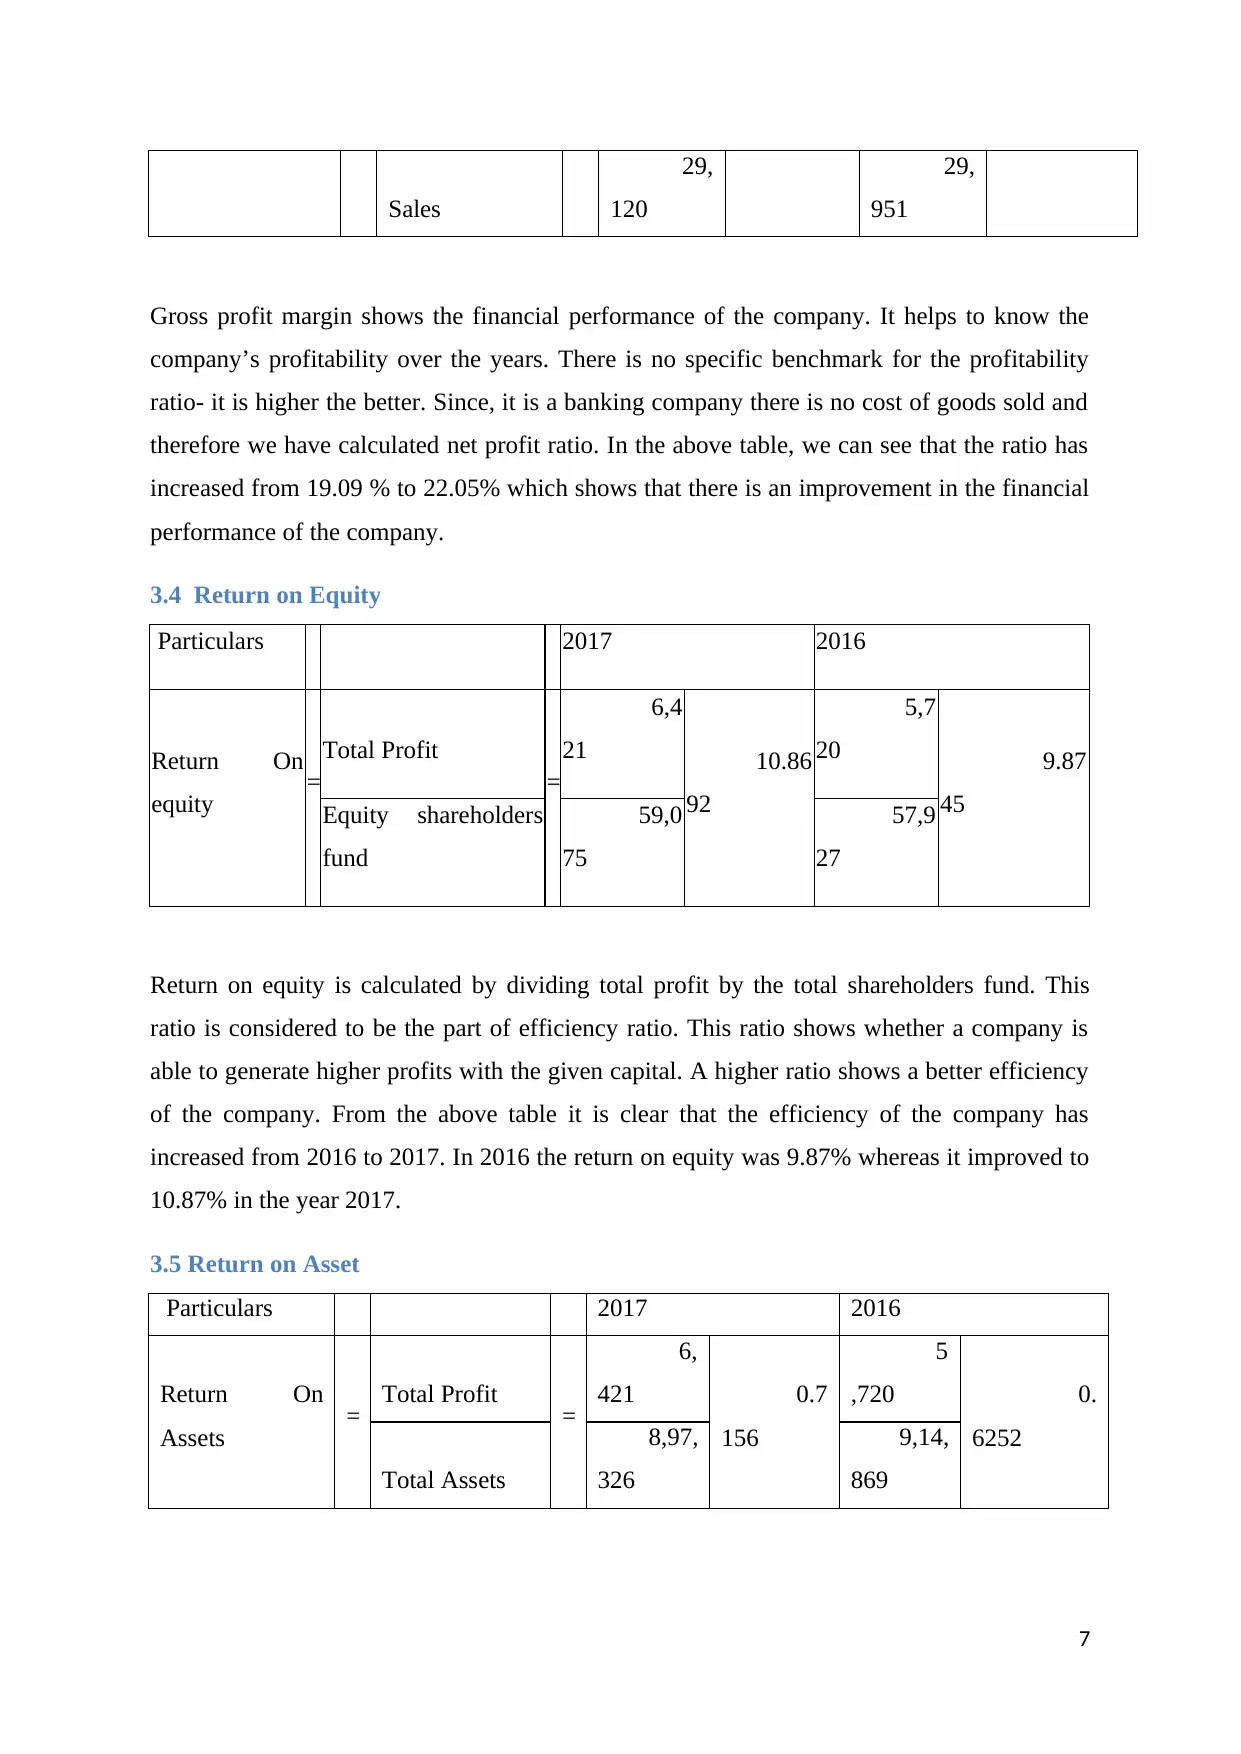
This assignment is a comprehensive ratio analysis of the Australian and New Zealand Banking Group (ANZ) for the years 2016 and 2017. The report examines various financial ratios, including current ratio, quick ratio, gross profit margin, return on equity, and return on assets, to evaluate the company's liquidity, profitability, and efficiency. The analysis includes detailed calculations, interpretations, and comparisons of these ratios, highlighting trends and insights into ANZ's financial performance. The report also provides an overview of the company, its operations, and its position within the industry. Furthermore, the analysis extends to a comparison of ANZ's financial ratios with those of two other companies in the same industry, namely Bank of Queensland and AMP Ltd, to provide a comparative perspective. The report concludes with an overall assessment of ANZ's financial health and recommendations for investors, emphasizing the importance of considering both quantitative and qualitative factors in decision-making. The report uses financial statements and industry benchmarks to provide a comprehensive analysis of the company's financial health.

ACCOUNTING FOR BUSINESS
1
1
Paraphrase This Document
Need a fresh take? Get an instant paraphrase of this document with our AI Paraphraser

EXECUTIVE SUMMARY
This assignment is based on ratio analysis which is used as a tool of decision making by
various stakeholders. Ratio analysis helps in evaluating and comparing the financial position
and financial performance of a company. However, the meaning of each ratio, the
comparison with the benchmark and comparison of these ratios with two other companies in
the same industry is included. The project also contains the overview of the company selected
along with the analysis of various ratios.
2

Contents
1.0 INTRODUCTION................................................................................................................4
Purpose...................................................................................................................................4
Scope......................................................................................................................................4
Limitations..............................................................................................................................4
COMPANY OVERVIEW.........................................................................................................5
3.0 RATIO ANALYSIS.............................................................................................................6
3.1 Current ratio......................................................................................................................6
3.2 Quick ratio........................................................................................................................6
3.3 Gross profit margin...........................................................................................................6
3.4 Return on Equity..............................................................................................................7
3.5 Return on Asset................................................................................................................7
4.0 ANALYSIS AND CONCLUSION......................................................................................8
Bibliography...............................................................................................................................9
3
⊘ This is a preview!⊘
Do you want full access?
Subscribe today to unlock all pages.

Trusted by 1+ million students worldwide

1.0 INTRODUCTION
This assignment consists of ratio analysis of Australian and New Zealand banking group of
the past two years. It will help us to evaluate and analyse the financial position and
performance of the company for that two years.
Purpose
The purpose of this assignment is to know about the company and its financial condition.
Ratio analysis helps to compare the financial performance and position of the company which
helps the investors to know the growth prospects and take investment decisions accordingly.
Scope
In this assignment, five ratios are calculated for the year 2016 and 2017. The ratios calculated
include profitability ratio, liquidity ratio and efficiency ratio. Gross profit ratio is calculated
as a profitability ratio; Current asset ratio and quick ratio under liquidity ratio and efficiency
ratio include return on assets and return on equity. A brief description along with the analysis
of these ratios is mentioned in this project.
Limitations
Ratio analysis is subjective in nature and therefore, the judgements of people may vary from
each other. These are performed on the basis of the financial statements which we know are
window dressed. There are various accounting policies and procedures followed by different
companies therefore; it is difficult to do compare the results of the ratios.
4
Paraphrase This Document
Need a fresh take? Get an instant paraphrase of this document with our AI Paraphraser

COMPANY OVERVIEW
Australian and New Zealand banking group (ANZ) was formed in the year 1835 in Sydney.
The headquarters of ANZ was established in 1838 at Melbourne. It is a public traded
company that was incorporated in 1977 on 14th July in Australia. It is considered to be one of
the most popular and best banks in New Zealand. It is also counted as one of the largest listed
companies in Australia. It holds total asset of AU$914.9 billion as on 30th September 2016. It
has a wide market which includes 34 markets across various different countries such as
Australia, Asia, New Zealand, , Europe, America and many other countries. The securities of
ANZ are listed on Australian and New Zealand stock exchanges and it has around 5,45,000
shareholders.
ANZ has around 10 million customers all over the world and it aims to fulfil the requirements
of the customers and provide them with the best services possible. Along with the strong
customer base ANZ also has a large number of employees which total to 50,000
approximately.
The banking group also pays attention to corporate sustainability i.e. they believe in
delivering and satisfying needs of the customers, shareholders, employees and other
stakeholders apart from earning profits. The three priority areas that are covered by them are
Sustainable development which means that the company takes into account the
environmental and other social factors that would help to serve the customers in the long run.
Diversity and Inclusion i.e. Building a larger and efficient workforce that would helps in
carrying out the operation more efficiently and smoothly.
Financial inclusion and capability- It aims at encouraging the financial inclusion and
progression of individuals and committees.
5

3.0 RATIO ANALYSIS
3.1 Current ratio
Particulars 2017 2016
Current
Ratio = Current assets =
3,23,
462 0.4
685
3,46,
893 0.
4930Current
Liabilities
6,90,
446
7,03,
605
Current ratio reflects the liquidity position of the company. This ratio shows the ability of the
company to pay off its short term obligations. Current ratio is calculated by dividing current
assets by current liabilities. From the above calculation, it is evident that the company is
having a low liquidity position. However, the liquidity position has fallen from the year 2016
to 2017 which shows that the bank may undergo problems in meeting its short term liabilities.
3.2 Quick ratio
Particulars 2017 2016
Quick Ratio = Quick Assets =
3,23,
462 0.4
685
3,46,
893 0.
4930Quick
Liabilities
6,90,
446
7,03,
605
Quick ratio is a more stringent measure of liquidity as it usually excludes inventories and
prepaid expenses. Since, ANZ is not a manufacturing company it does not have any
inventories. However, there were no prepaid expenses in the balance sheet and so the quick
ratio and current ratio is same for ANZ. We can conclude that ANZ banking group has a poor
liquidity position.
3.3 Gross profit margin
Particulars 2017 2016
Gross Profit
Margin
= Gross Profit = 6,
421
22.0
501
5,
720
19.
0979
6
⊘ This is a preview!⊘
Do you want full access?
Subscribe today to unlock all pages.

Trusted by 1+ million students worldwide

Sales
29,
120
29,
951
Gross profit margin shows the financial performance of the company. It helps to know the
company’s profitability over the years. There is no specific benchmark for the profitability
ratio- it is higher the better. Since, it is a banking company there is no cost of goods sold and
therefore we have calculated net profit ratio. In the above table, we can see that the ratio has
increased from 19.09 % to 22.05% which shows that there is an improvement in the financial
performance of the company.
3.4 Return on Equity
Particulars 2017 2016
Return On
equity =
Total Profit
=
6,4
21 10.86
92
5,7
20 9.87
45Equity shareholders
fund
59,0
75
57,9
27
Return on equity is calculated by dividing total profit by the total shareholders fund. This
ratio is considered to be the part of efficiency ratio. This ratio shows whether a company is
able to generate higher profits with the given capital. A higher ratio shows a better efficiency
of the company. From the above table it is clear that the efficiency of the company has
increased from 2016 to 2017. In 2016 the return on equity was 9.87% whereas it improved to
10.87% in the year 2017.
3.5 Return on Asset
Particulars 2017 2016
Return On
Assets = Total Profit =
6,
421 0.7
156
5
,720 0.
6252
Total Assets
8,97,
326
9,14,
869
7
29,
120
29,
951
Gross profit margin shows the financial performance of the company. It helps to know the
company’s profitability over the years. There is no specific benchmark for the profitability
ratio- it is higher the better. Since, it is a banking company there is no cost of goods sold and
therefore we have calculated net profit ratio. In the above table, we can see that the ratio has
increased from 19.09 % to 22.05% which shows that there is an improvement in the financial
performance of the company.
3.4 Return on Equity
Particulars 2017 2016
Return On
equity =
Total Profit
=
6,4
21 10.86
92
5,7
20 9.87
45Equity shareholders
fund
59,0
75
57,9
27
Return on equity is calculated by dividing total profit by the total shareholders fund. This
ratio is considered to be the part of efficiency ratio. This ratio shows whether a company is
able to generate higher profits with the given capital. A higher ratio shows a better efficiency
of the company. From the above table it is clear that the efficiency of the company has
increased from 2016 to 2017. In 2016 the return on equity was 9.87% whereas it improved to
10.87% in the year 2017.
3.5 Return on Asset
Particulars 2017 2016
Return On
Assets = Total Profit =
6,
421 0.7
156
5
,720 0.
6252
Total Assets
8,97,
326
9,14,
869
7
Paraphrase This Document
Need a fresh take? Get an instant paraphrase of this document with our AI Paraphraser

Return on asset is also a part of efficiency ratio. This ratio helps to know whether the
company is able to use its resources in the best possible manner in order to generate higher
returns. If the company is able to use its resources properly then it will result to a better and
higher return on asset ratio. As we can see in the above table that there has been an increase
in the return on asset ratio, we can say that the company is making a better utilisation of its
asset compared to the previous year.
8

4.0 ANALYSIS AND CONCLUSION
Ratio analysis is a tool used by the investors in order to take correct and meaningful
decisions. It helps them to compare the financial performance, position and stability of the
company in order to know about its future growth prospects. On examining the ratios for the
past two years it has been found out that the liquidity position of the company is weak as the
current ratio and quick ratio has fallen. However, there has been an improvement in the
profitability and efficiency ratios which reflects the efficient working of the management. It
is the primary objective of every company to earn higher profits as it would result into
shareholders wealth maximisation. Also, it is important to use the resources available in the
best possible manner in order to satisfy the expectations of the shareholders.
However, only these ratios are not sufficient for the matter of decision making, it is important
for the company to look upon solvency position of the company as well. There are various
other non quantitative factors that the investor must look upon before making a final
conclusion. There may be certain qualitative factors that may have an influence on the
decision made by an investor such as the company’s corporate social responsibility and
corporate governance.
Let us now compare ANZ banking group with two other companies of the same industry. The
two companies that have been selected for comparison are Bank of Queensland and AMP ltd.
In order to compare these two companies with ANZ banking group let us acknowledge the
current year’s status of all the three companies. The profitability of ANZ banking group in
the year 2017 22% whereas the profitability ratio of Bank of Queensland and AMP ltd is
15.49% and 5.10% approximately which shows that ANZ has a better financial performance.
Now let us compare the efficiency ratios- Return on equity ratio of ANZ banking group for
the current year is calculated as 10.87% whereas for Bank of Queensland it is 9.57% and for
AMP ltd it is 11.57%. Also, when we look upon the return on asset ratio we can see that in
the current year ANZ has attained a ratio of 0.72 whereas both Queensland and AMP has
their ratio less than this which is 0.69 and 0.59 respectively. This shows that ANZ banking
group manages its resources better than the other two companies in the same industry.
Therefore, on comparison we can conclude that the financial ratios are favourable of ANZ
banking group and it can be recommended to the investors. Investors wish for wealth
maximisation which is possible only when the company shows an upward trend in the
9
⊘ This is a preview!⊘
Do you want full access?
Subscribe today to unlock all pages.

Trusted by 1+ million students worldwide

profitability. Also the management of the company is efficient which is depicted in the
growing trend of the efficiency ratio.
10
growing trend of the efficiency ratio.
10
1 out of 10
Related Documents

Your All-in-One AI-Powered Toolkit for Academic Success.
+13062052269
info@desklib.com
Available 24*7 on WhatsApp / Email
Unlock your academic potential
Copyright © 2020–2025 A2Z Services. All Rights Reserved. Developed and managed by ZUCOL.