Comprehensive Financial Analysis of ANZ Bank: 2016-2018 Performance
VerifiedAdded on 2022/10/17
|7
|1521
|8
Report
AI Summary
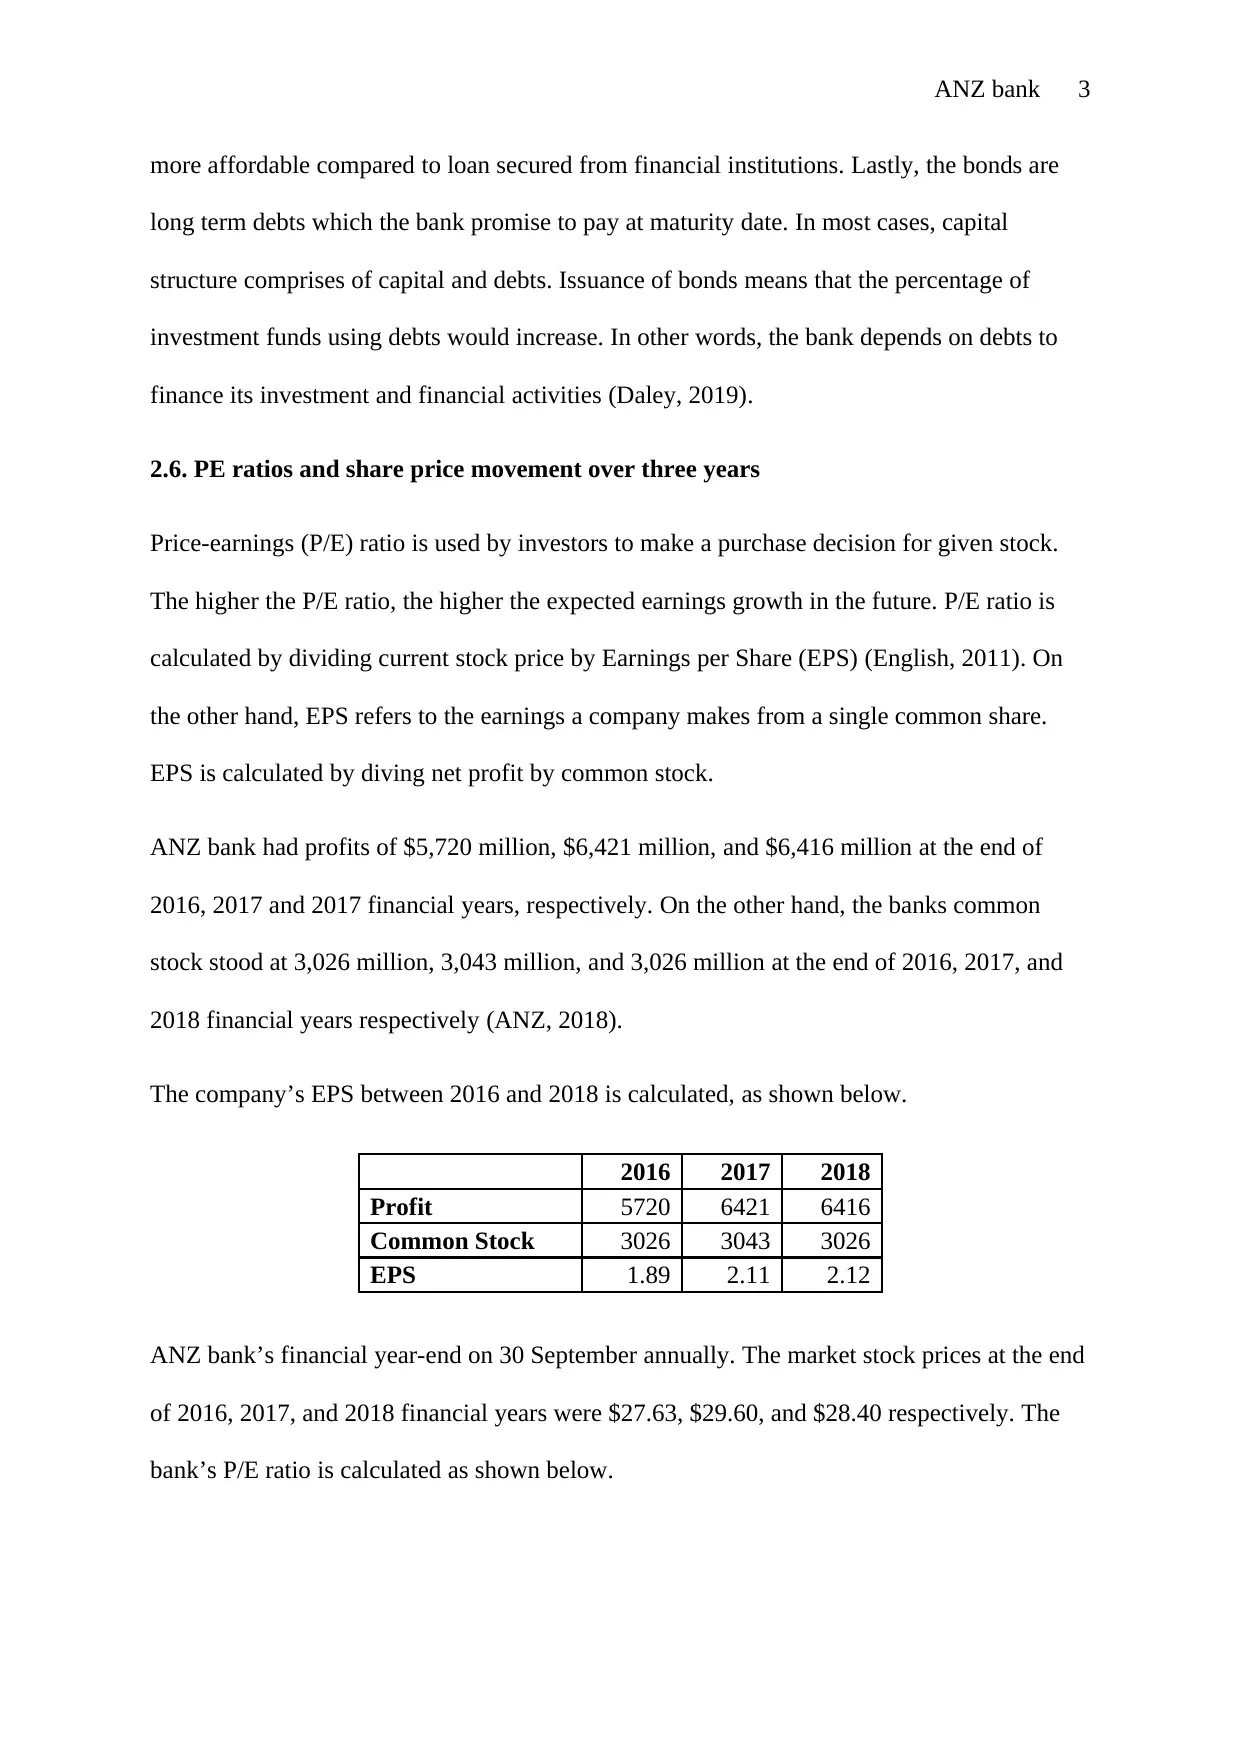
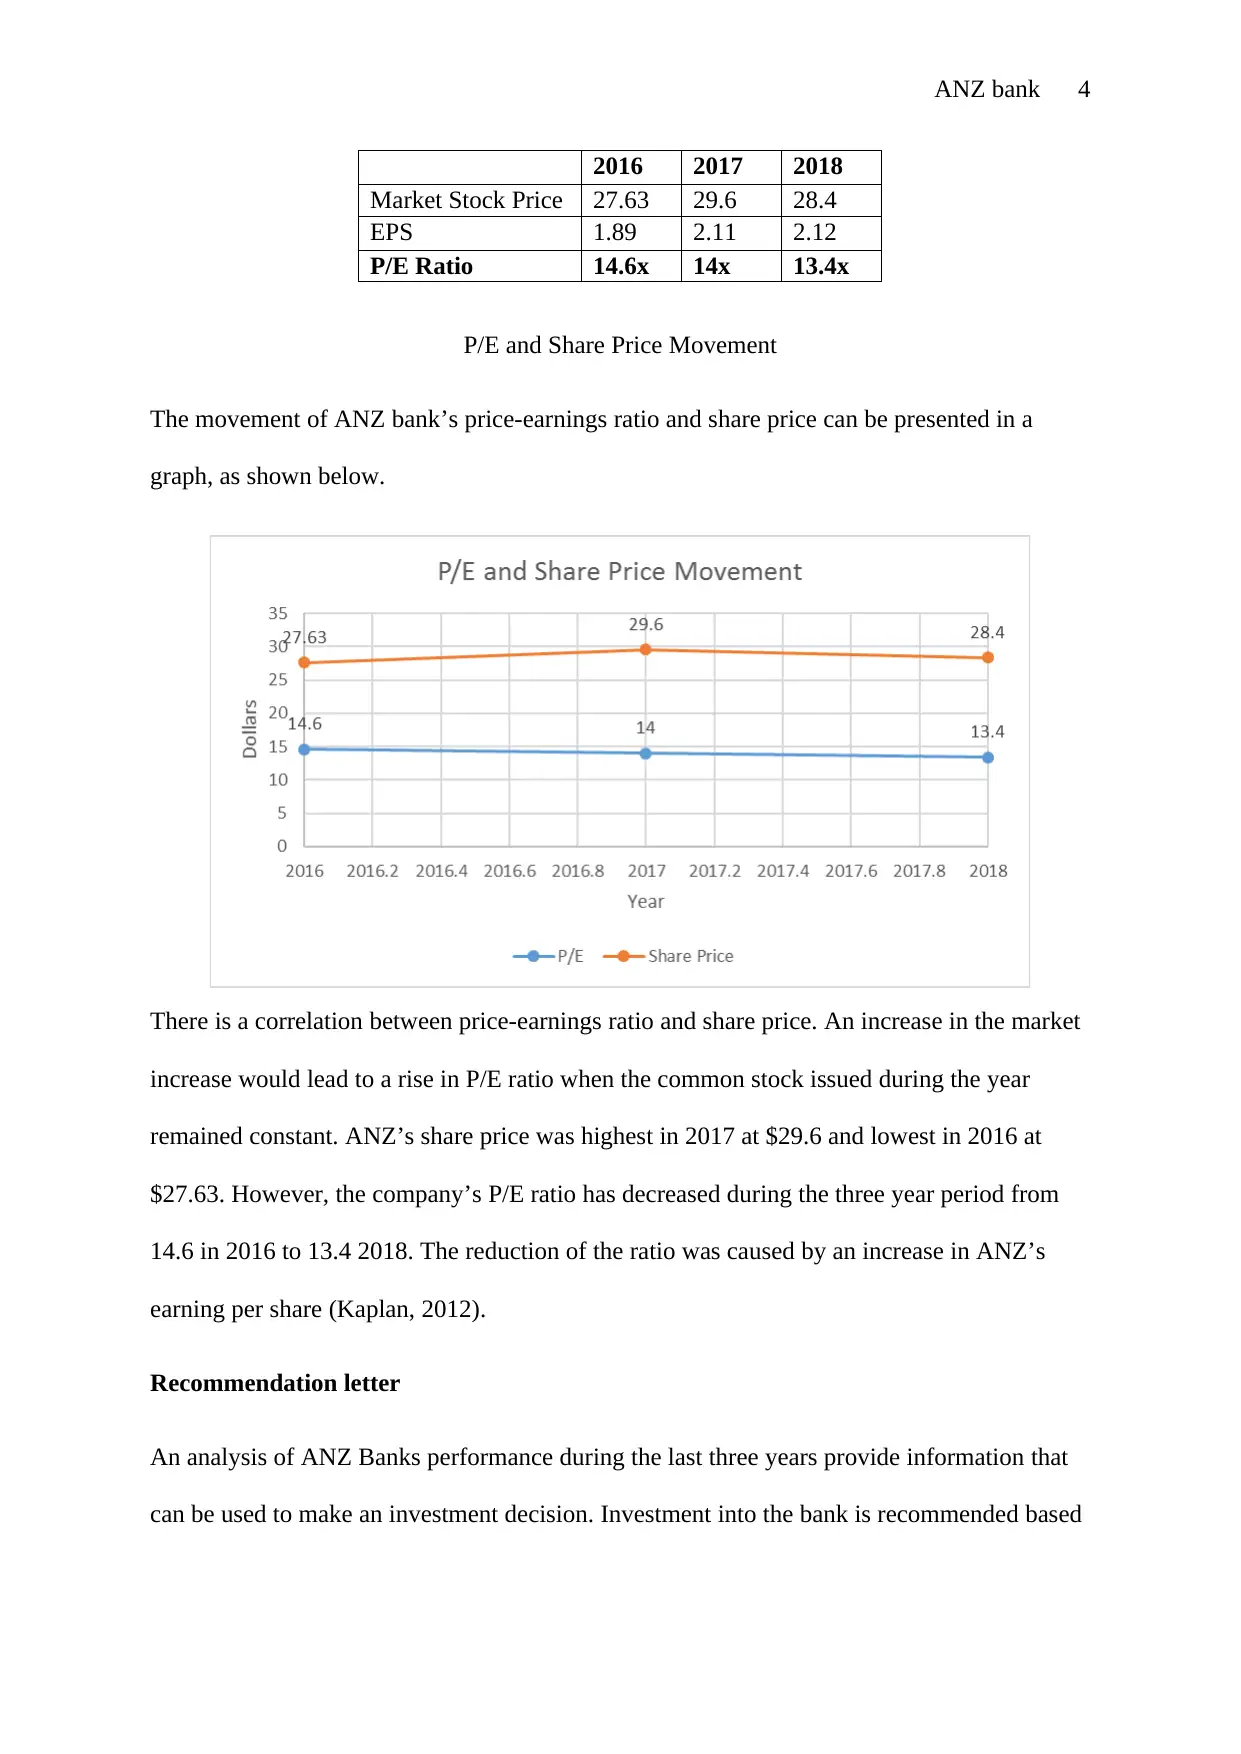
This report provides a financial analysis of ANZ Bank's performance between 2016 and 2018. It examines the bank's bond issuance strategies, including the issuance of bonds in 2015, 2018, and 2019, and discusses the reasons for issuing domestic bonds. The report analyzes the bank's price-earnings (P/E) ratios and share price movements, providing calculations of Earnings per Share (EPS) and P/E ratios for the years 2016, 2017, and 2018. The analysis reveals a correlation between the P/E ratio and share price. The report also includes a recommendation letter, suggesting investment in ANZ based on increased profitability, EPS, and share price fluctuations. The conclusion summarizes the key findings, highlighting the bank's preference for domestic bond issuance and its positive financial performance. The report references the ANZ annual reports and other financial publications to support its analysis and recommendations.

ANZ bank 1
ANZ bank Financial Analysis
by Student Name
Class & Course
Professor
University
City & State
Date
ANZ bank Financial Analysis
by Student Name
Class & Course
Professor
University
City & State
Date
Paraphrase This Document
Need a fresh take? Get an instant paraphrase of this document with our AI Paraphraser

ANZ bank 2
2.5. Latest share or bond issuance
ANZ bank issued three major bonds between April 2015 and May 2019. The funds raised
from bond issuance were meant to finance the bank’s retail investments as well as sustainable
development goals (SDGs). Issuance of bonds by ANZ bank was as a result of favourable
market conditions that supported domestic lending. Traditionally, the bank relied on its
deposits to funds its investment opportunity. However, the recent growth in the banking
industry has seen lending outpacing deposit growth. As a result, the bank turned to low-cost
domestic lenders for funding.
In April 2015 ANZ Banking Group issued a floating rate bond. The sale of the five-year bond
helped the bank to raise over $2.5 billion which was used to finance long term investment
projects (Thompson, 2016). Likewise, ANZ issued an SDG bond in February 2018. The bond
was issued in the European capital markets and raised over €750 million. The funds raised
from the bond was used to the bank’s expenditures and loans that promote SDGs projects.
The SDG bond was priced at 15 basis over five years. The €750 million raised was used by
the bank to finance its projects relating to economic, environmental and social benefits such
as clean water, renewable power, schools, hospitals and green buildings (ANZ, 2018).
The latest bond to be issued by the bank was on 20 March 2019. The fixed-rate $100 million
bond is spread over five years and is expected to mature on 20 March 2024. The bond was
issued to retail and institutional investors at a 1.05-1.10 % margin rate. The bond was offered
at an initial minimum application amount of $10,000 and a subsequent multiples amount of
$1,000. So far, bond has raised $500 because of its unlimited which allowed
oversubscriptions (Daley, 2019).
ANZ bank prefers issuance of domestic bonds because they are cheaper as compared to the
long term financial loans offered by financial institutions. Domestic bonds are 3.10 percent

ANZ bank 3
more affordable compared to loan secured from financial institutions. Lastly, the bonds are
long term debts which the bank promise to pay at maturity date. In most cases, capital
structure comprises of capital and debts. Issuance of bonds means that the percentage of
investment funds using debts would increase. In other words, the bank depends on debts to
finance its investment and financial activities (Daley, 2019).
2.6. PE ratios and share price movement over three years
Price-earnings (P/E) ratio is used by investors to make a purchase decision for given stock.
The higher the P/E ratio, the higher the expected earnings growth in the future. P/E ratio is
calculated by dividing current stock price by Earnings per Share (EPS) (English, 2011). On
the other hand, EPS refers to the earnings a company makes from a single common share.
EPS is calculated by diving net profit by common stock.
ANZ bank had profits of $5,720 million, $6,421 million, and $6,416 million at the end of
2016, 2017 and 2017 financial years, respectively. On the other hand, the banks common
stock stood at 3,026 million, 3,043 million, and 3,026 million at the end of 2016, 2017, and
2018 financial years respectively (ANZ, 2018).
The company’s EPS between 2016 and 2018 is calculated, as shown below.
2016 2017 2018
Profit 5720 6421 6416
Common Stock 3026 3043 3026
EPS 1.89 2.11 2.12
ANZ bank’s financial year-end on 30 September annually. The market stock prices at the end
of 2016, 2017, and 2018 financial years were $27.63, $29.60, and $28.40 respectively. The
bank’s P/E ratio is calculated as shown below.
⊘ This is a preview!⊘
Do you want full access?
Subscribe today to unlock all pages.

Trusted by 1+ million students worldwide

ANZ bank 4
2016 2017 2018
Market Stock Price 27.63 29.6 28.4
EPS 1.89 2.11 2.12
P/E Ratio 14.6x 14x 13.4x
P/E and Share Price Movement
The movement of ANZ bank’s price-earnings ratio and share price can be presented in a
graph, as shown below.
There is a correlation between price-earnings ratio and share price. An increase in the market
increase would lead to a rise in P/E ratio when the common stock issued during the year
remained constant. ANZ’s share price was highest in 2017 at $29.6 and lowest in 2016 at
$27.63. However, the company’s P/E ratio has decreased during the three year period from
14.6 in 2016 to 13.4 2018. The reduction of the ratio was caused by an increase in ANZ’s
earning per share (Kaplan, 2012).
Recommendation letter
An analysis of ANZ Banks performance during the last three years provide information that
can be used to make an investment decision. Investment into the bank is recommended based
Paraphrase This Document
Need a fresh take? Get an instant paraphrase of this document with our AI Paraphraser

ANZ bank 5
on financial performance between 2016 and 2018. Investment in the company is
recommended based on four reasons.
a) The bank’s profitability has increased over three years. ANZ had a net profit of $5720
million, $ 6421 million and $ 6416 million in 2016, 2017, and 2018 respectively. The
trend projects a future increase in ANZ’s net profit from investment and operation
activities.
b) ANZ’s earning per share increased over three years. ANZ had EPS of $1.89, $2.11,
and $ 2.12 in 2016, 2017, and 2018 respectively. In other words, the amount of
dividend paid to investors per share increased during the period. The trend shows that
EPS is projected further in future (ANZ, 2017), (ANZ, 2018).
c) ANZ’s share price fluctuated during the period. The fluctuation was caused by the
introduction of tighter regulations by the Australian Royal Commission. ANZ’s share
price is expected to increase in the future. Investors are encouraged to invest in shares
when the price is lower but expected to increase in future. Investing in ANZ shares at
the moment increases the opportunity for higher earnings in the future (ANZ, 2018).
d) The company’s price-earnings ratios have remained higher which encourage
investment. The strengthening Australian economy and increasing household income
are expected to improve the bank’s earnings. ANZ bank has continued to perform
better in the industry, amid strict regulations by Royal commission.
Conclusion
ANZ bank is among the leading banks in Australia. The banks provide business, institutional
and retail financial services to over eight million customers. ANZ has remained stable in the
competitive Australian market. The financial analysis of the performance of the company in
the last three financial years revealed the following. First, ANZ prefers issuance of domestic

ANZ bank 6
bonds over long term loans to financial its retail and institutional investment activities. The
company prefers issuing bonds because they are less costly compared to long term loans. The
company has issued three bonds to domestic lenders between 2015 and 2019. Second, ANZ
registered positive profitability performance between 2016 and 2018 financial years. The
company’s net profit changed at an increasing trend over the period. Earnings per share also
increased from $1.89 in 2016 to $2.12 in 2018. Investment into the bank is recommended
based on positive financial performance between 2016 and 2018. The strengthening of the
Australian economy as well as improving household earnings also support positive financial
performance of the company.
⊘ This is a preview!⊘
Do you want full access?
Subscribe today to unlock all pages.

Trusted by 1+ million students worldwide

ANZ bank 7
References List
ANZ, 2017. 2017 ANNUAL REPORT, Sydney: Australia-New Zealand Bank.
ANZ, 2018. 2018 ANNUAL REPORT, Sydney: Australia-New Zealand.
ANZ, 2018. ANZ Prices first €750m SDG Bond. [Online]
Available at: https://institutional.anz.com/insight-and-research/ANZ-Prices-First-750m-SDG-
Bond
[Accessed 26 September 2019].
Daley, P., 2019. ANZ launches Bond offer, Sydney: NZDX.
English, P., 2011. Capital Budgeting Valuation: Financial Analysis for Today's Investment
Projects. 1 ed. New York: John Wiley & Sons.
Kaplan, D., 2012. Introduction To Financial Statement Analysis. New Delhi: The Kaplan
Group.
Thompson, S., 2016. ANZ in $2.5 billion bond issue. [Online]
Available at: https://www.afr.com/street-talk/anz-in-2-5-billion-bond-issue-20150409-
1mhn7r
[Accessed, 2019].
1 out of 7
Related Documents

Your All-in-One AI-Powered Toolkit for Academic Success.
+13062052269
info@desklib.com
Available 24*7 on WhatsApp / Email
Unlock your academic potential
Copyright © 2020–2025 A2Z Services. All Rights Reserved. Developed and managed by ZUCOL.