Arab Open University M248 Analyzing Data TMA Solution - Fall 2018-2019

Verified

Added on  2023/05/31

|4
|903
|404
Homework Assignment
AI Summary
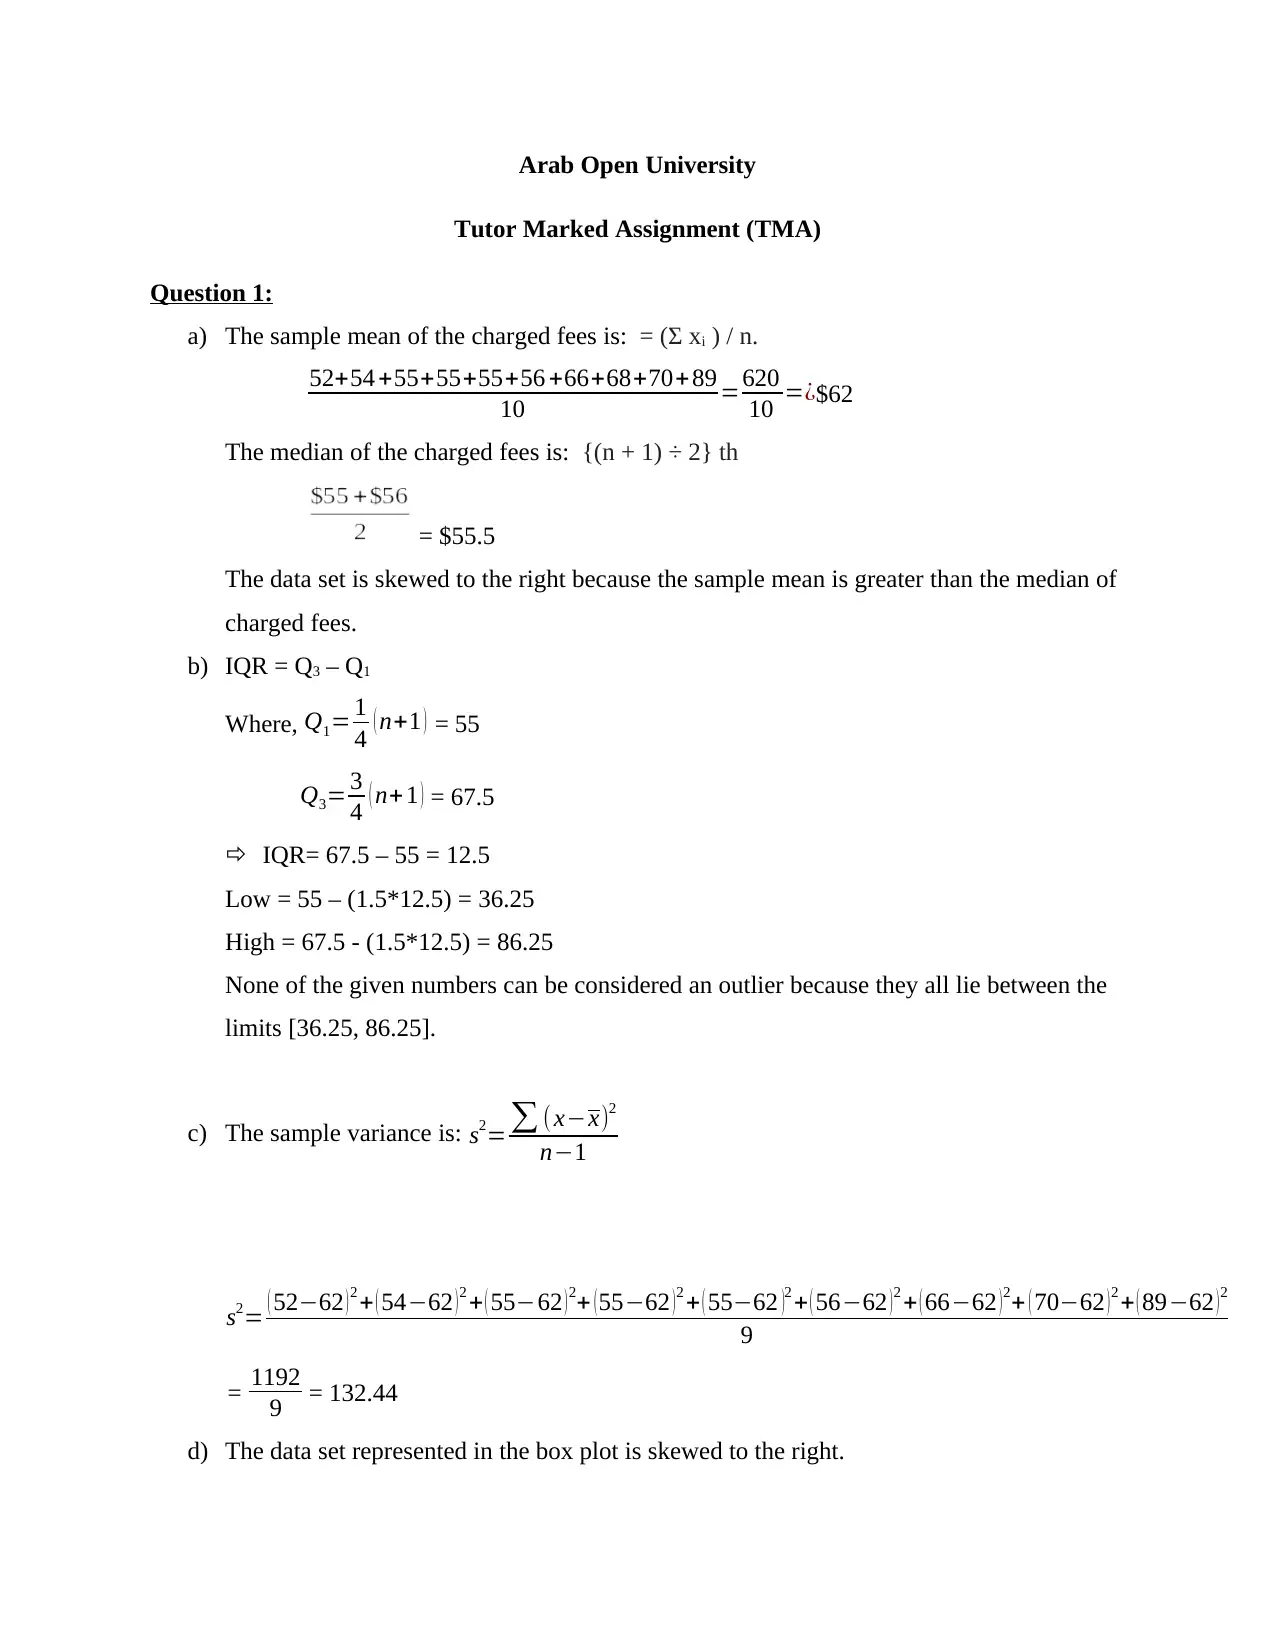
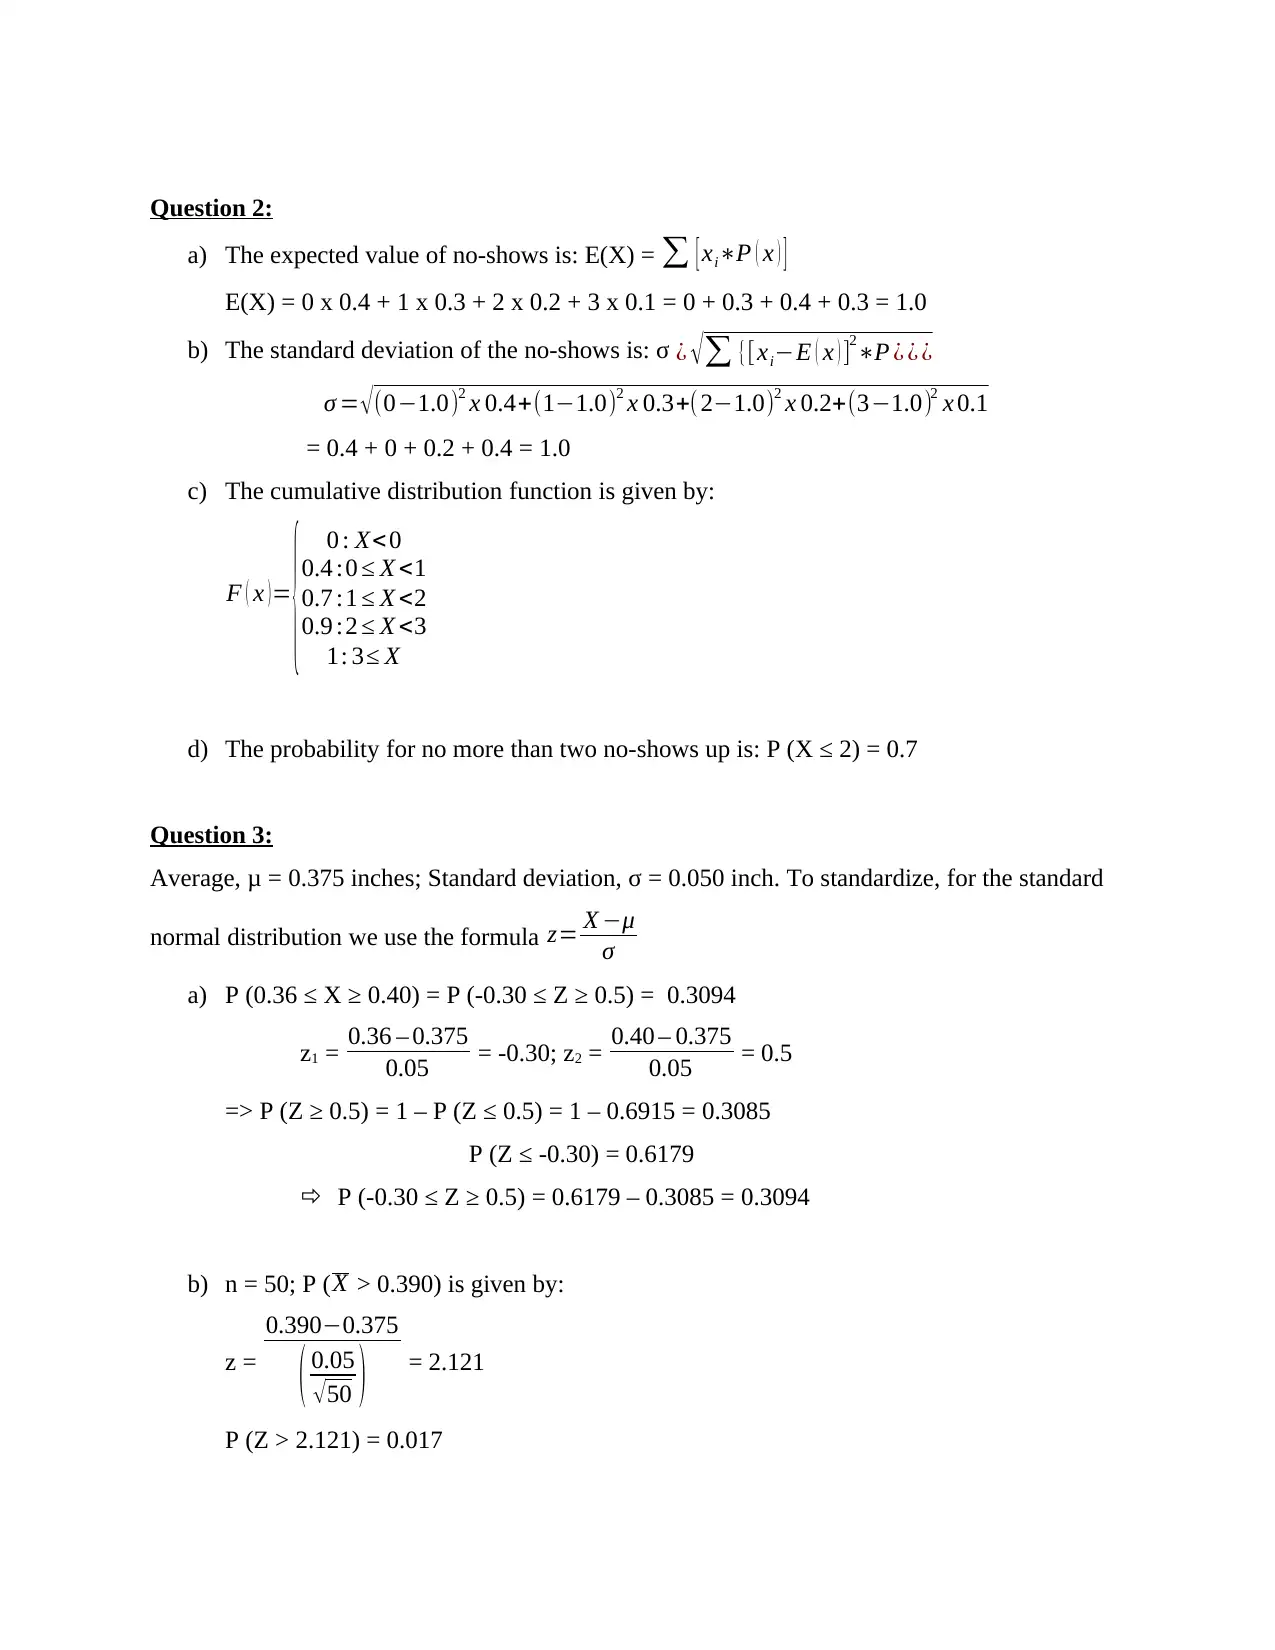
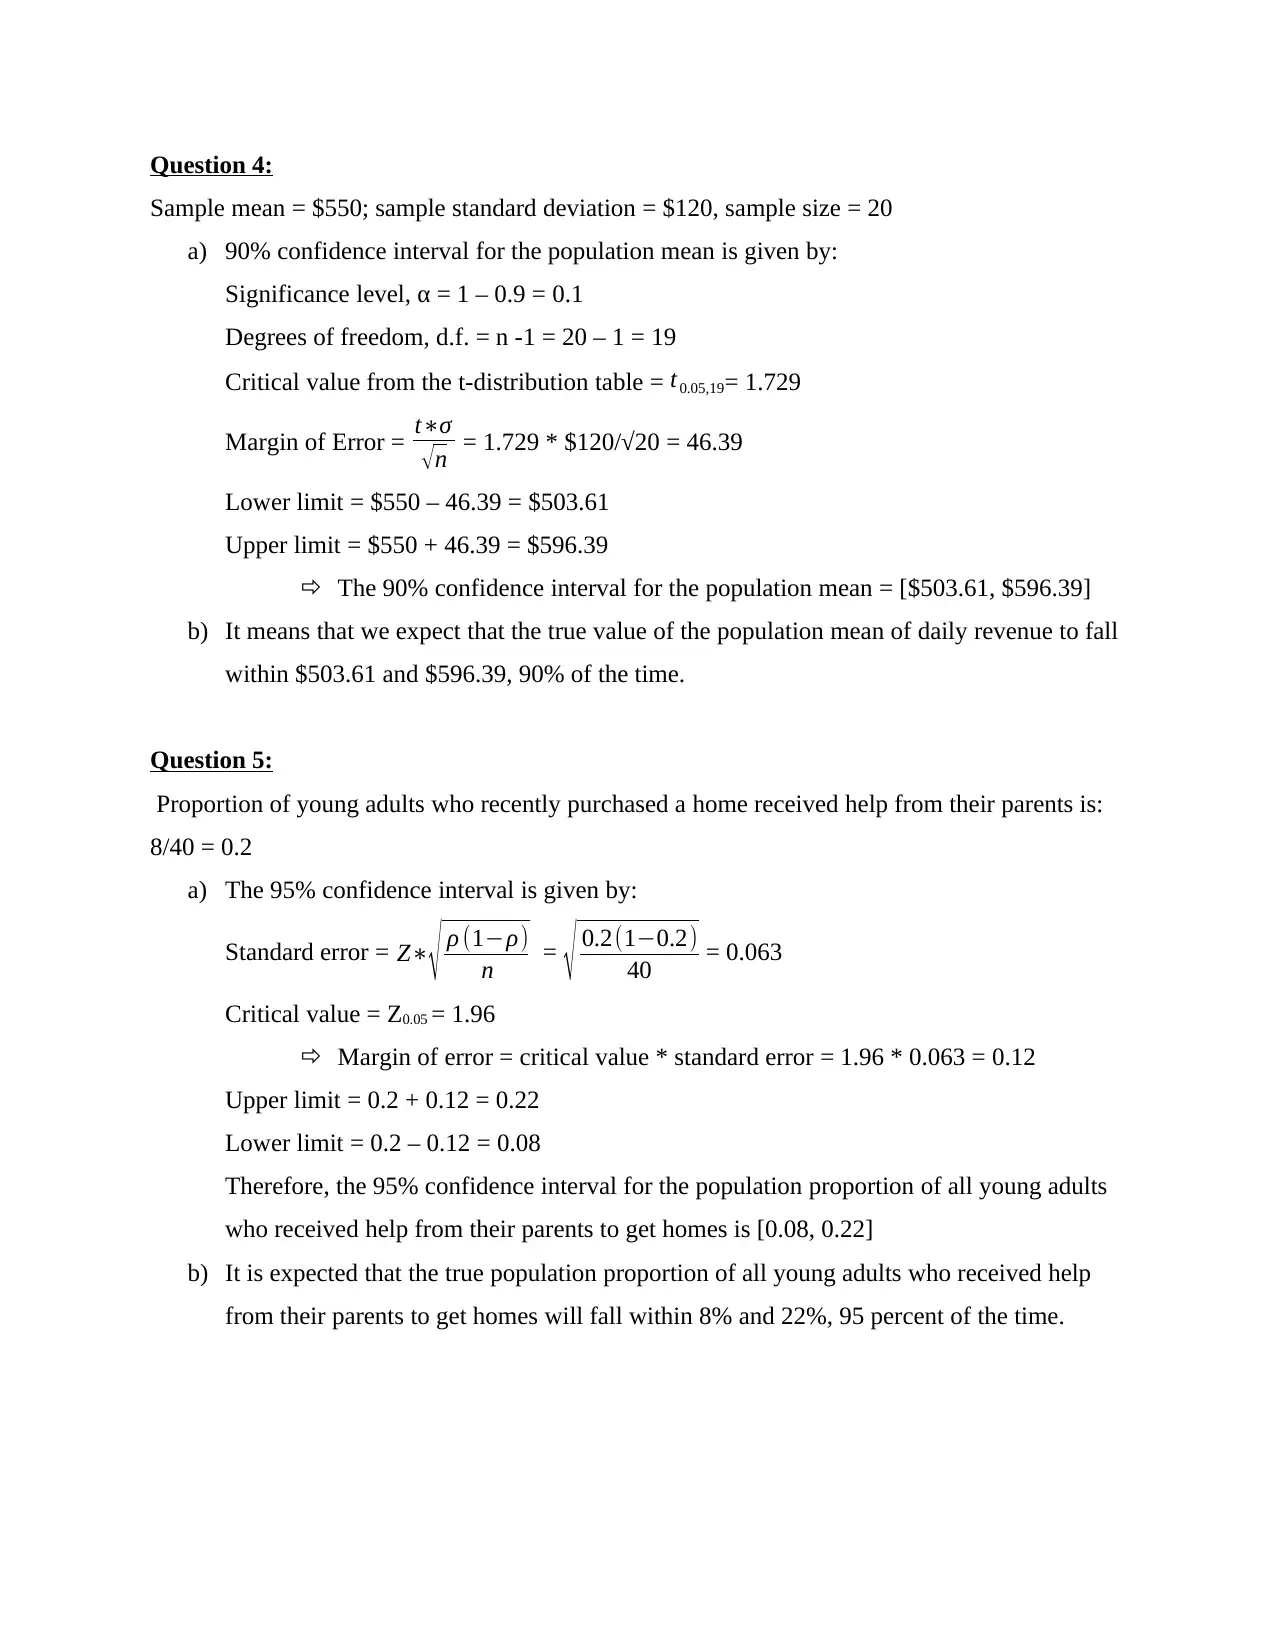
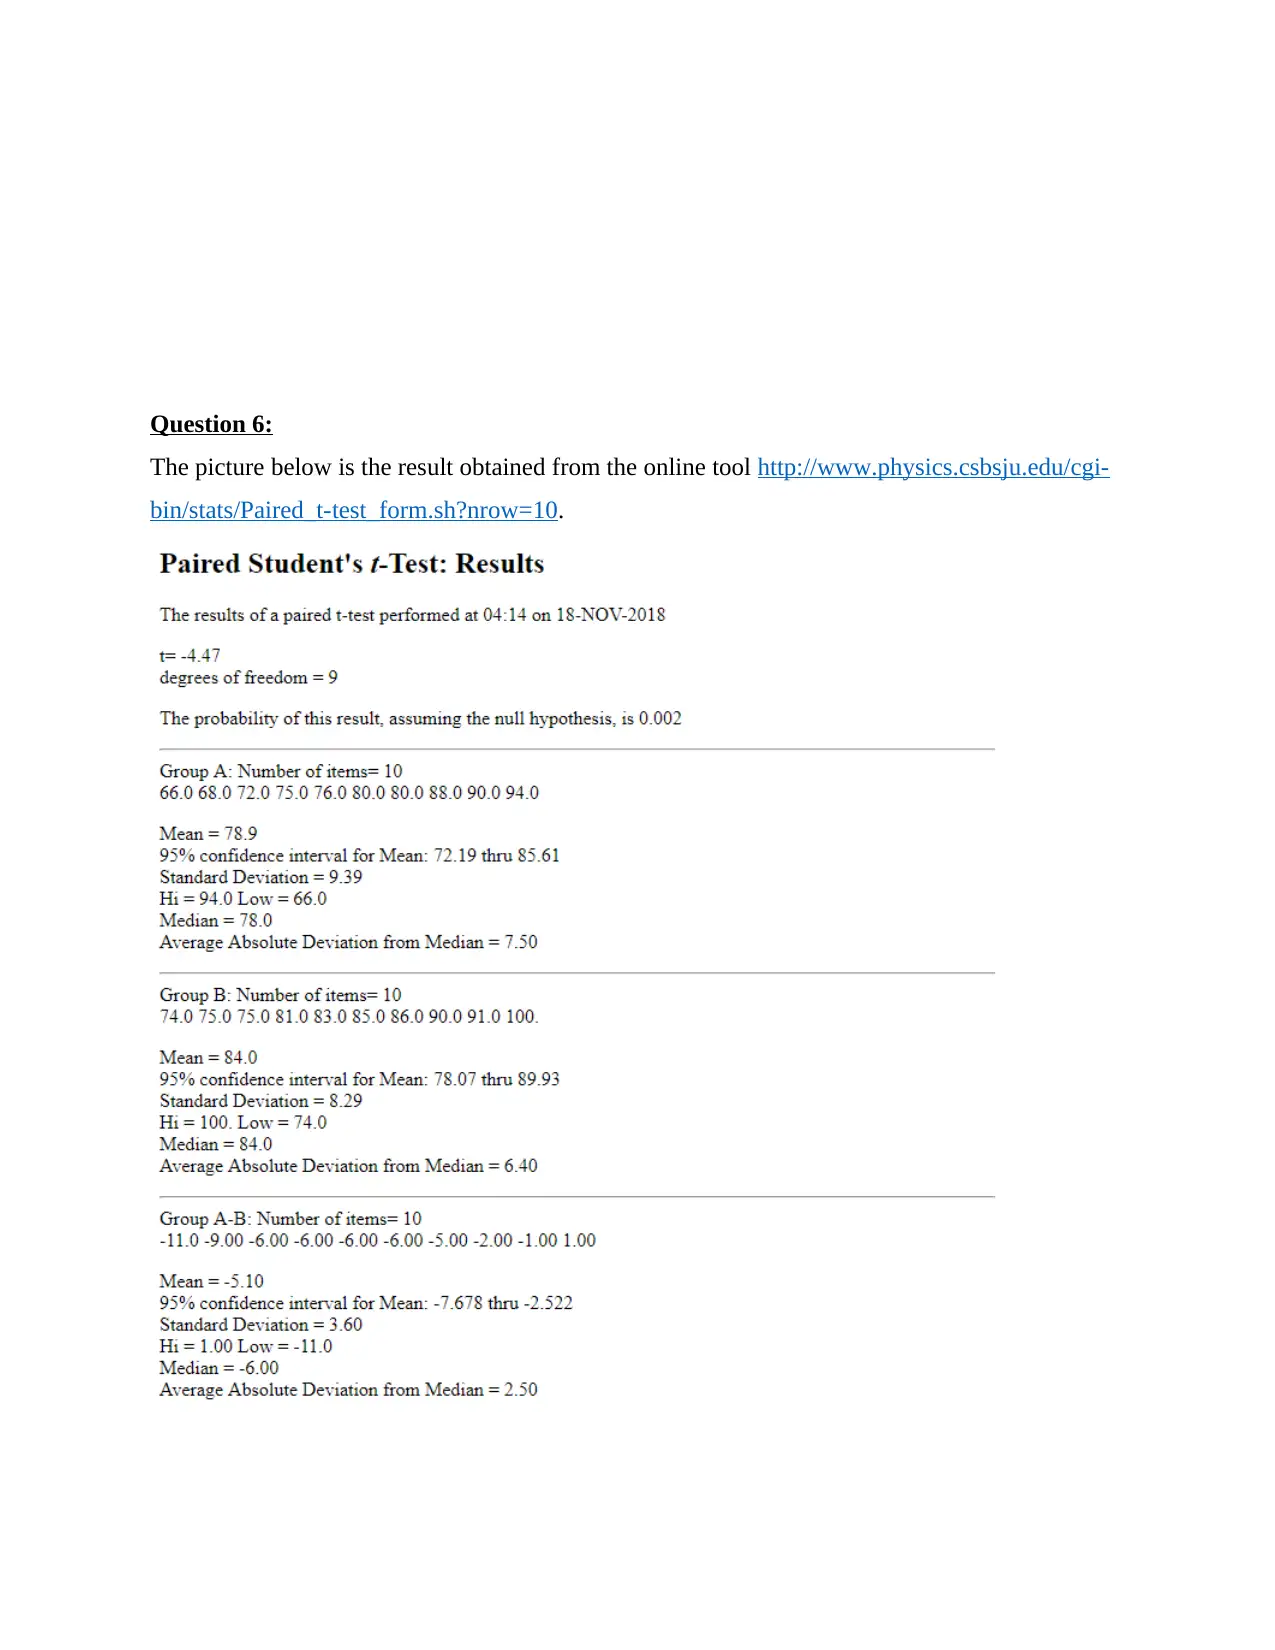
This document presents a complete solution to the M248 Analyzing Data Tutor Marked Assignment (TMA) from the Arab Open University, Fall 2018-2019 semester. The assignment covers a range of statistical concepts including calculating sample means and medians, identifying skewness, determining interquartile ranges (IQR) and outliers. It also includes calculating variance, expected values, standard deviations, and cumulative distribution functions. Further, the solution addresses probability calculations using the standard normal distribution, confidence interval estimation for population means and proportions, and interpreting these intervals. Finally, the solution includes the interpretation of results from a paired t-test, as obtained from an online tool.
Document Page
Arab Open University
Tutor Marked Assignment (TMA)
Question 1:
a) The sample mean of the charged fees is: = (Σ xi ) / n.
52+54 +55+55+55+56 +66+68+70+89
10 =620
10 =¿$62
The median of the charged fees is: {(n + 1) ÷ 2} th
= $55.5
The data set is skewed to the right because the sample mean is greater than the median of
charged fees.
b) IQR = Q3 – Q1
Where, Q1= 1
4 ( n+1 ) = 55
Q3= 3
4 ( n+ 1 ) = 67.5
IQR= 67.5 – 55 = 12.5
Low = 55 – (1.5*12.5) = 36.25
High = 67.5 - (1.5*12.5) = 86.25
None of the given numbers can be considered an outlier because they all lie between the
limits [36.25, 86.25].
c) The sample variance is: s2= (xx)2
n1
s2= ( 5262 )2 + ( 5462 )2 + ( 5562 )2+ (5562 )2 + ( 5562 )2 + ( 5662 )2 + ( 6662 )2+ ( 7062 )2 + ( 8962 )2
9
= 1192
9 = 132.44
d) The data set represented in the box plot is skewed to the right.
tabler-icon-diamond-filled.svg

Paraphrase This Document

Need a fresh take? Get an instant paraphrase of this document with our AI Paraphraser
Document Page
Question 2:
a) The expected value of no-shows is: E(X) = [ xiP ( x ) ]
E(X) = 0 x 0.4 + 1 x 0.3 + 2 x 0.2 + 3 x 0.1 = 0 + 0.3 + 0.4 + 0.3 = 1.0
b) The standard deviation of the no-shows is: σ ¿ {[xiE ( x ) ]2P ¿ ¿ ¿
σ = (01.0)2 x 0.4+(11.0)2 x 0.3+( 21.0)2 x 0.2+(31.0)2 x 0.1
= 0.4 + 0 + 0.2 + 0.4 = 1.0
c) The cumulative distribution function is given by:
F ( x ) =
{ 0 : X<0
0.4 :0 X <1
0.7 :1 X <2
0.9 :2 X <3
1: 3 X
d) The probability for no more than two no-shows up is: P (X ≤ 2) = 0.7
Question 3:
Average, μ = 0.375 inches; Standard deviation, σ = 0.050 inch. To standardize, for the standard
normal distribution we use the formula z= X μ
σ
a) P (0.36 ≤ X ≥ 0.40) = P (-0.30 ≤ Z ≥ 0.5) = 0.3094
z1 = 0.36 0.375
0.05 = -0.30; z2 = 0.40 0.375
0.05 = 0.5
=> P (Z ≥ 0.5) = 1 – P (Z ≤ 0.5) = 1 – 0.6915 = 0.3085
P (Z ≤ -0.30) = 0.6179
P (-0.30 ≤ Z ≥ 0.5) = 0.6179 – 0.3085 = 0.3094
b) n = 50; P ( X > 0.390) is given by:
z =
0.3900.375
( 0.05
50 ) = 2.121
P (Z > 2.121) = 0.017
Document Page
Question 4:
Sample mean = $550; sample standard deviation = $120, sample size = 20
a) 90% confidence interval for the population mean is given by:
Significance level, α = 1 – 0.9 = 0.1
Degrees of freedom, d.f. = n -1 = 20 – 1 = 19
Critical value from the t-distribution table = t0.05,19= 1.729
Margin of Error = tσ
n = 1.729 * $120/√20 = 46.39
Lower limit = $550 – 46.39 = $503.61
Upper limit = $550 + 46.39 = $596.39
The 90% confidence interval for the population mean = [$503.61, $596.39]
b) It means that we expect that the true value of the population mean of daily revenue to fall
within $503.61 and $596.39, 90% of the time.
Question 5:
Proportion of young adults who recently purchased a home received help from their parents is:
8/40 = 0.2
a) The 95% confidence interval is given by:
Standard error = Z
ρ (1ρ)
n = 0.2(10.2)
40 = 0.063
Critical value = Z0.05 = 1.96
Margin of error = critical value * standard error = 1.96 * 0.063 = 0.12
Upper limit = 0.2 + 0.12 = 0.22
Lower limit = 0.2 – 0.12 = 0.08
Therefore, the 95% confidence interval for the population proportion of all young adults
who received help from their parents to get homes is [0.08, 0.22]
b) It is expected that the true population proportion of all young adults who received help
from their parents to get homes will fall within 8% and 22%, 95 percent of the time.
Document Page
Question 6:
The picture below is the result obtained from the online tool http://www.physics.csbsju.edu/cgi-
bin/stats/Paired_t-test_form.sh?nrow=10.
chevron_up_icon
1 out of 4
circle_padding
hide_on_mobile
zoom_out_icon
[object Object]