ACC10707 Session 3, 2018: Financial Ratio Analysis of Two Firms
VerifiedAdded on 2023/05/28
|5
|2023
|458
Report
AI Summary
This report provides a detailed financial ratio analysis of A.P. Eagers Limited and its competitor, Automotive Holding Group Limited, both listed on the Australian Stock Exchange. The analysis covers key ratios including net profit margin, asset turnover ratio, current ratio, quick ratio, debt ratio, and cash conversion cycle, comparing the performance of both companies. The report concludes that both companies exhibit strengths and weaknesses in different areas, with a general concern for low net profit margins. The document emphasizes the importance of considering additional factors before making investment decisions. Desklib offers a range of study tools and solved assignments for students.
Introduction
The report seeks to analyse the financial ratios of A.P. Eagers Limited, an entity listed on Australian
Stock Exchange along with its competitor Automotive Holding Group Limited which is too listed on
Australian Stock Exchange. The entities are trading at AUD 5.92 and AUD 1.44 respectively on 19-12-
2018. The basic description of the business of entities are presented here-in-below:
A.P. Eagers Limited
A.P. Eagers Limited is an automotive retail company limited. The principal business of the company
consists of selling of old and new motor vehicles, distribution and sale of parts, accessories and
products on care of care, servicing and repair of vehicles, protection products of vehicles and other
products post sales. The company has investment in Automotive Holding Group Limited. The truck
retail segment of the company offers old and new trucks, maintenance of trucks, service in relation
to repair of vehicular parts. The company also deals in Property segment and is engaged in
acquisition and usage of property for official purpose.
Automotive Holding Group Limited
A.P. Eagers Limited is an automotive retail company limited with its operation base in Australasia.
The principal business segment of the entity consists of automotive retail, refrigerated logistics and
other logistics. The company has over one hundred and ninety franchisees with more than 110
dealership locations and has its business operations in Australia and New Zealand. The refrigerated
segment of the company deals in cold storage and transport operations. Further, other logistics
segment of the company deals with company’s automotive part distribution and warehousing
business, distribution of motorcycles, distribution of track and bus, storage of vehicle and
engineering.
Analysis of Financial Ratios of the Company
The following financial ratios of the company have been analysed for the purpose of comparison of
A.P Eagers Limited with that of its peer Automotive Holding Group Limited has been detailed here-n-
below:
(a) Net Profit Margin;
(b) Asset Turnover Ratio;
(c) Current Ratio;
(d) Quick Ratio;
(e) Debt Ratio;
(f) Cash Conversion Cycle.
Net Profit Margin
Net Profit Margin is computed for the purpose of analysing the profitability of the company. It
symbolise the dollar of revenue left after meting out all the expenditure of business and paying out
taxes. The higher the net profit margin, the better the company is performing. Further, higher
margin also symbolise that company is able to control its cost and able to generate sufficient
revenue for future investments. (Hamel, 2018)
The formula for Net Profit Margin= (Net Profit Margin/ Sales)*100
Paraphrase This Document
Need a fresh take? Get an instant paraphrase of this document with our AI Paraphraser
Asset Turnover Ratio
This ratio is very significant financial tool that helps an analyst to understand revenue generate per
dollar of investment in Asset. The higher the ratio, the better the company is taken care of. The ratio
also helps company to understand how well the company is able to utilise the asset and generate
revenue from those asset. The formula for computation of the ratio has been detailed here-in-
below:
Asset Turnover Ratio= (Net Sales/ Average Asset)
Further, since the ratio involves profit and loss account and an item of balance sheet average of two
years shall be considered for the purpose of analysis. Further, there are various variant to asset
turnover ratio like fixed asset turnover ratio, intangible asset turnover ratio and current asset
turnover ratio.
The ratio is important and is generally looked by investor for understanding the affairs of the
company. Further, the same symbolise level of production, quality of inventory management,
collection practice of the company etc. Thus, a strong asset turnover ratio is very significant and
speak about asset policies of the company. (efinancemangement.com, 2018)
Current Ratio
Current Ratio of the company symbolise the working capital position of the company. It is a measure
of liquidity and efficiency which helps to measure the ability of the company to pay of the short term
liabilities with the use of current asset. The ratio is significant as it measure the short term solvency
of the company and capability of the company to pay off the liabilities which is due in short term
generally one year. Further, the time available with the company to raise funds form the market to
pay off the aforesaid liabilities is generally limited.
The ratio helps investor and creditor to understand the company’s liquidity and how efficiently shall
company be able to payoff its current liability.
The asset under current asset generally encompass cash and cash equivalent, account receivables,
inventory and other current asset of short term nature while current liabilities generally encompass
account payable, short term debt, deferred tax liability of short term nature etc.
(Accountingcourses.com, 2018)
The formula for computation of current ratio has been presented here-in-below:
Current Ratio= Current Asset/ Current Liabilities
The ideal Current ratio for the company is 2:1.
Quick Ratio
Quick Ratio or Acid Test Ratio of the company symbolise ability of the company to manage its cash
flow. The ratio measures the availability of liquid/ quick assets with the company to pay off the
current liabilities of the company. It measures the liquidity and efficiency of the company to pay off
the immediate short term liabilities.
The ratio encompass quick asset and current liabilities. The quick asset consists of Account
Receivable, cash and cash equivalent and other quick asset while current liabilities generally
encompass account payable, short term debt, deferred tax liability of short term nature etc.
The formula for computation of current ratio has been presented here-in-below:
Quick Ratio= Quick Asset/ Current Liabilities
The ideal Current ratio for the company is 2:1.
The Quick asset are generally those asset that can be converted into cash within a period of 90 days.
The ratio helps the analyst and investor to determine ability of the company to convert its asset to
cash in order to dispose off the liability. (ce DAta Services, 2018)
Debt Ratio
The ratio measures the total portion of asset which are funded by debt encompassing the long-term
and short-term debt. It measures the leveraged position of the company. The higher the portion of
debt in the total asset of the company, the risker the investment in such company shall be. Increase
reliance on debt generally results in higher interest burden of the company which impacts the
profitability and cash flows of the company. It is similar to debt to equity ratio which shows the
comparison between debt and equity position of the company (Audit It, 2018)
The formula for debt ratio has been presented here-in-below:
Debt Ratio = Total debt including both short term and long term/ Total Asset of the company
including both current and non-current.
Cash Conversion Cycle
This is one of the significant analysis of working capital management of the company. The ratio
analyse the ability of the company to how quickly complete one cycle of trade encompassing
inventory, receivable and payables i.e how quickly business converts its inventory into cash. The
ratio is a measure of liquidity of the company and encompass three ratios which are :
(a) Asset Turnover Ratio in days: The formula for computation of Asset Turnover Ratio has been
presented here-in-below:
Asset Turnover Ratio in days: [365/( Net Sales/ (Average Asset)]
(b) Account Receivable Turnover Ratio in days: The formula for computation of Accounts
Receivable Turnover Ratio has been presented here-in-below:
Accounts Receivable Turnover Ratio in days: [365/(Net Sales/ (Average Receivables)]
(c) Account Payable Turnover Ratio in days: The formula for computation of Accounts Payable
Turnover Ratio has been presented here-in-below:
Accounts Payable Turnover Ratio in days: [365/(Net Sales/ (Average Payables)]
Further, the formula for cash conversion cycle has been presented here-in-below:
Cash Conversion Cycle= Account Receivable Turnover Ratio in days+ Inventory Turnover Ratio in
days- Accounts Payable Turnover Ratio in days. (Prestar Capital,LLC, 2016)
⊘ This is a preview!⊘
Do you want full access?
Subscribe today to unlock all pages.
Trusted by 1+ million students worldwide
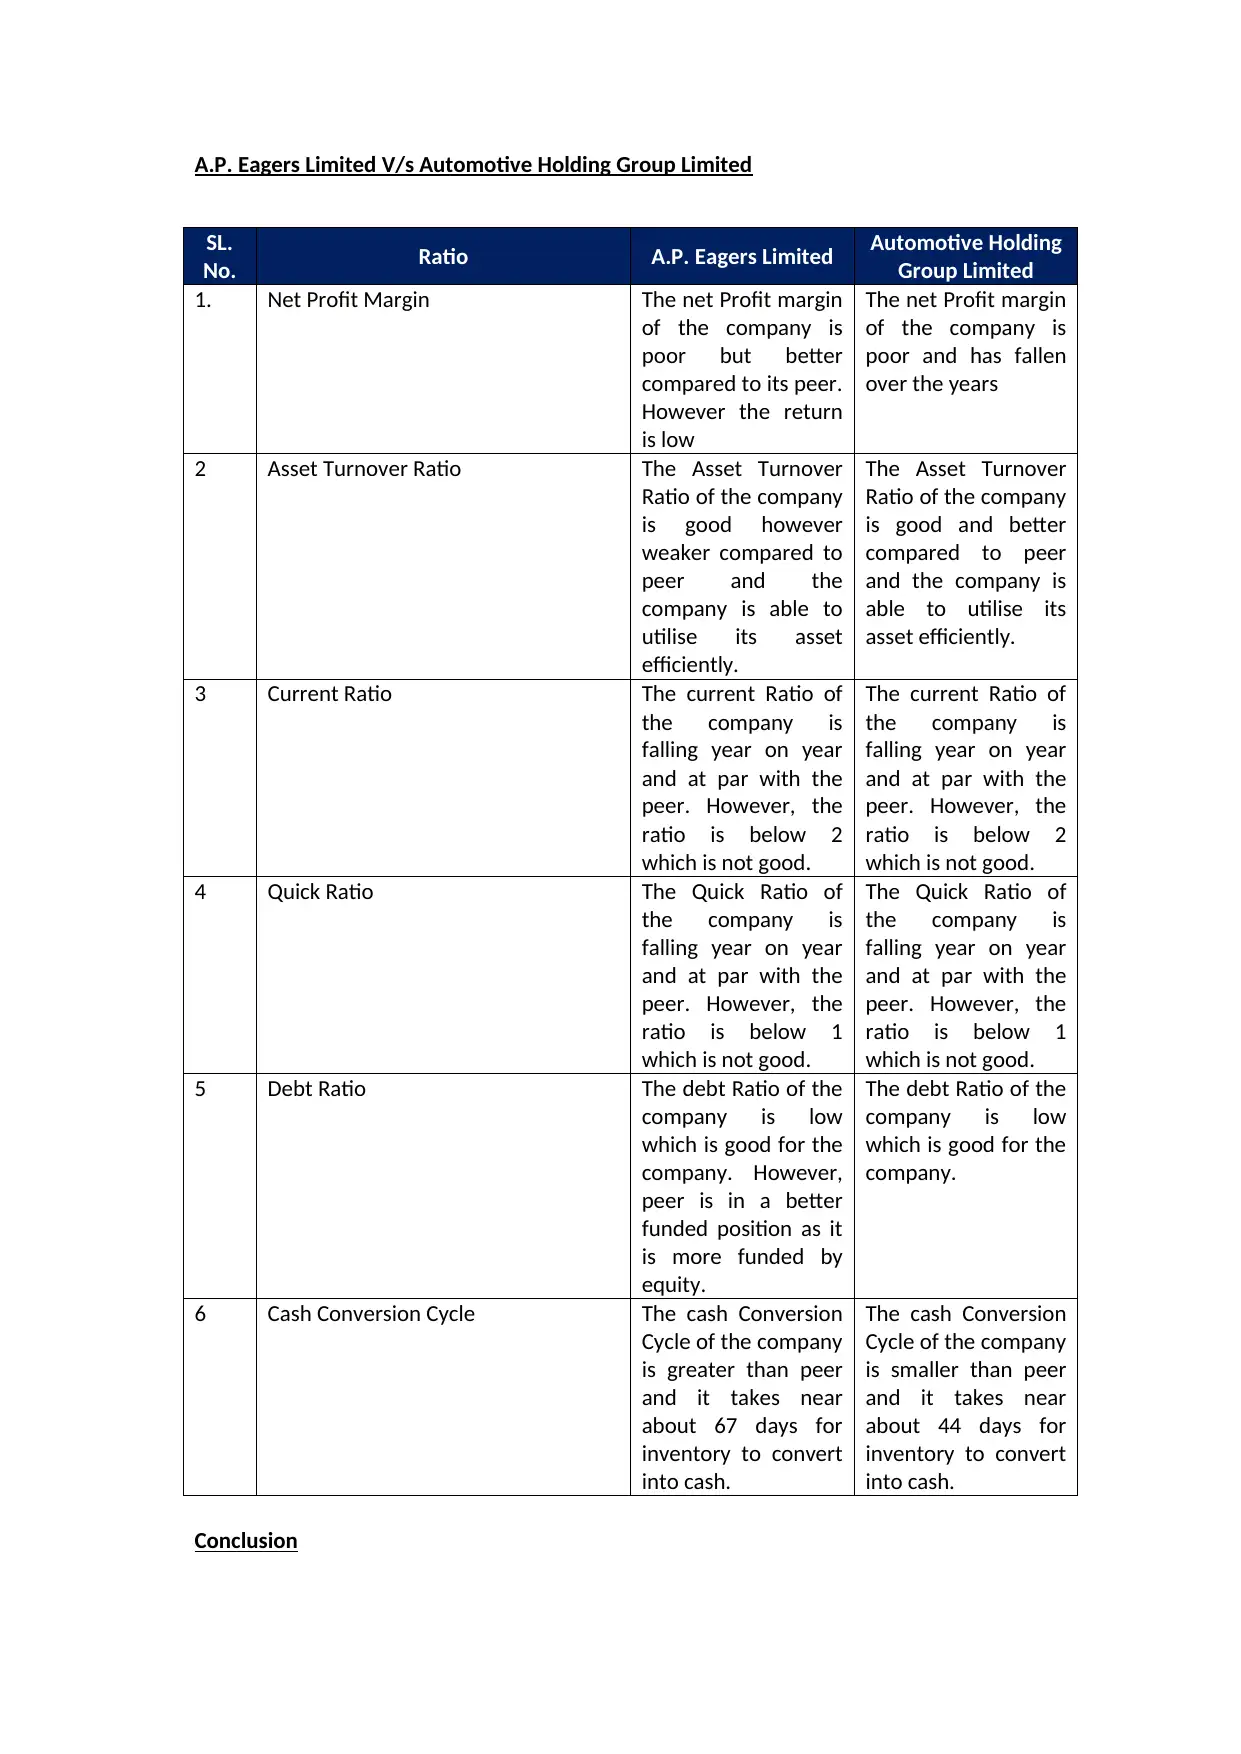
A.P. Eagers Limited V/s Automotive Holding Group Limited
SL.
No. Ratio A.P. Eagers Limited Automotive Holding
Group Limited
1. Net Profit Margin The net Profit margin
of the company is
poor but better
compared to its peer.
However the return
is low
The net Profit margin
of the company is
poor and has fallen
over the years
2 Asset Turnover Ratio The Asset Turnover
Ratio of the company
is good however
weaker compared to
peer and the
company is able to
utilise its asset
efficiently.
The Asset Turnover
Ratio of the company
is good and better
compared to peer
and the company is
able to utilise its
asset efficiently.
3 Current Ratio The current Ratio of
the company is
falling year on year
and at par with the
peer. However, the
ratio is below 2
which is not good.
The current Ratio of
the company is
falling year on year
and at par with the
peer. However, the
ratio is below 2
which is not good.
4 Quick Ratio The Quick Ratio of
the company is
falling year on year
and at par with the
peer. However, the
ratio is below 1
which is not good.
The Quick Ratio of
the company is
falling year on year
and at par with the
peer. However, the
ratio is below 1
which is not good.
5 Debt Ratio The debt Ratio of the
company is low
which is good for the
company. However,
peer is in a better
funded position as it
is more funded by
equity.
The debt Ratio of the
company is low
which is good for the
company.
6 Cash Conversion Cycle The cash Conversion
Cycle of the company
is greater than peer
and it takes near
about 67 days for
inventory to convert
into cash.
The cash Conversion
Cycle of the company
is smaller than peer
and it takes near
about 44 days for
inventory to convert
into cash.
Conclusion
Paraphrase This Document
Need a fresh take? Get an instant paraphrase of this document with our AI Paraphraser
On the basis of above it can be understood that both companies have certain better ratio and
certain week ratio. However, when compared overall the company net profit margin is very low
and effort shall be put by the company to increase the same in the near future. Further, one
shall also consider other factors before making investment in the company.
References:
Accountingcourses.com, 2018. Current Ratio. [Online]
Available at: https://www.myaccountingcourse.com/financial-ratios/current-ratio
[Accessed 23 December 2018].
Audit It, 2018. Ready Ratios. [Online]
Available at: https://www.readyratios.com/reference/debt/debt_ratio.html
[Accessed 23 December 2018].
ce DAta Services, 2018. What Is an Acid-Test Ratio?. [Online]
Available at: https://www.fool.com/knowledge-center/what-is-an-acid-test-ratio.aspx
[Accessed 23 December 2018].
efinancemangement.com, 2018. How to Analyze and Improve Asset Turnover Ratio?. [Online]
Available at: https://efinancemanagement.com/financial-analysis/how-to-analyze-and-improve-
asset-turnover-ratio
[Accessed 23 December 2018].
Hamel, G., 2018. What Does Net Profit Margin Ratio Measure?. [Online]
Available at: https://smallbusiness.chron.com/net-profit-margin-ratio-measure-24448.html
[Accessed 23 December 2018].
Prestar Capital,LLC, 2016. Importance of Good Cash Conversion Cycle. [Online]
Available at: https://www.goprestar.com/importance-good-cash-conversion-cycle/
[Accessed 23 December 2018].
1 out of 5
Related Documents


Your All-in-One AI-Powered Toolkit for Academic Success.
+13062052269
info@desklib.com
Available 24*7 on WhatsApp / Email
![[object Object]](/_next/static/media/star-bottom.7253800d.svg)
Unlock your academic potential
Copyright © 2020–2026 A2Z Services. All Rights Reserved. Developed and managed by ZUCOL.