Apache JMeter: Load Testing and Performance Analysis
VerifiedAdded on 2022/09/05
|6
|1625
|25
Practical Assignment
AI Summary
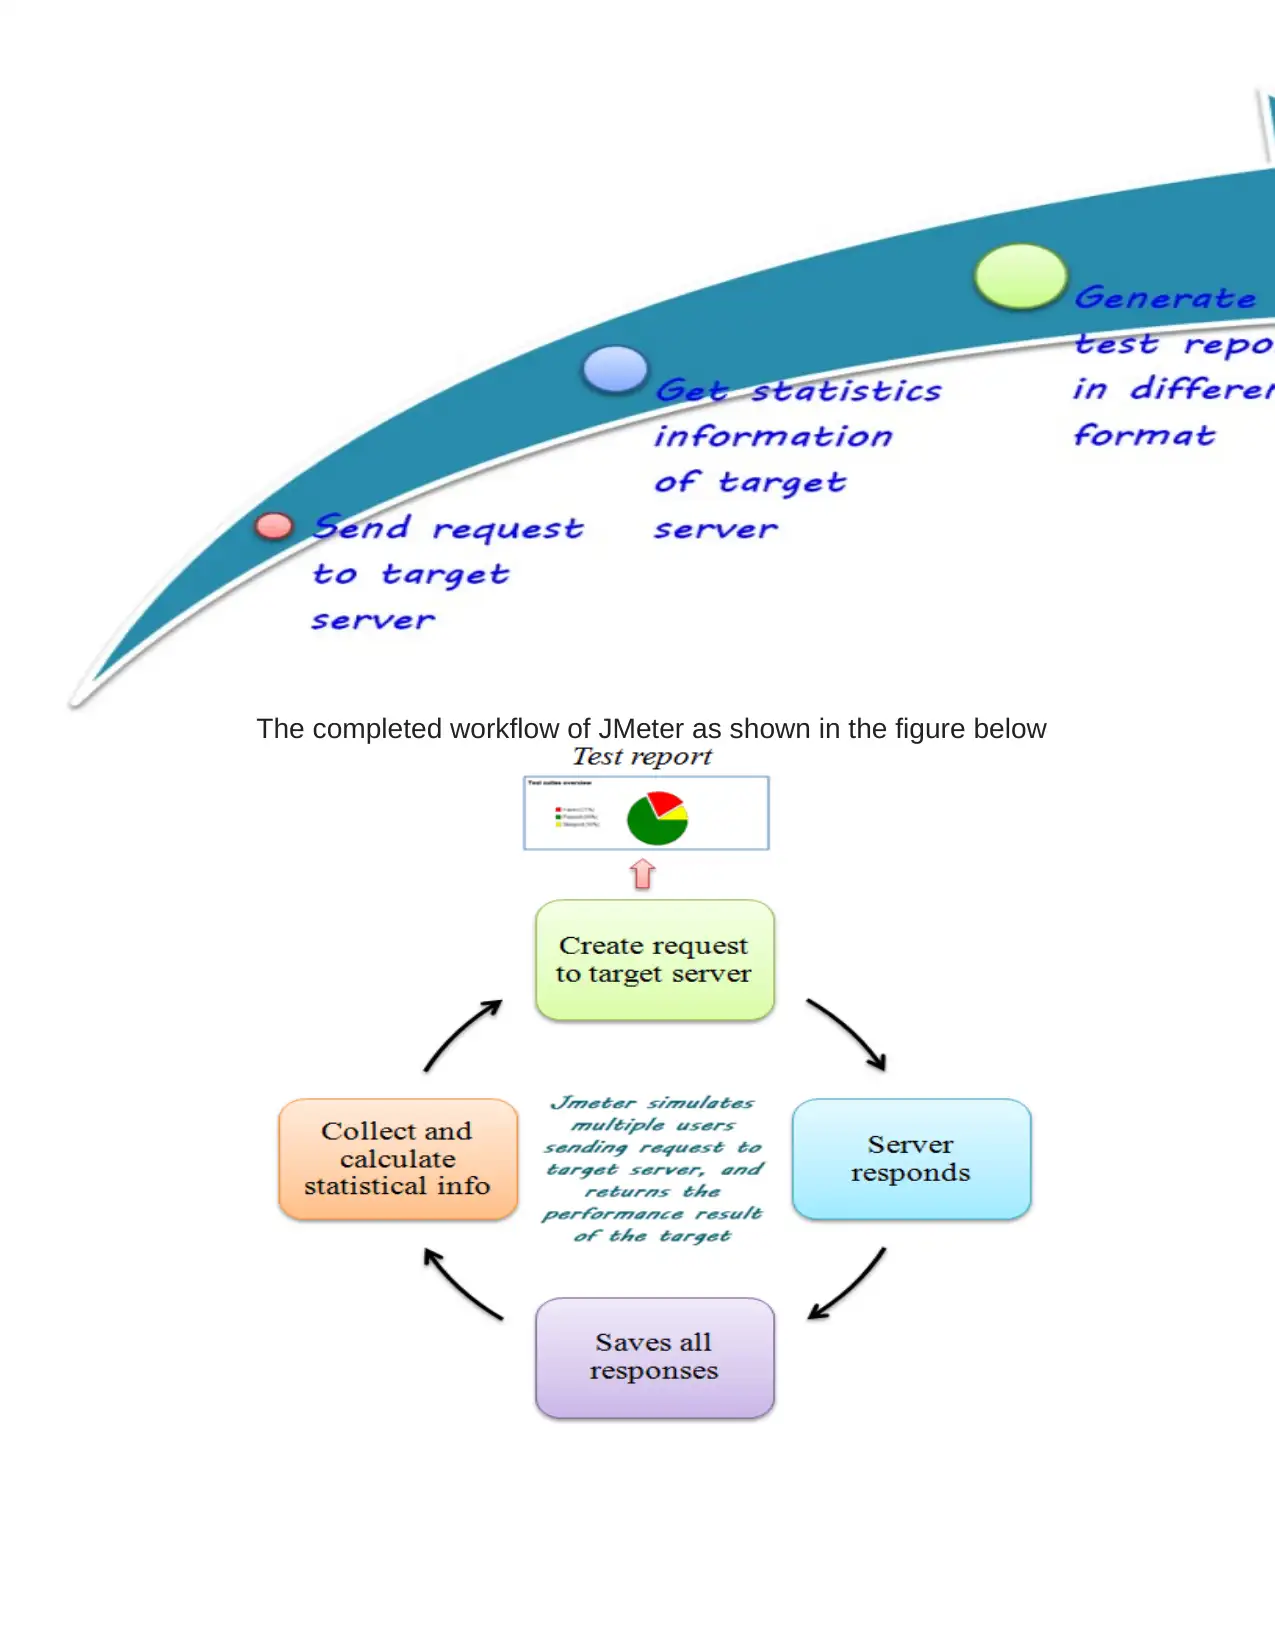
This assignment provides a comprehensive guide to using Apache JMeter for load and performance testing of web applications. It details the step-by-step process of configuring JMeter, including setting up thread groups, HTTP request defaults, and recording controllers. The document explains how to configure a browser to use the JMeter proxy for script recording and how to execute the recorded script. It also covers viewing the results using various listeners, such as the View Results in Tree, View Results in Table, Summary Report, and Graph Results. The assignment includes practical examples, such as testing the performance of Google and Yahoo servers, and explains key performance indicators like throughput and deviation. The document concludes with a discussion of how JMeter simulates user behavior and analyzes server performance, offering insights into optimizing web application performance. This guide is designed to assist students in understanding and applying JMeter for real-world testing scenarios.

1. Select “Test plan” on the Tree.
2. Right click on Test Plan and go to Add > Threads (Users) > Thread Group
Once Thread Group is added, configure the JMeter.
Above figure shows JMeter configuration for 10 users, 5 seconds ramp-up and 1 Loop count.
Number of Threads: The number of users going to hit the server. Ramp-Up Period: Time given for each
user to hit the server. For Example:
100 users, 50 seconds ramp-up – start with 1 user, each second 2 users added
100 users, 100 seconds ramp-up – start with 1 user, each second 1 user added
Loop count: Execute the same process ‘N’ number of times continuously and increase the loop count value.
3. Right click on Thread Group and go to: Add > Config. Element > HTTP Request Defaults.
Add the following three things to this window.
Server Name or IP: Server Name or IP is nothing but URL of the website on which you have to perform the
load test.
Port Number: Add the default port number 8080 to the Port Number field. To change the number, edit it
under Global settings.
Protocol: Here you can mention your required Protocol, http or https. Don’t mention as in Caps.
4. Right click on Thread Group and go to Add > Logic Controller > Recording Controller
You can watch recorded samples of your actions while you are browsing the web applications. Each Https
request will be recorded.
5. Right click on Thread Group and go to Add > Config Element > HTTP Cookie Manager
To use cookies on your web application, add HTTP Cookie Manager to the Thread group.
6. Next, select Workbench. Right click on Workbench and add the Recorder: Add > Non Test
Elements > HTPP(S) Test Script Recorder.
Check whether the port 8080 is open or busy in your system. If it is busy, you should change to the other port
number that is always open in your system. On HTTP(s) Test Script Recorder, click the Add button in “URL
Patterns Include.” Enter “*”. It has to record everything.
To restrict any image types and web pages while recording the scripts, we need to enter the pattern in “URL
Patterns Exclude” which is not being recorded in JMeter.
Example patterns: .*\.png .*\.html .*\.jpg
7. Right click on “HTTP(S) Test Script Recorder” and Listener: Add > Listener > View Results in Tree.
Paraphrase This Document
Need a fresh take? Get an instant paraphrase of this document with our AI Paraphraser

We need to add at least one Listener in the workbench so that we could see results of JMeter while recording.
In JMeter, there are many listeners to view results. We can generate the report in Graph or Table.
Add Listeners: Right click on “Recording Controller” > Add > Listener > View Results in Table. Right
click on “Recording Controller” > Add > Listener > Summary Report. Right click on “Recording
Controller” > Add > Listener > Graph Results.
8. Finally, click the “Start” button in the Script recorder window. Then the JMeter Proxy server will start on
your system. When the JMeter starts, ApacheJMeterTemporaryRootCA.crt certificate will be created in the
bin directory. Click OK and continue.
Note: If you are testing from behind a firewall/proxy server, you may need to run the jmeter.bat file from a
command line mode to use following parameters (If you are working under proxy network in office, use this
method.)
Go to jmeter/bin directory and enter this:
jmeter.bat -H <Hostname or ip address> -P <Server port> -N <Non proxy hosts> -u <Username for proxy –
If required> -a <Password for proxy – if required>
Example: jmeter.bat -H my.proxy.server -P 9090 -u username -a password -N localhost
https://vmokshagroup.com/blog/performance-test-of-web-application-using-apache-jmeter/
Configure Browser to use the JMeter Proxy:
We will use Firefox to test the application. For this, we need to do the following proxy setup in the browser.
Steps to Configure Mozilla Firefox with JMeter Proxy:
1. Open the browser. At that time, don’t close the JMeter window.
2. Click Menu button from the Navigation bar.
3. Choose “Options” menu.
4. Click “Advanced” tab on the left and then select “Network” tab.
5. Click on “Settings” button in the Connection section.
6. Choose “Manual Proxy Configuration.”

7. Type HTTP Proxy as localhost or enter IP Address of your system and then set port as 8080 (Check whether this
port is free. If not change the port)
8. Check “Use this proxy server for all protocols” option.
9. Click “OK” button
10. Click “OK” button again.
Now your browser is configured with JMeter Proxy server. Refer the below image to configure the Firefox
browser.
Now everything is configured and ready to start recording the user actions in JMeter.
Record the Script:
Before starting the recording, ensure that JMeter was started in your system.
1. Open Firefox browser and type the URL of your application then hit enter.
2. Do the actions whatever you want to test in the application.
3. Now go to JMeter and click “Recording Controller” in the Thread Group. Here you can see the script for
whatever actions you did in the browser.
4. Once you are done with the actions in the browser, click on “Stop” button of the HTTP(S) Test Script Recorder
window in JMeter.
Run the Script:
We are ready to run the recorded script. Save the test plan. Run the Test Plan: Press Ctrl + R (or) Click “Start”
button.
While running the script, at the top right corner, a green color square box will display. Once it is completed, the
box will change to Grey.
View Results:
Click on “View Results” in Tree under the Recording Controller.
Click on View Results in Table.
Click on Aggregate Graph > Graph
Click on Summary Report.
In JMeter, we have to save recorded scripts in different formats like JMX, CSV, etc. We can upload the recorded
script files to third party online load testing tools and get detailed and optimal results from there.
How does JMeter work?
The basic workflow of JMeter as shown in the figures below
JMeter simulates a group of users sending requests to a target server, and return statistics
information of target server through graphical diagrams
⊘ This is a preview!⊘
Do you want full access?
Subscribe today to unlock all pages.

Trusted by 1+ million students worldwide

The completed workflow of JMeter as shown in the figure below
Paraphrase This Document
Need a fresh take? Get an instant paraphrase of this document with our AI Paraphraser

Step 1) Add Thread Group
1. Start JMeter
2. Select Test Plan on the tree
3. Add Thread Group
Right click on the "Test Plan" and add a new thread group: Add -> Threads (Users) -
> Thread Group
Number of Threads: 100 (Number of users connects to the target website: 100)
Loop Count: 10 (Number of time to execute testing)
Ramp-Up Period: 100
The Thread Count and The Loop Counts are different.
Ramp-Up Period tells JMeter how long to delay before starting the next user. For example, if
we have 100 users and a 100-second Ramp-Up period, then the delay between starting users
would be 1 second (100 seconds /100 users)

At the bottom of the picture, there are the following statistics, represented in colors:
Black: The total number of current samples sent.
Blue: The current average of all samples sent.
Red: The current standard deviation.
Green: Throughput rate that represents the number of requests per minute the server
handled
To analyze the performance of the web server under test, you should focus on 2 parameters
Throughput
Deviation
The Throughput is the most important parameter. It represents the ability of the server to
handle a heavy load. The higher the Throughput is, the better is the server performance.
In this test, the throughput of Google server is 1,491.193/minute. It means Google server can
handle 1,491.193 requests per minute. This value is quite high so we can conclude that
Google server has good performance
The deviation is shown in red - it indicates the deviation from the average.
The smaller the better.
Let compare the performance of Google server to other web servers. This is the performance
test result of website http://www.yahoo.com/ (You can choose other websites)
The throughput of a website under test http://www.yahoo.com is 867.326/minutes. It means
this server handle 867.326 requests per minute, lower than Google.
The deviation is 2689, much higher than Google (577). So we can determine the performance
of this website is less than a Google server.
In real life visitors do not arrive at a website all at the same time, but at different time
intervals. So Timer will help mimic the real-time behavior.
⊘ This is a preview!⊘
Do you want full access?
Subscribe today to unlock all pages.

Trusted by 1+ million students worldwide
1 out of 6

Your All-in-One AI-Powered Toolkit for Academic Success.
+13062052269
info@desklib.com
Available 24*7 on WhatsApp / Email
Unlock your academic potential
Copyright © 2020–2025 A2Z Services. All Rights Reserved. Developed and managed by ZUCOL.