Report: Capital Structure of APN Outdoors Group Ltd (ACC508)
VerifiedAdded on 2020/03/28
|13
|1669
|120
Report
AI Summary
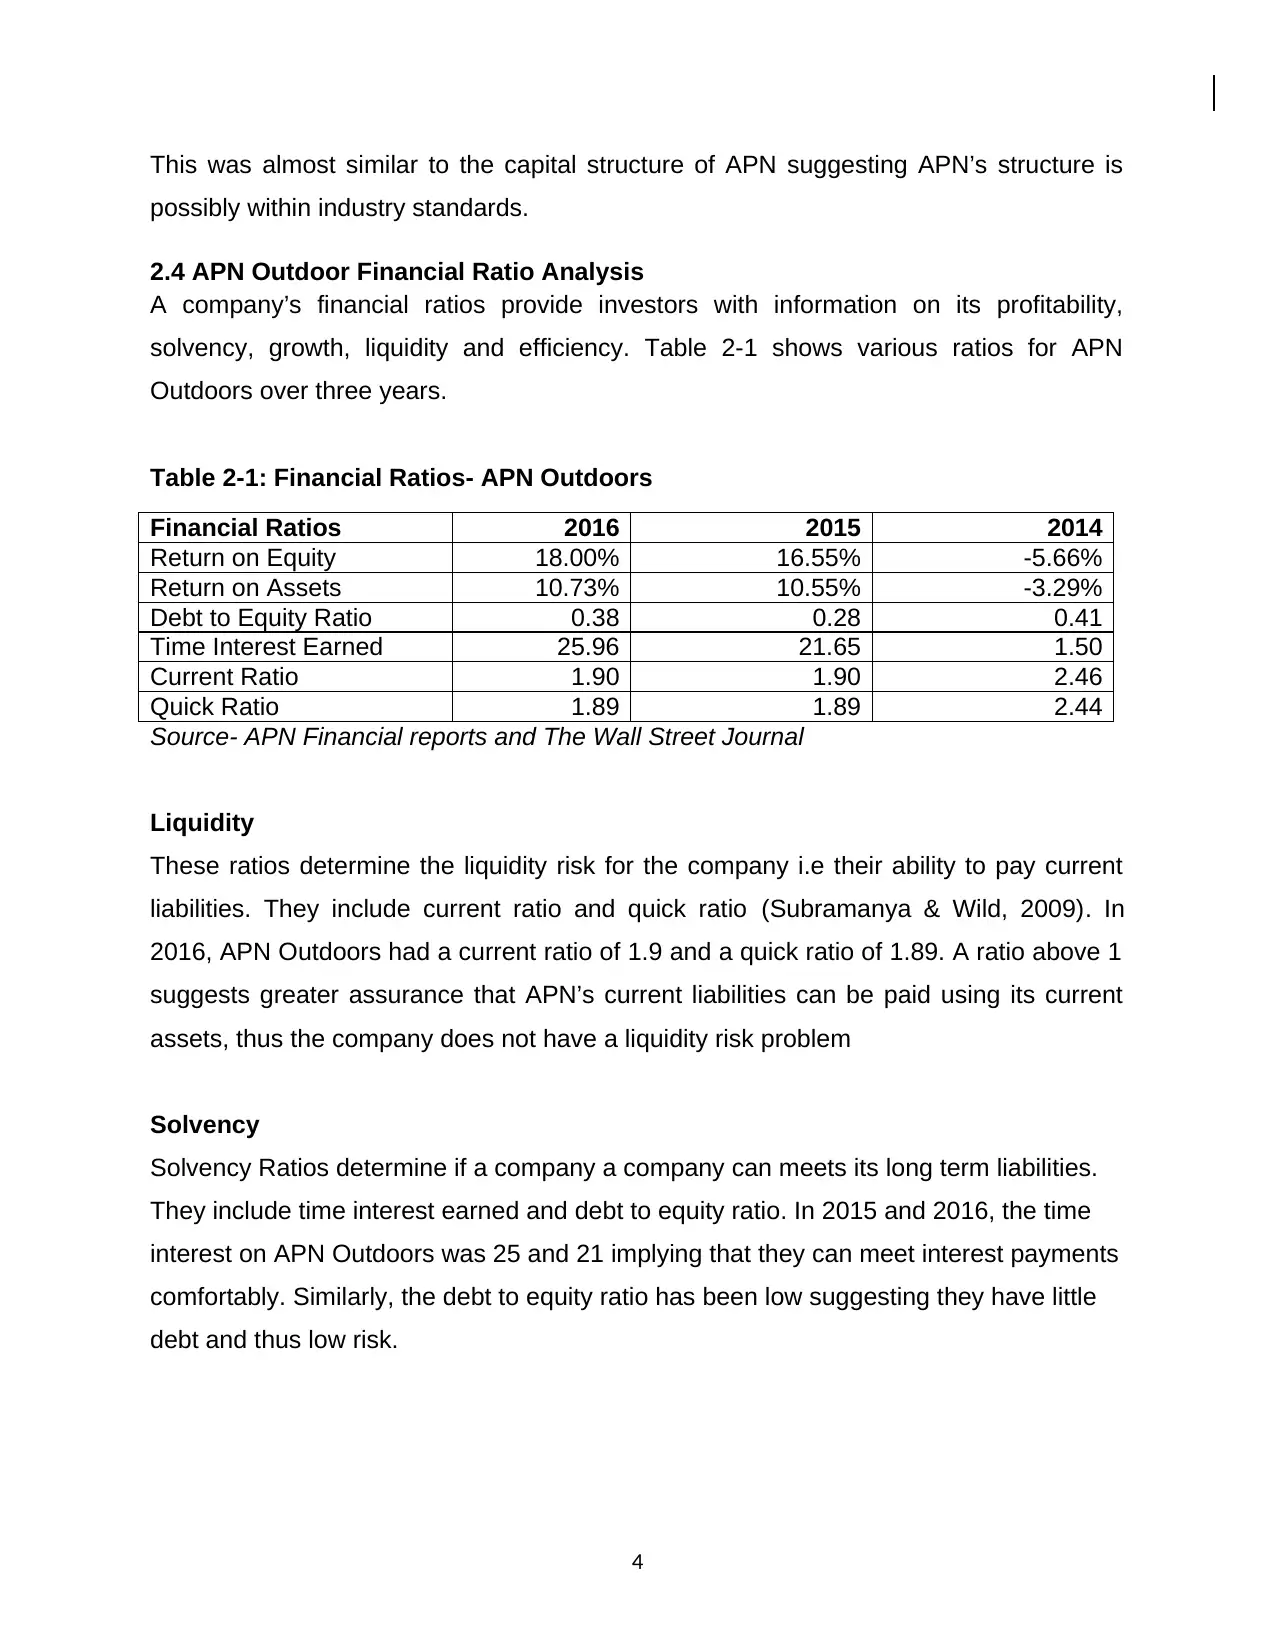
This report provides a comprehensive analysis of the capital structure of APN Outdoors Group Ltd. It examines the company's debt and equity financing, calculates the Weighted Average Cost of Capital (WACC), and compares APN Outdoors' capital structure to industry standards. The report investigates key financial ratios such as return on equity, return on assets, and debt-to-equity ratio over a three-year period to assess the company's liquidity, solvency, and profitability. It concludes that APN Outdoors has not been successful in maximizing shareholder value due to deviations from its optimal capital structure. The analysis highlights the importance of an optimal capital structure in minimizing the cost of capital and maximizing firm value and share price. The report also includes detailed calculations in the appendix, such as the cost of equity and cost of debt.
Contribute Materials
Your contribution can guide someone’s learning journey. Share your
documents today.

Capital Structure of APN Outdoors Group Ltd
Secure Best Marks with AI Grader
Need help grading? Try our AI Grader for instant feedback on your assignments.

EXECUTIVE SUMMARY
A firm’s optimal capital structure is defined as the structure at which tax related benefits
of leverage is offset by debt’s risk. At the optimal capital structure, Weighted Average
Cost of Capital is minimized, the firm value is maximized, and its share price is
maximized.
Analyzing the capital structure provides valuable information to investors who want to
determine whether a firm is creating value for its shareholder’s or not. The financial
statements are a good starting point when analyzing a firm’s capital structure.
i

TABLE OF CONTENTS
EXECUTIVE SUMMARY..........................................................................................................................i
TABLE OF CONTENTS...........................................................................................................................ii
LIST OF TABLES.....................................................................................................................................iii
CHAPTER 1 : INTRODUCTION.............................................................................................................1
CHAPTER 2 : APN OUTDOORS CAPITAL STRUCTURE.................................................................2
2.1 APN Outdoors Current Capital Structure....................................................................................2
2.2 APN Outdoors Weighted Average Cost of Capital....................................................................2
2.3 Comparison of Capital Structure to Industry...............................................................................3
2.4 APN Outdoor Financial Ratio Analysis........................................................................................4
2.4 APN Outdoors Capital Structure over Past Three Years..........................................................5
2.5 Creation of Shareholder Wealth and Minimizing Cost of Capital.............................................5
CHAPTER 3 : CONCLUSION.................................................................................................................6
REFERENCES..........................................................................................................................................7
APPENDIX.................................................................................................................................................8
ii

LIST OF TABLES
Table 2-1: Financial Ratios- APN Outdoors.....................................................................4
iii
Table 2-1: Financial Ratios- APN Outdoors.....................................................................4
iii
Secure Best Marks with AI Grader
Need help grading? Try our AI Grader for instant feedback on your assignments.

CHAPTER 1: INTRODUCTION
The purpose of this report is to analyze the capital structure of APN Outdoor Group and
determine whether APN Outdoor Group has been successful in maximizing shareholder
value over the past three years.
The financial statements of APN were used to investigate the current capital structure of
the group, the optimal capital structure and an analysis of its key financial ratios. Based
on this information, the report then concludes on APN’s value creation.
1

CHAPTER 2: APN OUTDOORS CAPITAL STRUCTURE
2.1 APN Outdoors Current Capital Structure
The current capital structure can be analyzed from the Debt to Equity Ratios. In 2016,
we found that the company was financed using Debt of $102,677,000 and Equity of $
269,199,000. Therefore the capital structure in 2016 was 28% debt and 72% equity.
2.2 APN Outdoors Weighted Average Cost of Capital
The components of the WACC are as follows
Cost of equity
Cost of debt
Corporate tax rate
Weight of Equity
Weight of Debt
1. Cost of Equity
The cost of equity, Re can be determined from Capital Asset Pricing Model
Re = rf +β(rm –rf)
Where rf = Risk free rate, β= Beta, (rm –rf)= Risk premium
In 2016, the cost of equity for APN Outdoor was 8.38%
2. Cost of Debt
To calculate the cost of debt we need to divide the total debt by the interest expense. In
2016, the cost of debt for APN Outdoor was 2.77% (see appendix for detailed
calculation).
3. Corporate Tax
As stated in their 2016 audited financial statements, it can be assumed that the
applicable corporate tax rate is 30% (APN Outdoors, 2017).
2

4. Weigh of Debt and Equity
To determine the Weights of Equity and Debt, we require the market value of Equity (E)
and the book value of Debt (D).
The market value of Equity is the current share price, P0, multiplied by the number of
shares outstanding. These data is available from Yahoo! Finance (Yahoo Finance,
2017). In 2016, E was $753,122,400
The book value of Debt (D) can be obtained from the Balance Sheet. In 2016, D was
$102,677,000.
Weight of Debt, Wd= D/D+E = 12%
Weight of Equity, We= E/D+E = 88%
5. Weighted Average Cost of Capital
In order to determine the optimal capital structure of APN, we need to determine APN
Outdoor’s Weighted Average Cost of Capital.
WACC =Weight Debt * cost of debt *(1 – T) + Weight equity *cost of equity
Where T is the corporate tax
We calculate the WACC for APN Outdoor as 7.47%. Therefore the optimal mix that will
maximize the value of APN Outdoor is 12% debt and 88% equity.
2.3 Comparison of Capital Structure to Industry
Both APN Outdoor and oOH! Media Ltd (OML) are listed companies in the advertising
industry (oOH! Media Ltd , 2017).
Similarly, the current capital structure for Ooh! Media can be analyzed from the Debt to
Equity Ratios. In 2016, oOh Media’s capital structure was 27% debt and 73% equity.
3
Paraphrase This Document
Need a fresh take? Get an instant paraphrase of this document with our AI Paraphraser

This was almost similar to the capital structure of APN suggesting APN’s structure is
possibly within industry standards.
2.4 APN Outdoor Financial Ratio Analysis
A company’s financial ratios provide investors with information on its profitability,
solvency, growth, liquidity and efficiency. Table 2-1 shows various ratios for APN
Outdoors over three years.
Table 2-1: Financial Ratios- APN Outdoors
Financial Ratios 2016 2015 2014
Return on Equity 18.00% 16.55% -5.66%
Return on Assets 10.73% 10.55% -3.29%
Debt to Equity Ratio 0.38 0.28 0.41
Time Interest Earned 25.96 21.65 1.50
Current Ratio 1.90 1.90 2.46
Quick Ratio 1.89 1.89 2.44
Source- APN Financial reports and The Wall Street Journal
Liquidity
These ratios determine the liquidity risk for the company i.e their ability to pay current
liabilities. They include current ratio and quick ratio (Subramanya & Wild, 2009). In
2016, APN Outdoors had a current ratio of 1.9 and a quick ratio of 1.89. A ratio above 1
suggests greater assurance that APN’s current liabilities can be paid using its current
assets, thus the company does not have a liquidity risk problem
Solvency
Solvency Ratios determine if a company a company can meets its long term liabilities.
They include time interest earned and debt to equity ratio. In 2015 and 2016, the time
interest on APN Outdoors was 25 and 21 implying that they can meet interest payments
comfortably. Similarly, the debt to equity ratio has been low suggesting they have little
debt and thus low risk.
4

Profitability
These ratios measure whether a company is profitable. They include return on asset
and return on equity (Subramanya & Wild, 2009). In 2016, APN Outdoors had a return
on asset of 10.73% and return on equity of 18%. Since the ratio is high and is
increasing each year then APN is doing well.
2.4 APN Outdoors Capital Structure over Past Three Years
We note for year 2015 and 2014, the capital structure was 22%debt/78%equity and
29%debt/71%equity respectively. This suggests that in 2016, APN diverted significantly
from its optimal structure. In 2015 they appeared to be at a closer to its optimal
structure.
2.5 Creation of Shareholder Wealth and Minimizing Cost of Capital
Since APN Outdoor’s current structure is not at its optimal capital structure of 12% debt
and 88% equity, it has not been creating value for three years. However, it can be
argued the company has performed well in the short term in terms of growth and
profitability as evidenced by their financial ratios.
One of the ways a firm can increase its share price, and hence create value for
shareholder’s is by minimizing its cost of capital. Thus it is important that the firm targets
an optimal capital structure. An alternative capital structure which also minimizes the
cost of capital is via asset based lending.
5

CHAPTER 3: CONCLUSION
A firm can create value for its shareholders by targeting its optimal capital structure.
This is because at this level, WACC is minimized, the value of a firm is maximized, and
price per share is maximized.
In the case for APN Outdoors, since it capital structure for the last three years has been
away from the optimal mix, we can conclude the company has not been successful in
maximizing its shareholder value.
6
Secure Best Marks with AI Grader
Need help grading? Try our AI Grader for instant feedback on your assignments.

REFERENCES
APN Outdoors. (2017). Retrieved from APN Outdoors: https://www.apnoutdoors.com.au
oOH! Media Ltd . (2017). About Us. Retrieved from oOH! Media Ltd : https://www.oohmedia.com.au
Subramanya, K., & Wild, J. (2009). Financial Statement Analysis. New York: McGraw-Hill Irwin.
The Wall Street Journal. (2017). APN Outdoor Group Ltd. Retrieved from The Wall Street Journal:
http://quotes.wsj.com/AU/XASX/APO/financials/annual/balance-sheet
Yahoo Finance. (2017). APN OUTDOORS LTD. Retrieved from Yahoo Finance:
https://au.finance.yahoo.com
7

APPENDIX
Cost of Equity
Re = rf +β(rm –rf)
Re = 2.4% + 1.3 (7%-2.4%)
Re = 8.38%
Cost of Debt
2016 2015 2014
Short Term Debt 0 149 0
Long Term Debt
102,677.0
0
69,395.0
0
88,511.0
0
Total Debt
102,677.0
0
69,544.0
0
88,511.0
0
Interest Expense 2,846.00 3,535.00
29,784.0
0
Interest Rate (Cost
of Debt) 2.772% 5.083% 33.650%
Weights of Debt and Equity
Market Value Equity (E) $ 753,122.40
Book Value of Debt (D) $ 102,677.00
D+E $ 855,799.40
Po 4.52
# Shares Outstanding 166.62 million
Market Value Equity 753,122.40
Wd 12%
We 88%
Ooh Media Ltd Capital Structure
Total Debt
122
,000.00
Equity 327,000.00
8

Wd-current 27%
We-current 73%
APN Outdoor 3 Year Capital Structure
Debt 102,677.00 69,544.00 88,511.00
Equity 269,199.00 248,095.00 216,274.00
Debt/Equity
0.3
8 0.28
0.4
1
9
We-current 73%
APN Outdoor 3 Year Capital Structure
Debt 102,677.00 69,544.00 88,511.00
Equity 269,199.00 248,095.00 216,274.00
Debt/Equity
0.3
8 0.28
0.4
1
9
1 out of 13
Related Documents

Your All-in-One AI-Powered Toolkit for Academic Success.
+13062052269
info@desklib.com
Available 24*7 on WhatsApp / Email
Unlock your academic potential
© 2024 | Zucol Services PVT LTD | All rights reserved.