Analysis of APN Outdoor Group's Capital Structure and Financials
VerifiedAdded on 2020/04/01
|13
|2112
|116
Report
AI Summary
This finance report provides a comprehensive analysis of APN Outdoor Group's capital structure based on its 2016 annual report. The report examines the company's debt-equity ratio, weighted average cost of capital (WACC), and financial performance, including profitability and return on equity (ROE). It uses ratio analysis and trend analysis to assess the company's financial health and compares it to a competitor, oOh!media Limited. The analysis covers the impact of changes in capital structure, the importance of minimizing the cost of capital, and how the company aims for wealth maximization for its shareholders. The report concludes with key findings and recommendations for the company's financial strategy.

Paraphrase This Document
Need a fresh take? Get an instant paraphrase of this document with our AI Paraphraser
1
By student name
Professor
University
Date: 16 Spetember 2017.
1 | P a g e
By student name
Professor
University
Date: 16 Spetember 2017.
1 | P a g e
2
Contents
Executive Summary…..……………………..........……………………………..……………………...3
Introduction……………………………………..........……………………………..……………………...4
Analysis and calculations..………………..........……………………………..……………………...5
Conclusion…..…………………………………..........……………………………..……………………...11
Refrences.....……………………………………………………………….......................................12
2 | P a g e
⊘ This is a preview!⊘
Do you want full access?
Subscribe today to unlock all pages.
Trusted by 1+ million students worldwide
3
Executive Summary
In the given report, we are going to analyse the company APN Outdoor Group on the basis of the annual
report for the year ended 2016 and being a part of the finance team of APN group, it becomes chief
responsibility for reviewing and preparing a report on the same. In the give assignment, a report on the
capital structure of the company is to be prepared and to coe out with the view that whether the
company is generating wealth for the shareholders and is involved in the wealth maximisation. The
analysis would be done based on the various analystical procedures including the ratio analysis and
trend analysis for the past few years. Moreover, it has to be compared with the another company of the
same industry to comment upon the firm’s capital structure and the composition of the same. This will
also include the in depth analysis on the cost of capital and how it can be minimised in the long run to
increase th eefficieny of the firm and to increase the profitability as well as th wealth for the company.
In addition to all this, it will include the alternative capital structure that can be implemented in the firm
so as to lower the cost of weighted average cost of capital.
3 | P a g e
Paraphrase This Document
Need a fresh take? Get an instant paraphrase of this document with our AI Paraphraser
4
Introduction
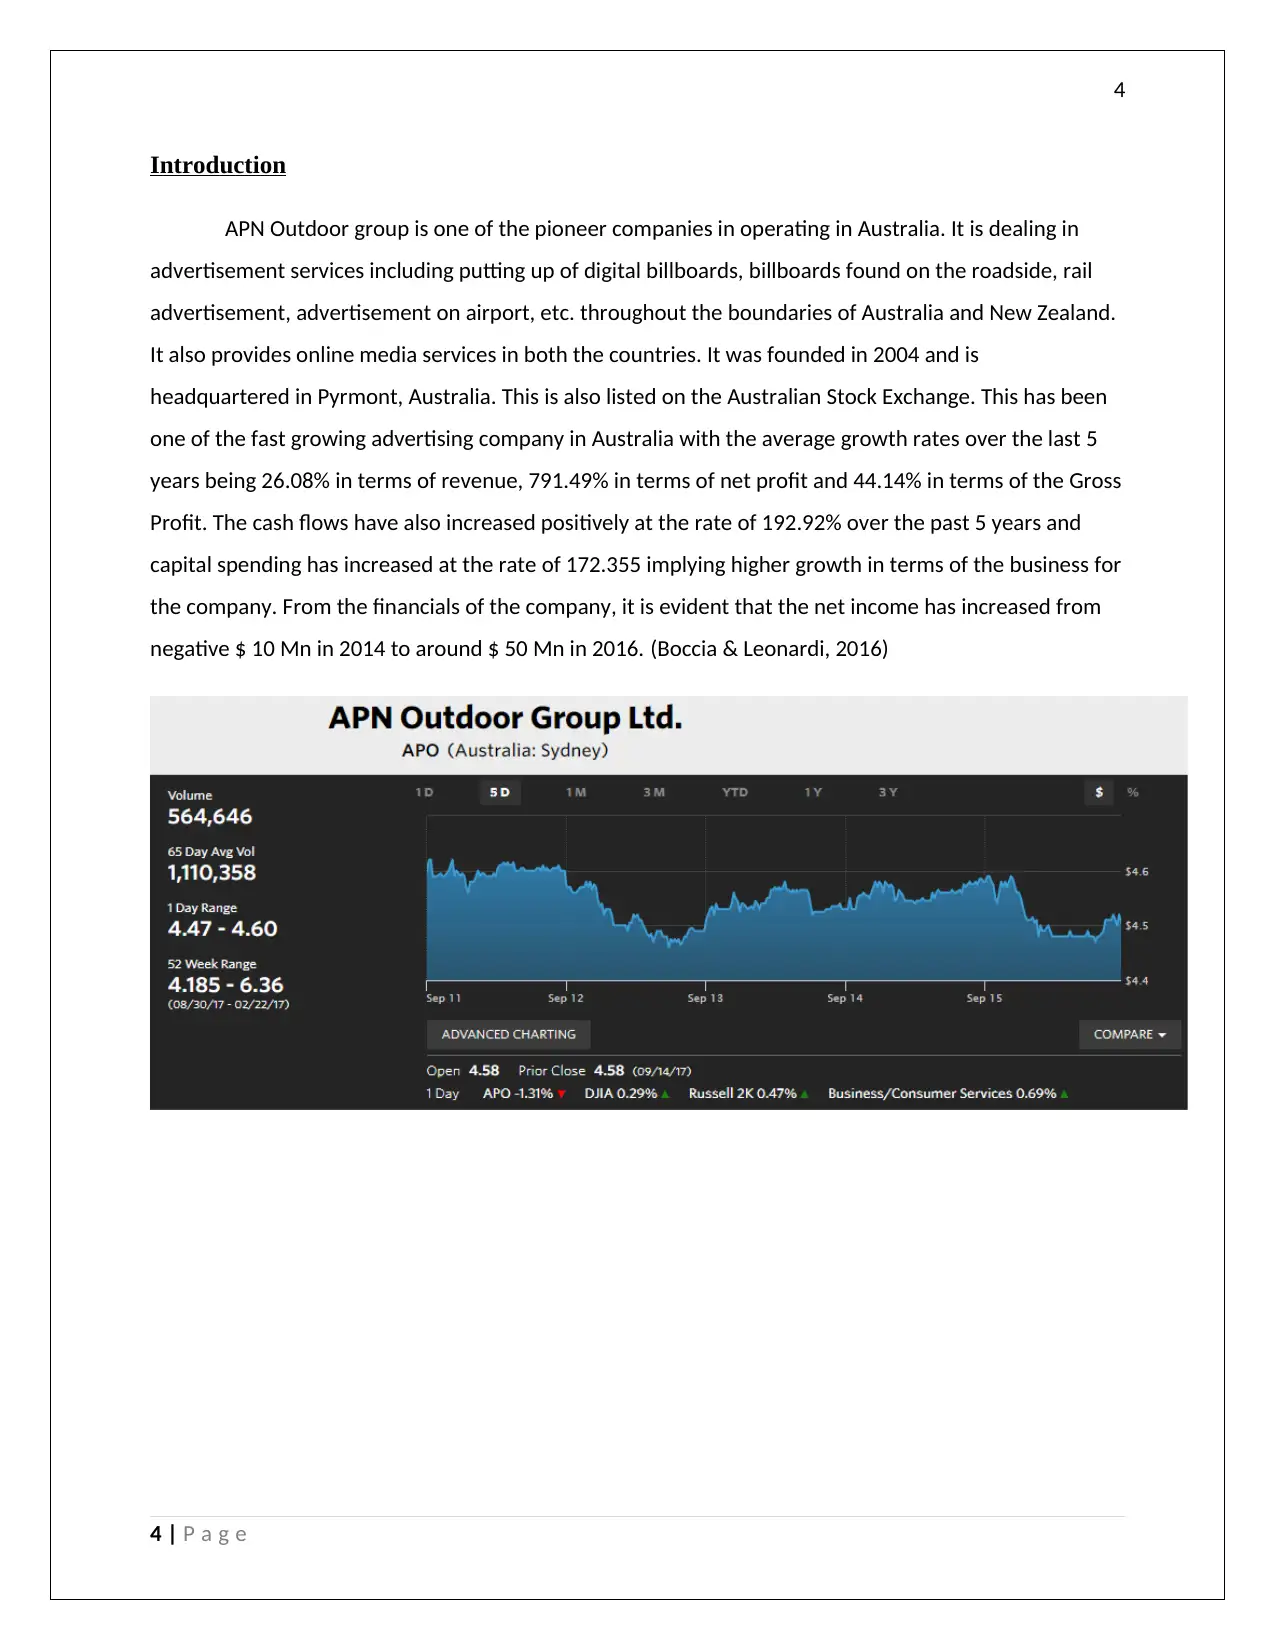
APN Outdoor group is one of the pioneer companies in operating in Australia. It is dealing in
advertisement services including putting up of digital billboards, billboards found on the roadside, rail
advertisement, advertisement on airport, etc. throughout the boundaries of Australia and New Zealand.
It also provides online media services in both the countries. It was founded in 2004 and is
headquartered in Pyrmont, Australia. This is also listed on the Australian Stock Exchange. This has been
one of the fast growing advertising company in Australia with the average growth rates over the last 5
years being 26.08% in terms of revenue, 791.49% in terms of net profit and 44.14% in terms of the Gross
Profit. The cash flows have also increased positively at the rate of 192.92% over the past 5 years and
capital spending has increased at the rate of 172.355 implying higher growth in terms of the business for
the company. From the financials of the company, it is evident that the net income has increased from
negative $ 10 Mn in 2014 to around $ 50 Mn in 2016. (Boccia & Leonardi, 2016)
4 | P a g e
Introduction
APN Outdoor group is one of the pioneer companies in operating in Australia. It is dealing in
advertisement services including putting up of digital billboards, billboards found on the roadside, rail
advertisement, advertisement on airport, etc. throughout the boundaries of Australia and New Zealand.
It also provides online media services in both the countries. It was founded in 2004 and is
headquartered in Pyrmont, Australia. This is also listed on the Australian Stock Exchange. This has been
one of the fast growing advertising company in Australia with the average growth rates over the last 5
years being 26.08% in terms of revenue, 791.49% in terms of net profit and 44.14% in terms of the Gross
Profit. The cash flows have also increased positively at the rate of 192.92% over the past 5 years and
capital spending has increased at the rate of 172.355 implying higher growth in terms of the business for
the company. From the financials of the company, it is evident that the net income has increased from
negative $ 10 Mn in 2014 to around $ 50 Mn in 2016. (Boccia & Leonardi, 2016)
4 | P a g e
5
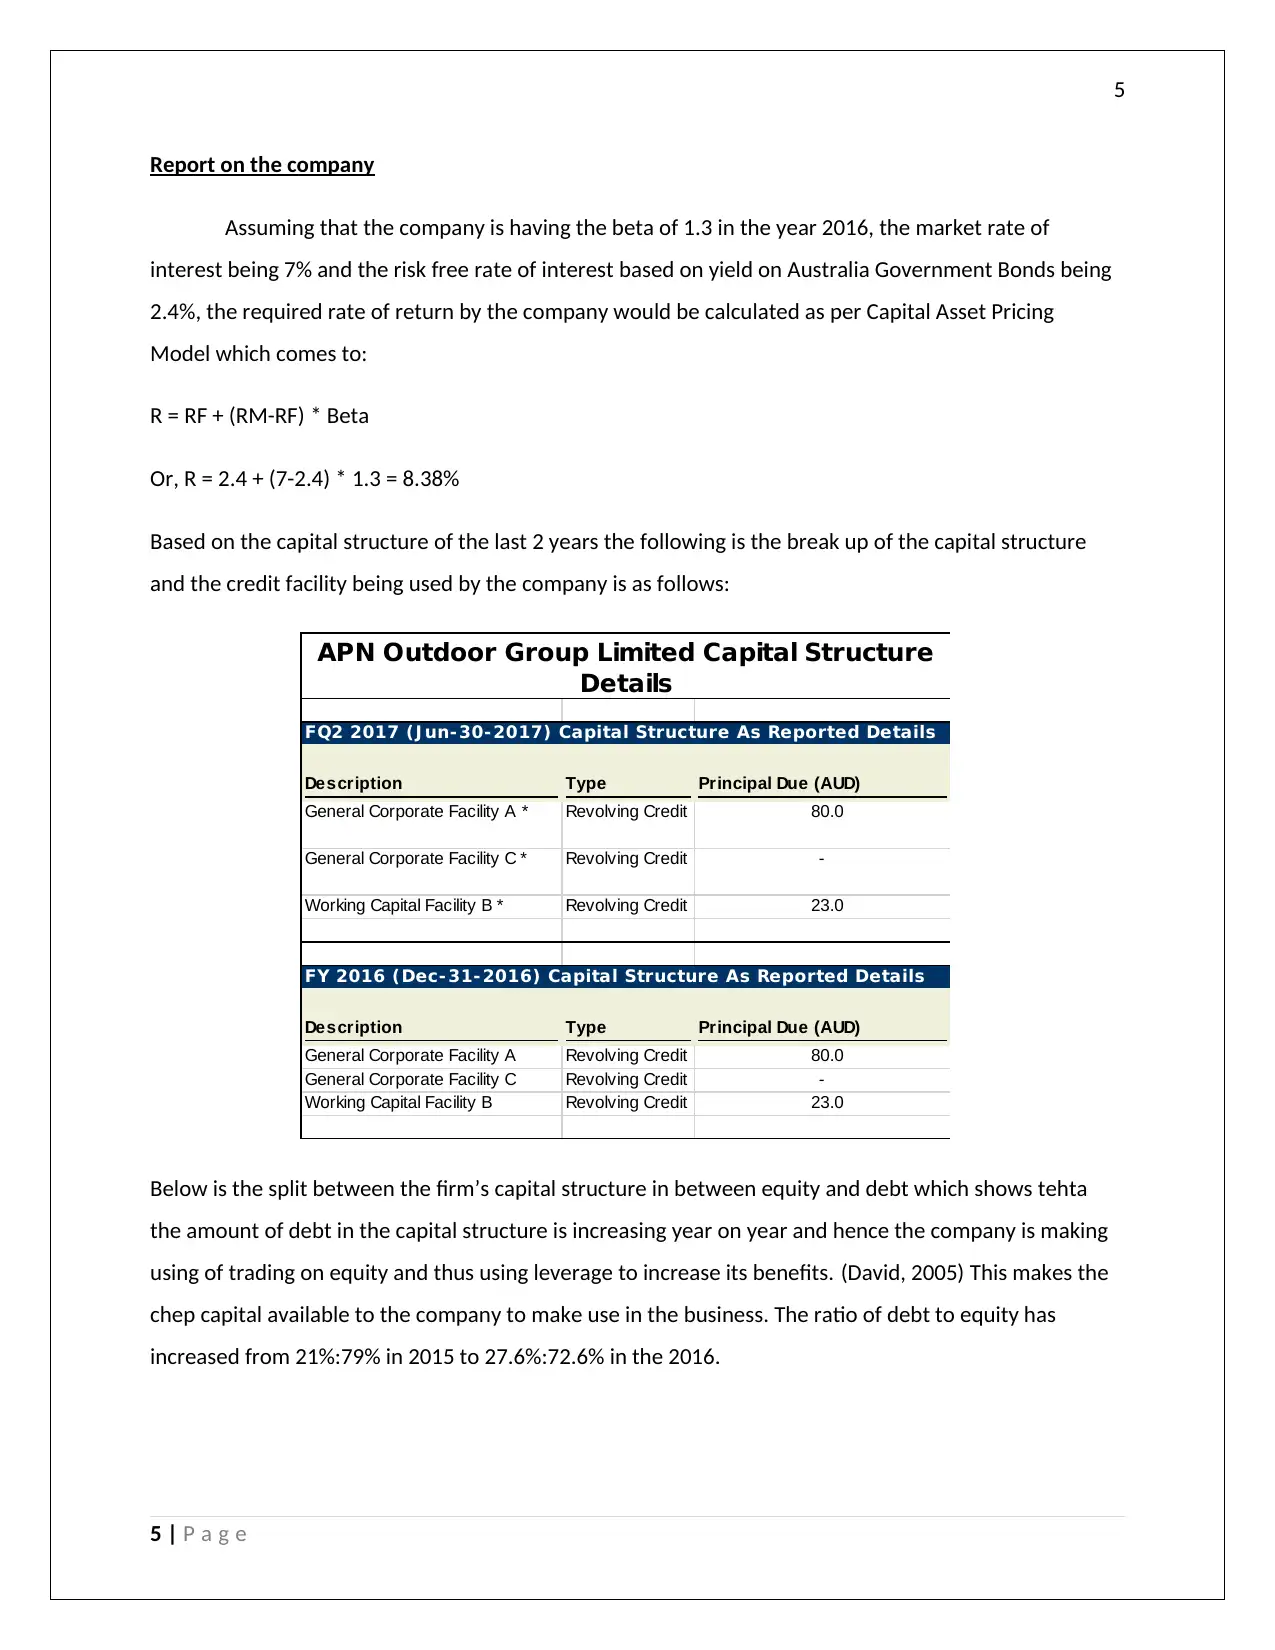
Report on the company
Assuming that the company is having the beta of 1.3 in the year 2016, the market rate of
interest being 7% and the risk free rate of interest based on yield on Australia Government Bonds being
2.4%, the required rate of return by the company would be calculated as per Capital Asset Pricing
Model which comes to:
R = RF + (RM-RF) * Beta
Or, R = 2.4 + (7-2.4) * 1.3 = 8.38%
Based on the capital structure of the last 2 years the following is the break up of the capital structure
and the credit facility being used by the company is as follows:
FQ2 2017 (J un- 30- 2017) Capital Structure As Reported Details
Description Type Principal Due (AUD)
General Corporate Facility A * Revolving Credit 80.0
General Corporate Facility C * Revolving Credit -
Working Capital Facility B * Revolving Credit 23.0
FY 2016 (Dec- 31- 2016) Capital Structure As Reported Details
Description Type Principal Due (AUD)
General Corporate Facility A Revolving Credit 80.0
General Corporate Facility C Revolving Credit -
Working Capital Facility B Revolving Credit 23.0
APN Outdoor Group Limited Capital Structure
Details
Below is the split between the firm’s capital structure in between equity and debt which shows tehta
the amount of debt in the capital structure is increasing year on year and hence the company is making
using of trading on equity and thus using leverage to increase its benefits. (David, 2005) This makes the
chep capital available to the company to make use in the business. The ratio of debt to equity has
increased from 21%:79% in 2015 to 27.6%:72.6% in the 2016.
5 | P a g e
⊘ This is a preview!⊘
Do you want full access?
Subscribe today to unlock all pages.
Trusted by 1+ million students worldwide
6
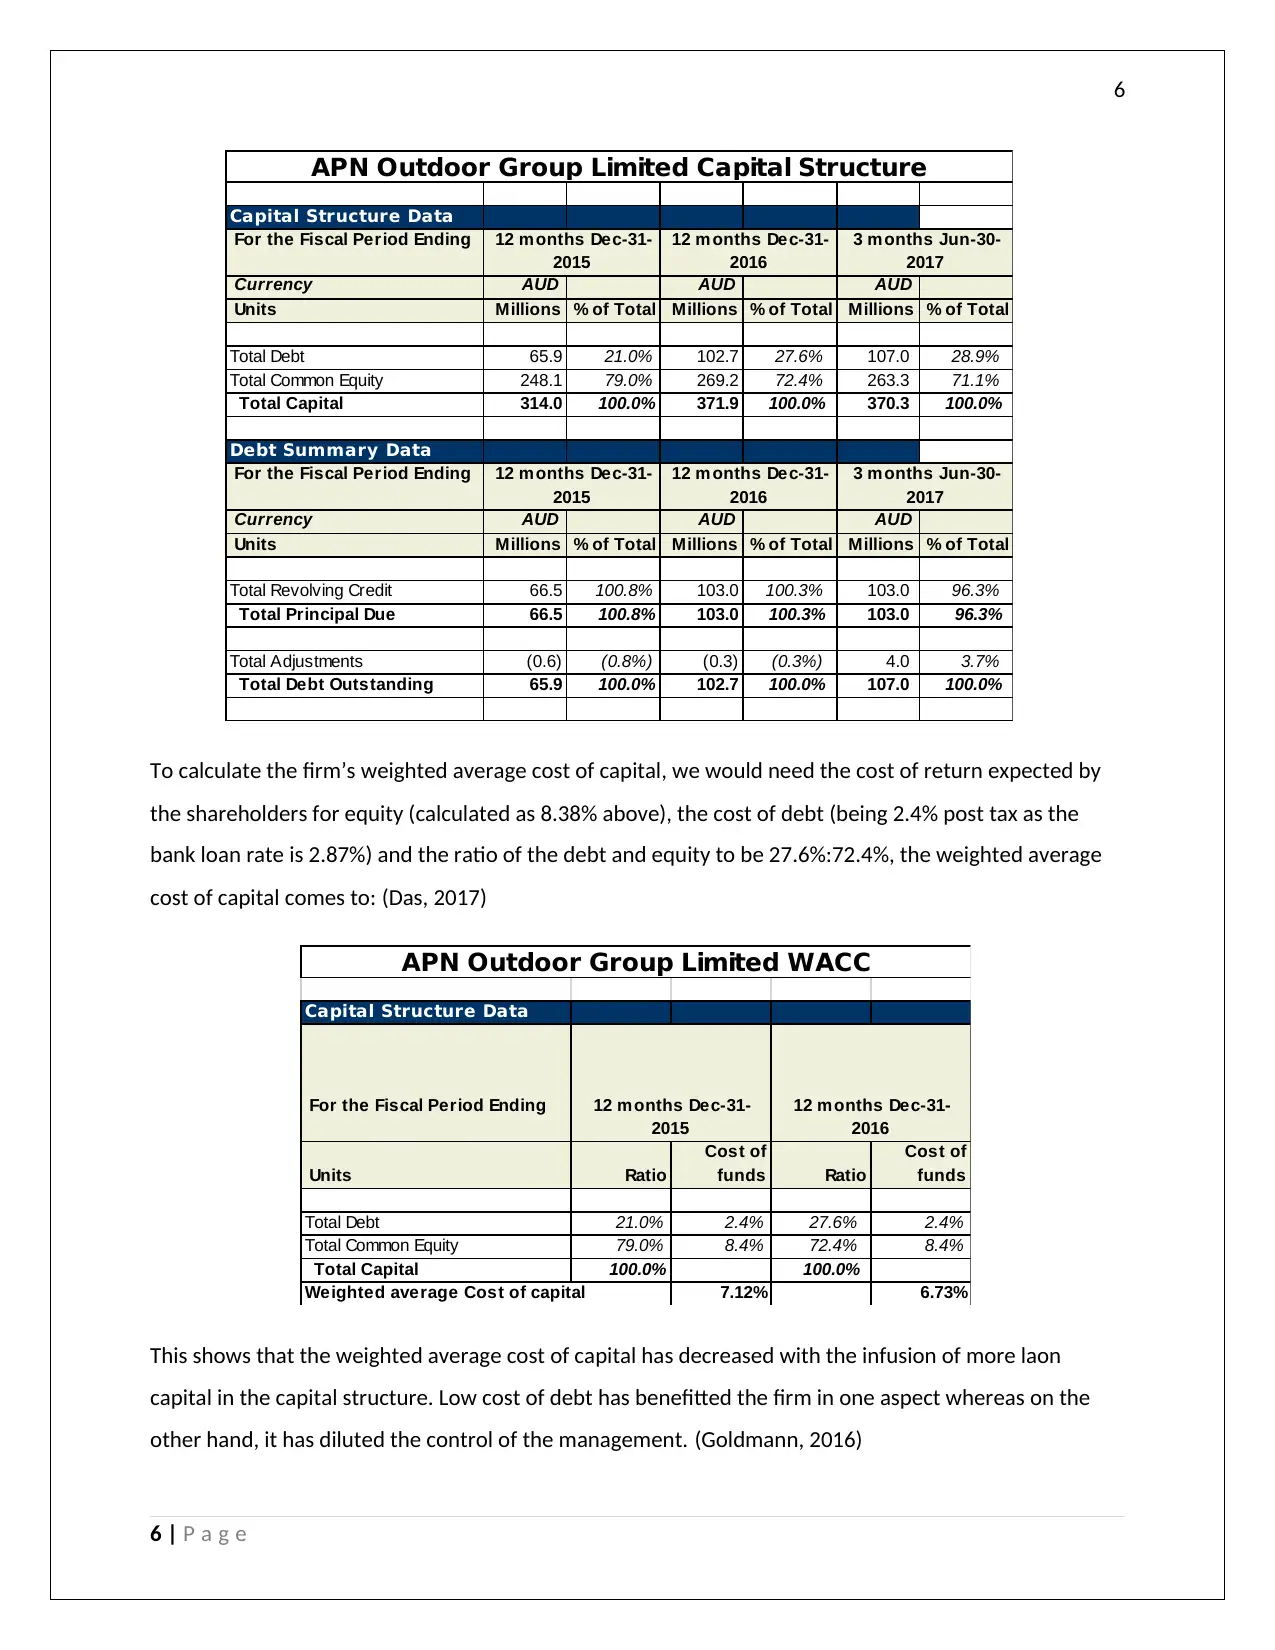
Capital Structure Data
For the Fiscal Period Ending
Currency AUD AUD AUD
Units Millions % of Total Millions % of Total Millions % of Total
Total Debt 65.9 21.0% 102.7 27.6% 107.0 28.9%
Total Common Equity 248.1 79.0% 269.2 72.4% 263.3 71.1%
Total Capital 314.0 100.0% 371.9 100.0% 370.3 100.0%
Debt Summary Data
For the Fiscal Period Ending
Currency AUD AUD AUD
Units Millions % of Total Millions % of Total Millions % of Total
Total Revolving Credit 66.5 100.8% 103.0 100.3% 103.0 96.3%
Total Principal Due 66.5 100.8% 103.0 100.3% 103.0 96.3%
Total Adjustments (0.6) (0.8%) (0.3) (0.3%) 4.0 3.7%
Total Debt Outstanding 65.9 100.0% 102.7 100.0% 107.0 100.0%
APN Outdoor Group Limited Capital Structure
12 m onths Dec-31-
2015
12 m onths Dec-31-
2016
3 m onths Jun-30-
2017
12 m onths Dec-31-
2015
12 m onths Dec-31-
2016
3 m onths Jun-30-
2017
To calculate the firm’s weighted average cost of capital, we would need the cost of return expected by
the shareholders for equity (calculated as 8.38% above), the cost of debt (being 2.4% post tax as the
bank loan rate is 2.87%) and the ratio of the debt and equity to be 27.6%:72.4%, the weighted average
cost of capital comes to: (Das, 2017)
Capital Structure Data
For the Fiscal Period Ending
Units Ratio
Cost of
funds Ratio
Cost of
funds
Total Debt 21.0% 2.4% 27.6% 2.4%
Total Common Equity 79.0% 8.4% 72.4% 8.4%
Total Capital 100.0% 100.0%
Weighted average Cost of capital 7.12% 6.73%
12 m onths Dec-31-
2015
12 m onths Dec-31-
2016
APN Outdoor Group Limited WACC
This shows that the weighted average cost of capital has decreased with the infusion of more laon
capital in the capital structure. Low cost of debt has benefitted the firm in one aspect whereas on the
other hand, it has diluted the control of the management. (Goldmann, 2016)
6 | P a g e
Capital Structure Data
For the Fiscal Period Ending
Currency AUD AUD AUD
Units Millions % of Total Millions % of Total Millions % of Total
Total Debt 65.9 21.0% 102.7 27.6% 107.0 28.9%
Total Common Equity 248.1 79.0% 269.2 72.4% 263.3 71.1%
Total Capital 314.0 100.0% 371.9 100.0% 370.3 100.0%
Debt Summary Data
For the Fiscal Period Ending
Currency AUD AUD AUD
Units Millions % of Total Millions % of Total Millions % of Total
Total Revolving Credit 66.5 100.8% 103.0 100.3% 103.0 96.3%
Total Principal Due 66.5 100.8% 103.0 100.3% 103.0 96.3%
Total Adjustments (0.6) (0.8%) (0.3) (0.3%) 4.0 3.7%
Total Debt Outstanding 65.9 100.0% 102.7 100.0% 107.0 100.0%
APN Outdoor Group Limited Capital Structure
12 m onths Dec-31-
2015
12 m onths Dec-31-
2016
3 m onths Jun-30-
2017
12 m onths Dec-31-
2015
12 m onths Dec-31-
2016
3 m onths Jun-30-
2017
To calculate the firm’s weighted average cost of capital, we would need the cost of return expected by
the shareholders for equity (calculated as 8.38% above), the cost of debt (being 2.4% post tax as the
bank loan rate is 2.87%) and the ratio of the debt and equity to be 27.6%:72.4%, the weighted average
cost of capital comes to: (Das, 2017)
Capital Structure Data
For the Fiscal Period Ending
Units Ratio
Cost of
funds Ratio
Cost of
funds
Total Debt 21.0% 2.4% 27.6% 2.4%
Total Common Equity 79.0% 8.4% 72.4% 8.4%
Total Capital 100.0% 100.0%
Weighted average Cost of capital 7.12% 6.73%
12 m onths Dec-31-
2015
12 m onths Dec-31-
2016
APN Outdoor Group Limited WACC
This shows that the weighted average cost of capital has decreased with the infusion of more laon
capital in the capital structure. Low cost of debt has benefitted the firm in one aspect whereas on the
other hand, it has diluted the control of the management. (Goldmann, 2016)
6 | P a g e
Paraphrase This Document
Need a fresh take? Get an instant paraphrase of this document with our AI Paraphraser
7
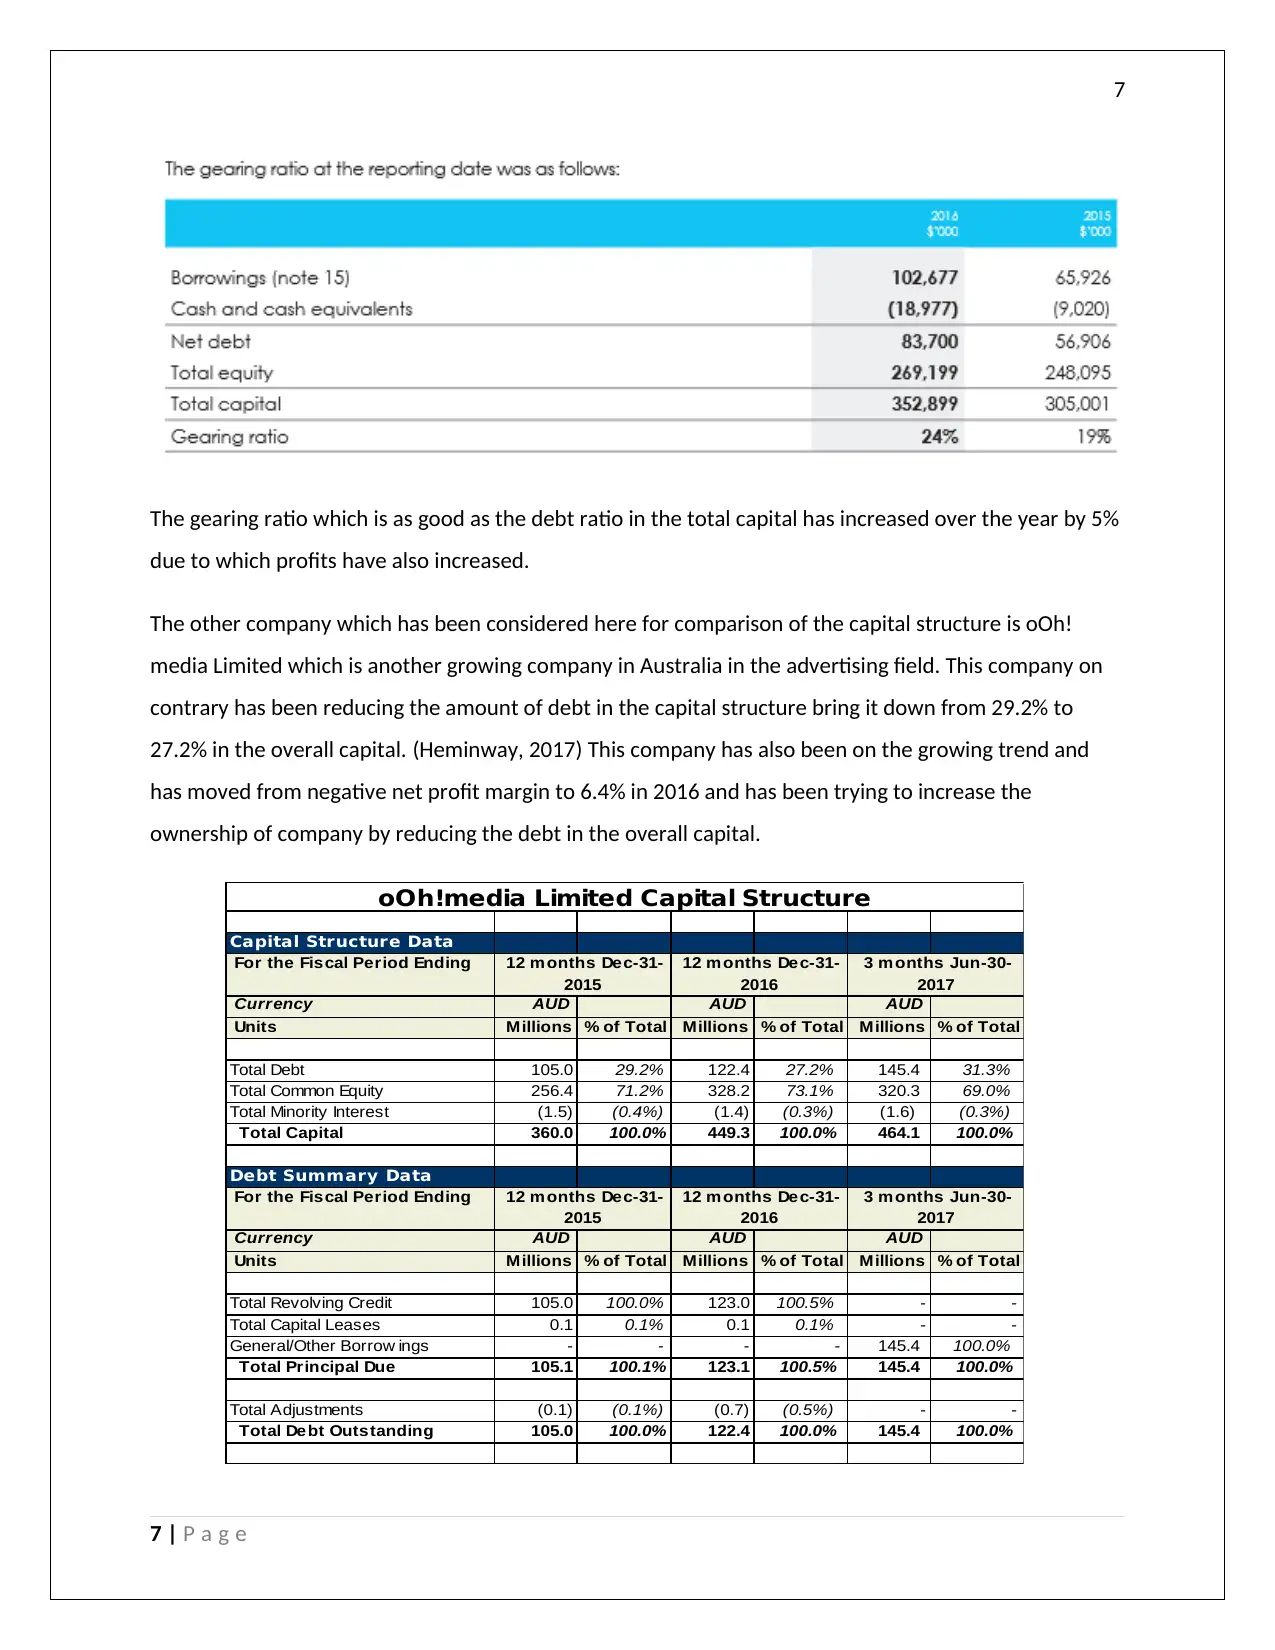
The gearing ratio which is as good as the debt ratio in the total capital has increased over the year by 5%
due to which profits have also increased.
The other company which has been considered here for comparison of the capital structure is oOh!
media Limited which is another growing company in Australia in the advertising field. This company on
contrary has been reducing the amount of debt in the capital structure bring it down from 29.2% to
27.2% in the overall capital. (Heminway, 2017) This company has also been on the growing trend and
has moved from negative net profit margin to 6.4% in 2016 and has been trying to increase the
ownership of company by reducing the debt in the overall capital.
Capital Structure Data
For the Fiscal Period Ending
Currency AUD AUD AUD
Units Millions % of Total Millions % of Total Millions % of Total
Total Debt 105.0 29.2% 122.4 27.2% 145.4 31.3%
Total Common Equity 256.4 71.2% 328.2 73.1% 320.3 69.0%
Total Minority Interest (1.5) (0.4%) (1.4) (0.3%) (1.6) (0.3%)
Total Capital 360.0 100.0% 449.3 100.0% 464.1 100.0%
Debt Summary Data
For the Fiscal Period Ending
Currency AUD AUD AUD
Units Millions % of Total Millions % of Total Millions % of Total
Total Revolving Credit 105.0 100.0% 123.0 100.5% - -
Total Capital Leases 0.1 0.1% 0.1 0.1% - -
General/Other Borrow ings - - - - 145.4 100.0%
Total Principal Due 105.1 100.1% 123.1 100.5% 145.4 100.0%
Total Adjustments (0.1) (0.1%) (0.7) (0.5%) - -
Total Debt Outstanding 105.0 100.0% 122.4 100.0% 145.4 100.0%
oOh!media Limited Capital Structure
12 m onths Dec-31-
2015
12 m onths Dec-31-
2016
3 m onths Jun-30-
2017
12 m onths Dec-31-
2015
12 m onths Dec-31-
2016
3 m onths Jun-30-
2017
7 | P a g e
8
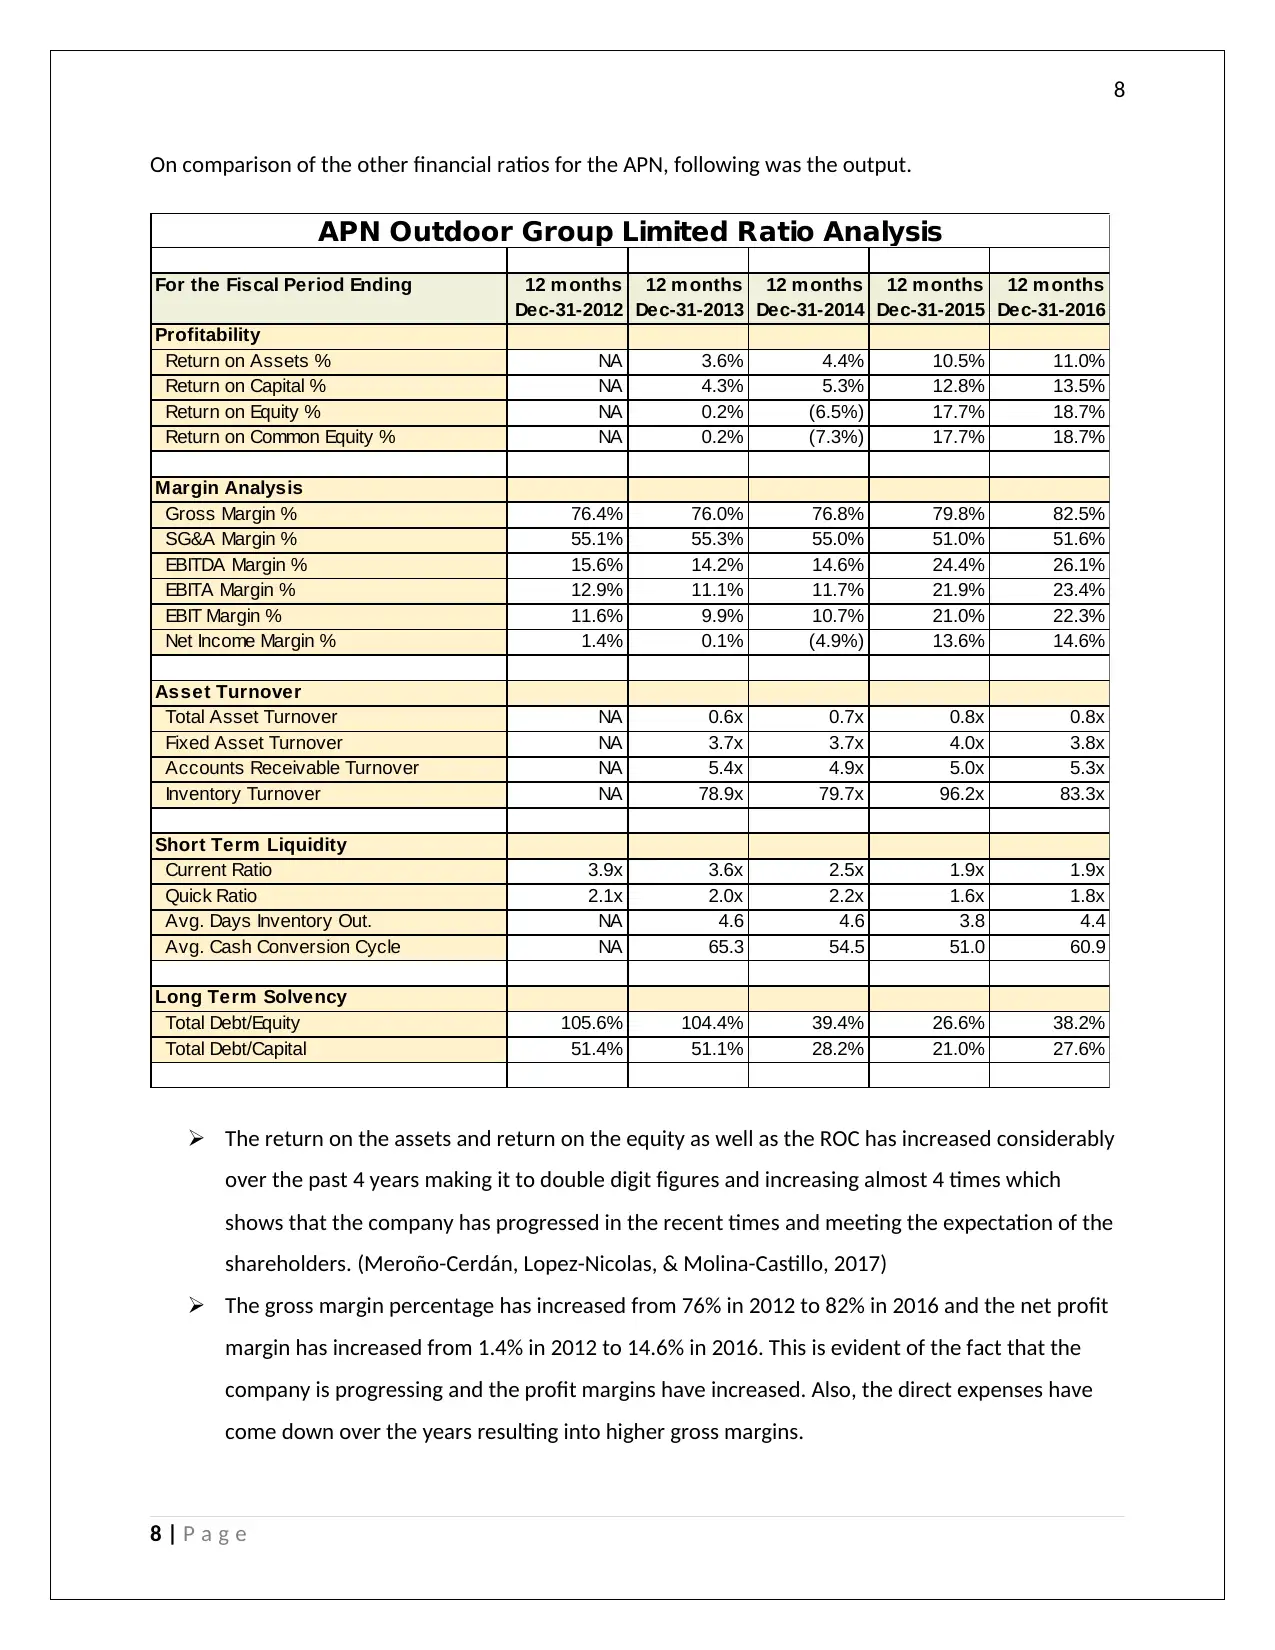
On comparison of the other financial ratios for the APN, following was the output.
For the Fiscal Period Ending 12 m onths
Dec-31-2012
12 m onths
Dec-31-2013
12 m onths
Dec-31-2014
12 m onths
Dec-31-2015
12 m onths
Dec-31-2016
Profitability
Return on Assets % NA 3.6% 4.4% 10.5% 11.0%
Return on Capital % NA 4.3% 5.3% 12.8% 13.5%
Return on Equity % NA 0.2% (6.5%) 17.7% 18.7%
Return on Common Equity % NA 0.2% (7.3%) 17.7% 18.7%
Margin Analysis
Gross Margin % 76.4% 76.0% 76.8% 79.8% 82.5%
SG&A Margin % 55.1% 55.3% 55.0% 51.0% 51.6%
EBITDA Margin % 15.6% 14.2% 14.6% 24.4% 26.1%
EBITA Margin % 12.9% 11.1% 11.7% 21.9% 23.4%
EBIT Margin % 11.6% 9.9% 10.7% 21.0% 22.3%
Net Income Margin % 1.4% 0.1% (4.9%) 13.6% 14.6%
Asset Turnover
Total Asset Turnover NA 0.6x 0.7x 0.8x 0.8x
Fixed Asset Turnover NA 3.7x 3.7x 4.0x 3.8x
Accounts Receivable Turnover NA 5.4x 4.9x 5.0x 5.3x
Inventory Turnover NA 78.9x 79.7x 96.2x 83.3x
Short Term Liquidity
Current Ratio 3.9x 3.6x 2.5x 1.9x 1.9x
Quick Ratio 2.1x 2.0x 2.2x 1.6x 1.8x
Avg. Days Inventory Out. NA 4.6 4.6 3.8 4.4
Avg. Cash Conversion Cycle NA 65.3 54.5 51.0 60.9
Long Term Solvency
Total Debt/Equity 105.6% 104.4% 39.4% 26.6% 38.2%
Total Debt/Capital 51.4% 51.1% 28.2% 21.0% 27.6%
APN Outdoor Group Limited Ratio Analysis
The return on the assets and return on the equity as well as the ROC has increased considerably
over the past 4 years making it to double digit figures and increasing almost 4 times which
shows that the company has progressed in the recent times and meeting the expectation of the
shareholders. (Meroño-Cerdán, Lopez-Nicolas, & Molina-Castillo, 2017)
The gross margin percentage has increased from 76% in 2012 to 82% in 2016 and the net profit
margin has increased from 1.4% in 2012 to 14.6% in 2016. This is evident of the fact that the
company is progressing and the profit margins have increased. Also, the direct expenses have
come down over the years resulting into higher gross margins.
8 | P a g e
⊘ This is a preview!⊘
Do you want full access?
Subscribe today to unlock all pages.
Trusted by 1+ million students worldwide
9
All the turnover ratios namely total asset turnover ratio, fixed assets turnover ratio, Accounts
receivable turnover ratio and the inventory turnover ratio, all of tehm have remained more or
less constant over the last 4 years implying the company is having good control over the
debtors, credoitors, inventory and the fixed assets and thus being able to churn the cash out of
it.
The short term liquidity ratios namely current ratio and the quick rati both have decreased over
the past 5 years from 3.9 times to 1.9 times and 2.1 times to 1.8 times respectively which shows
that the company has been able to utilise it working capital aptly and is not unnecessarily
blocking the funds in the current assets. Not of both is near the industry trend of 2 and 1
respectively which shows the healthy ratios for the firm.
Lastly the debt capital ratio implies the growth in debt over the last one year which shows that
the company is aiming to use the low cost funding to its best benefit such that the profitability
can be increased. (Heminway, 2017)
Significant changes to the capital structure during the past 3 years
Before 2013 the company capital structure was such that it has more than 50% of the funds through
debts and the bank loans and then since 2014 it has tried to keep the share the proportion of debt in the
entire capital to be below 30% by infusion of the funds from the investors. This is because the owners
are aware of the fact that now the company has broke even and is growing superbly with increased
profitability and return for the shareholders. Therefore, now they want to increase the ownership in the
company and thus reduce the dilution in the company’s capital structure.
Wealth maximisation for the shareholders in the past 3 years
We already saw with the help of the ratio analysis that the company has been preforming well in the
recent times and the return on equity which is the foremost measure of wealth maximisation for the
shareholders has increased from negative (-6.5%) in 2014 to to 17.7% in 2015 to 18.7% in 2016. This
shows that the company is growing the wealth for the shareholders, and they are happy to invest and
use more of own capital instead of loan capital. (Jefferson, 2017) It has been beating the market rate of
return of 8.38% which was calculated above. In addition to this, the return on capital has also grown
thrice from 5.3% in 2014 to 13.5% in 2016 which again is the indicator of rapid growth.
9 | P a g e
Paraphrase This Document
Need a fresh take? Get an instant paraphrase of this document with our AI Paraphraser
10
Why is it important to minimise the cost of capital and how can the cost of capital be reduced
The cost of capital represents the cost that the company is incurring on both the loan and the own
capital to get the requisite rate of return by the shareholders. The cost of capital can be decreased by
using more of debt and less of equity in the capital structure. This asks for low interest cost being
incurred on the debt and thus more return left to be distributed among the shareholders. Minimising
the cost of capital is need of the hour considering the immense competition in the market and the hig
returns being expected by the stakeholders. (Murray & Markey Towler, 2017)‐ The alternative for this is
choosing a alternative debt equity structure where the shareholder’s ownership in the company is being
diluted through infusion of low capital. Capital can also be infused by raising the funds from the public
via issue of the shares or through debentures.
10 | P a g e
11
Conclusion
We made a bried analysis of the company based on various indicators and facts using the annual report
of the company. The capital structure as well as the various ratios is evident of the fact the the company
is in the rising stage and is working effectively and efficiently towards it but since there exists
competition in the market from other rising advertising companies in Australia it needs to hold on to its
competitive advantage. Further, the company needs to improve its capital structure to have the boost to
its profitability as it has the cushion to do so.
11 | P a g e
⊘ This is a preview!⊘
Do you want full access?
Subscribe today to unlock all pages.
Trusted by 1+ million students worldwide
1 out of 13
Related Documents


Your All-in-One AI-Powered Toolkit for Academic Success.
+13062052269
info@desklib.com
Available 24*7 on WhatsApp / Email
![[object Object]](/_next/static/media/star-bottom.7253800d.svg)
Unlock your academic potential
Copyright © 2020–2026 A2Z Services. All Rights Reserved. Developed and managed by ZUCOL.