ACC508 - Information Systems, Decision Support, APN Outdoor Report

Verified

Added on  2019/11/25

|13
|1708
|122
Report
AI Summary
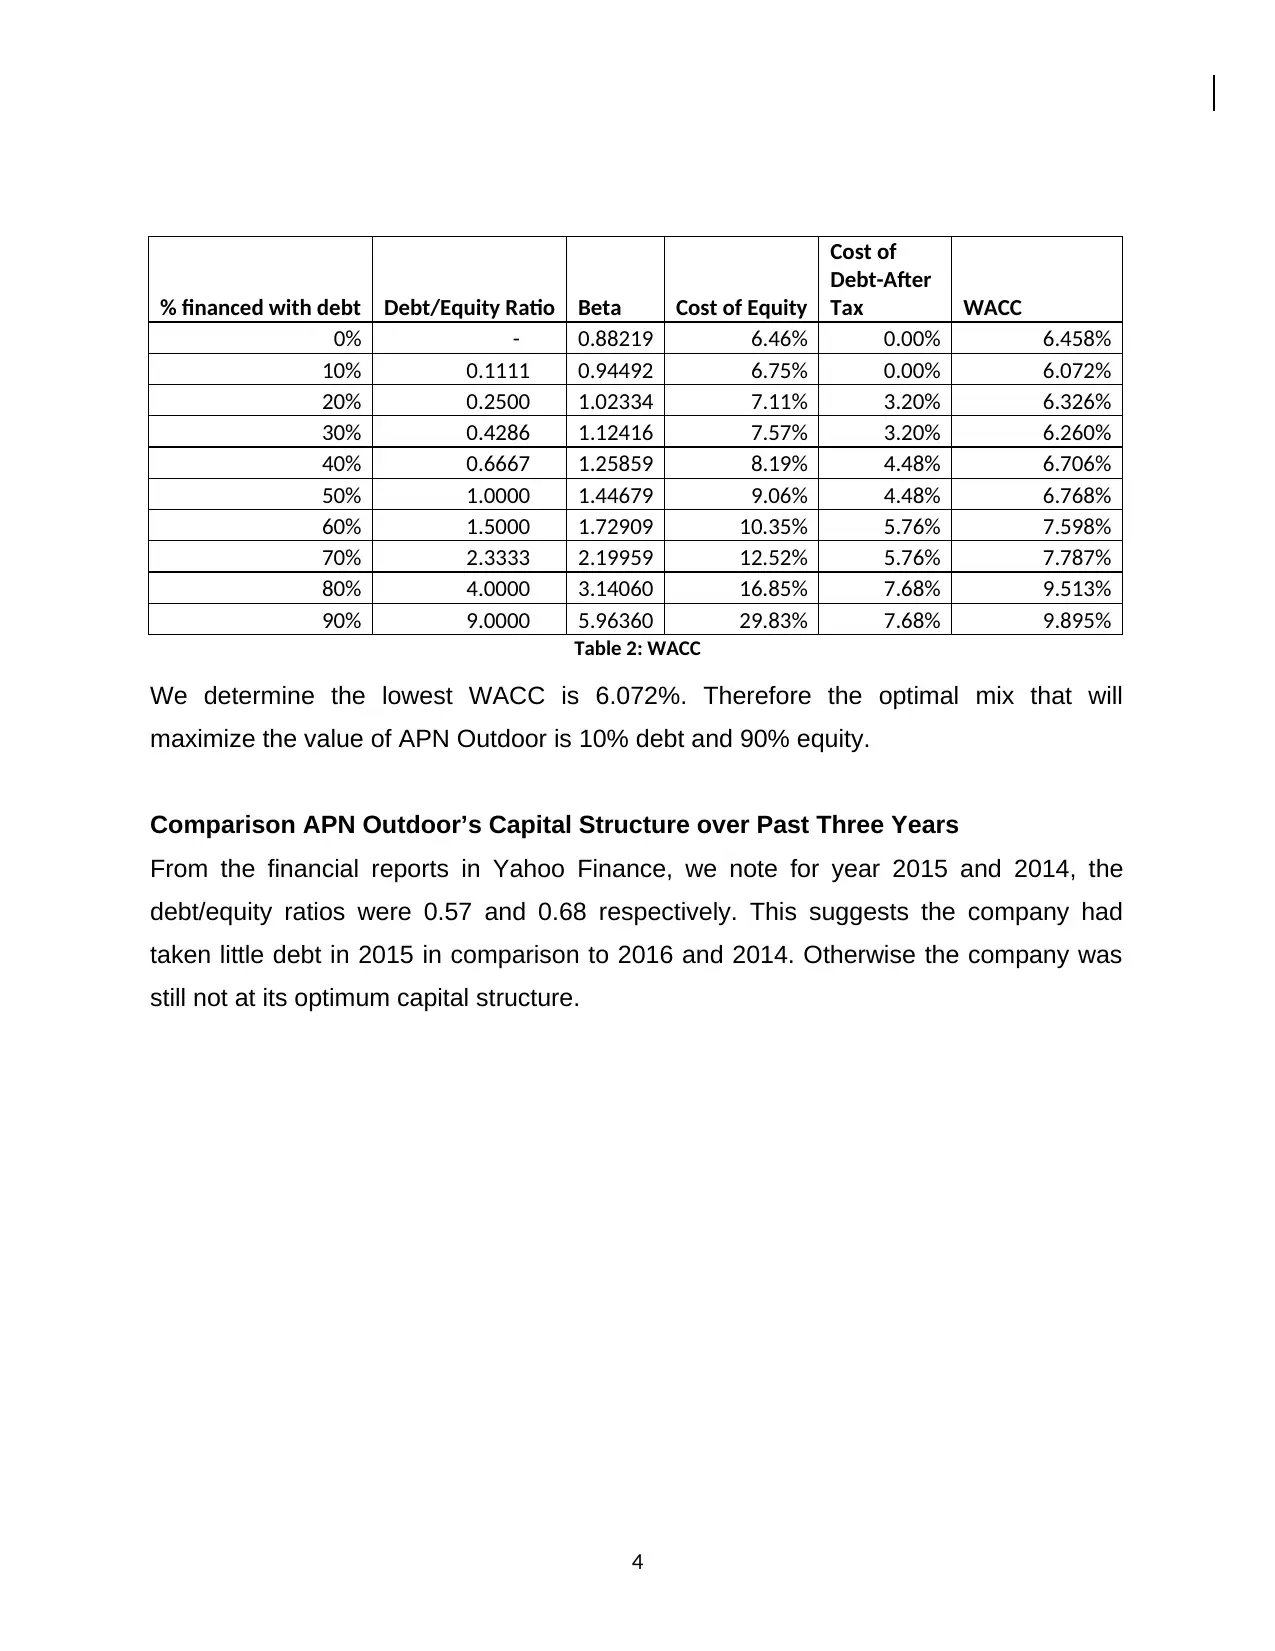
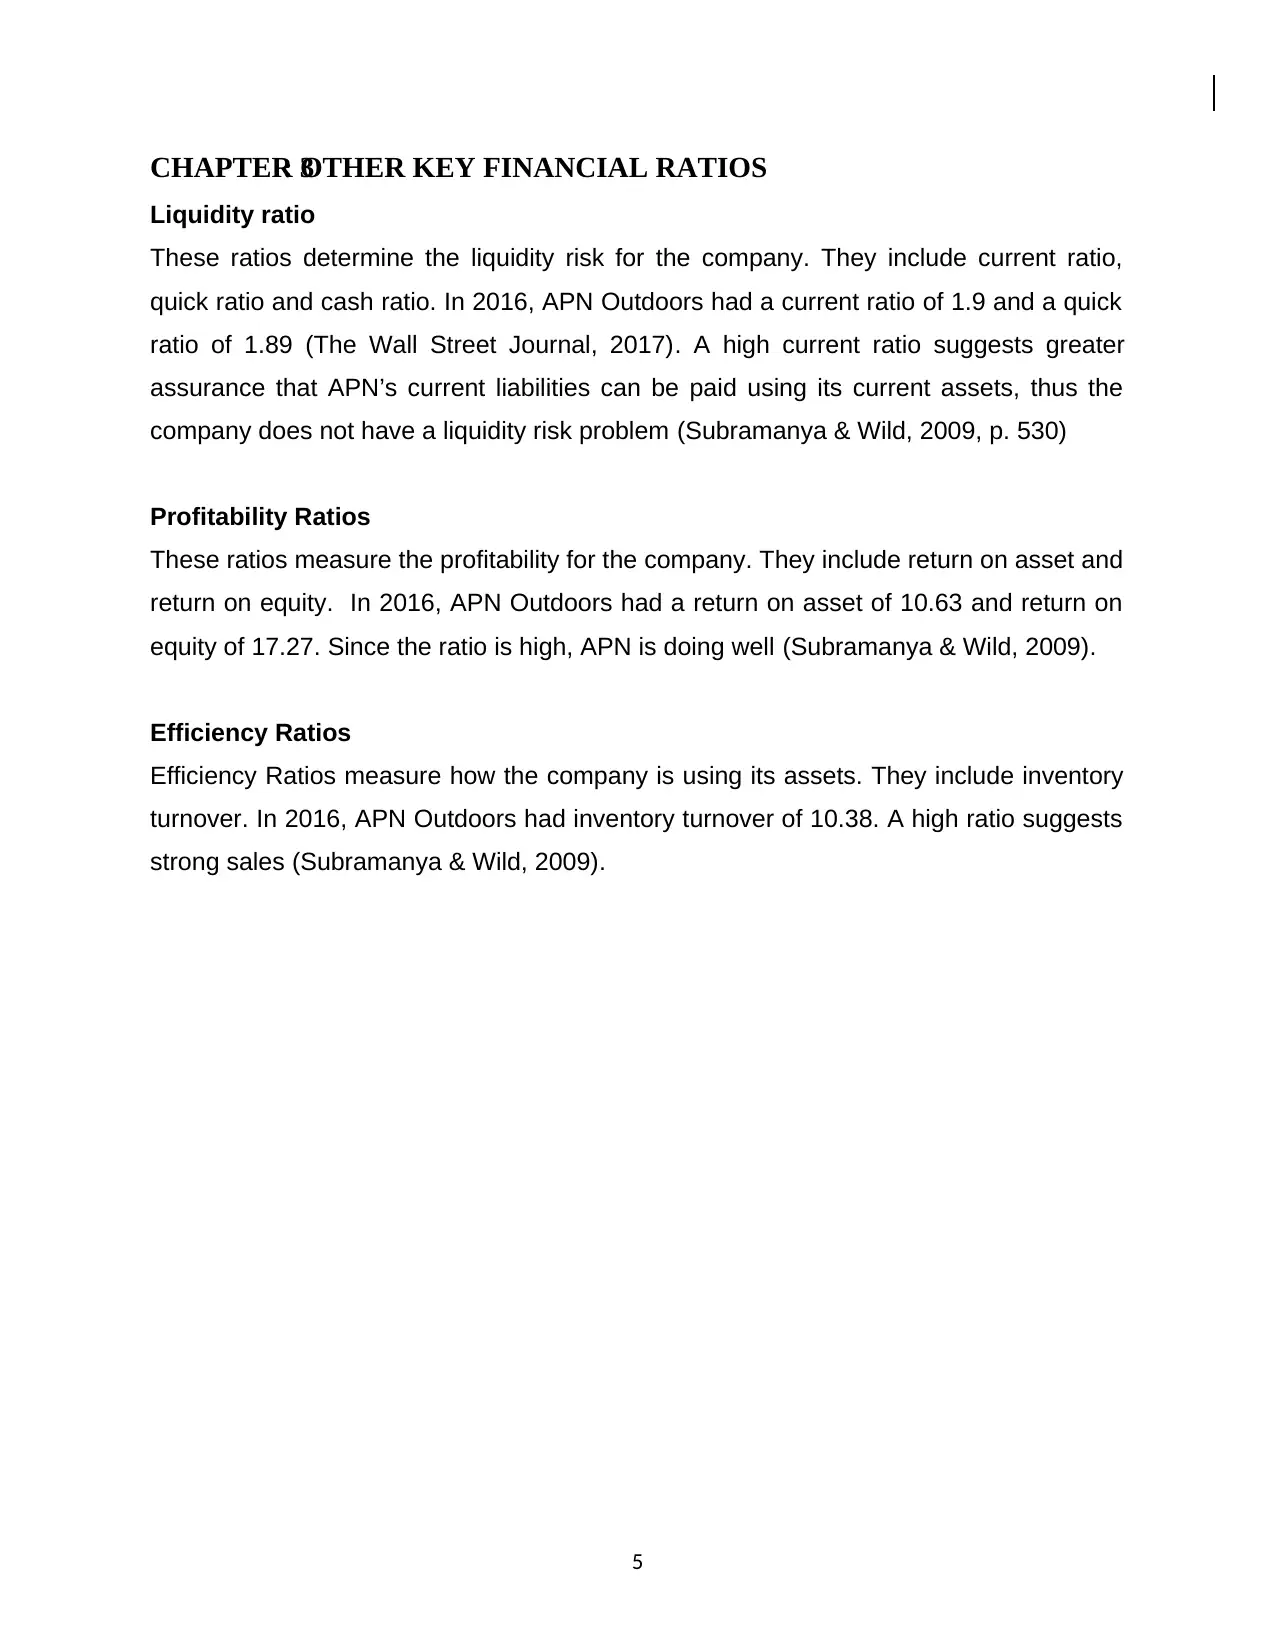
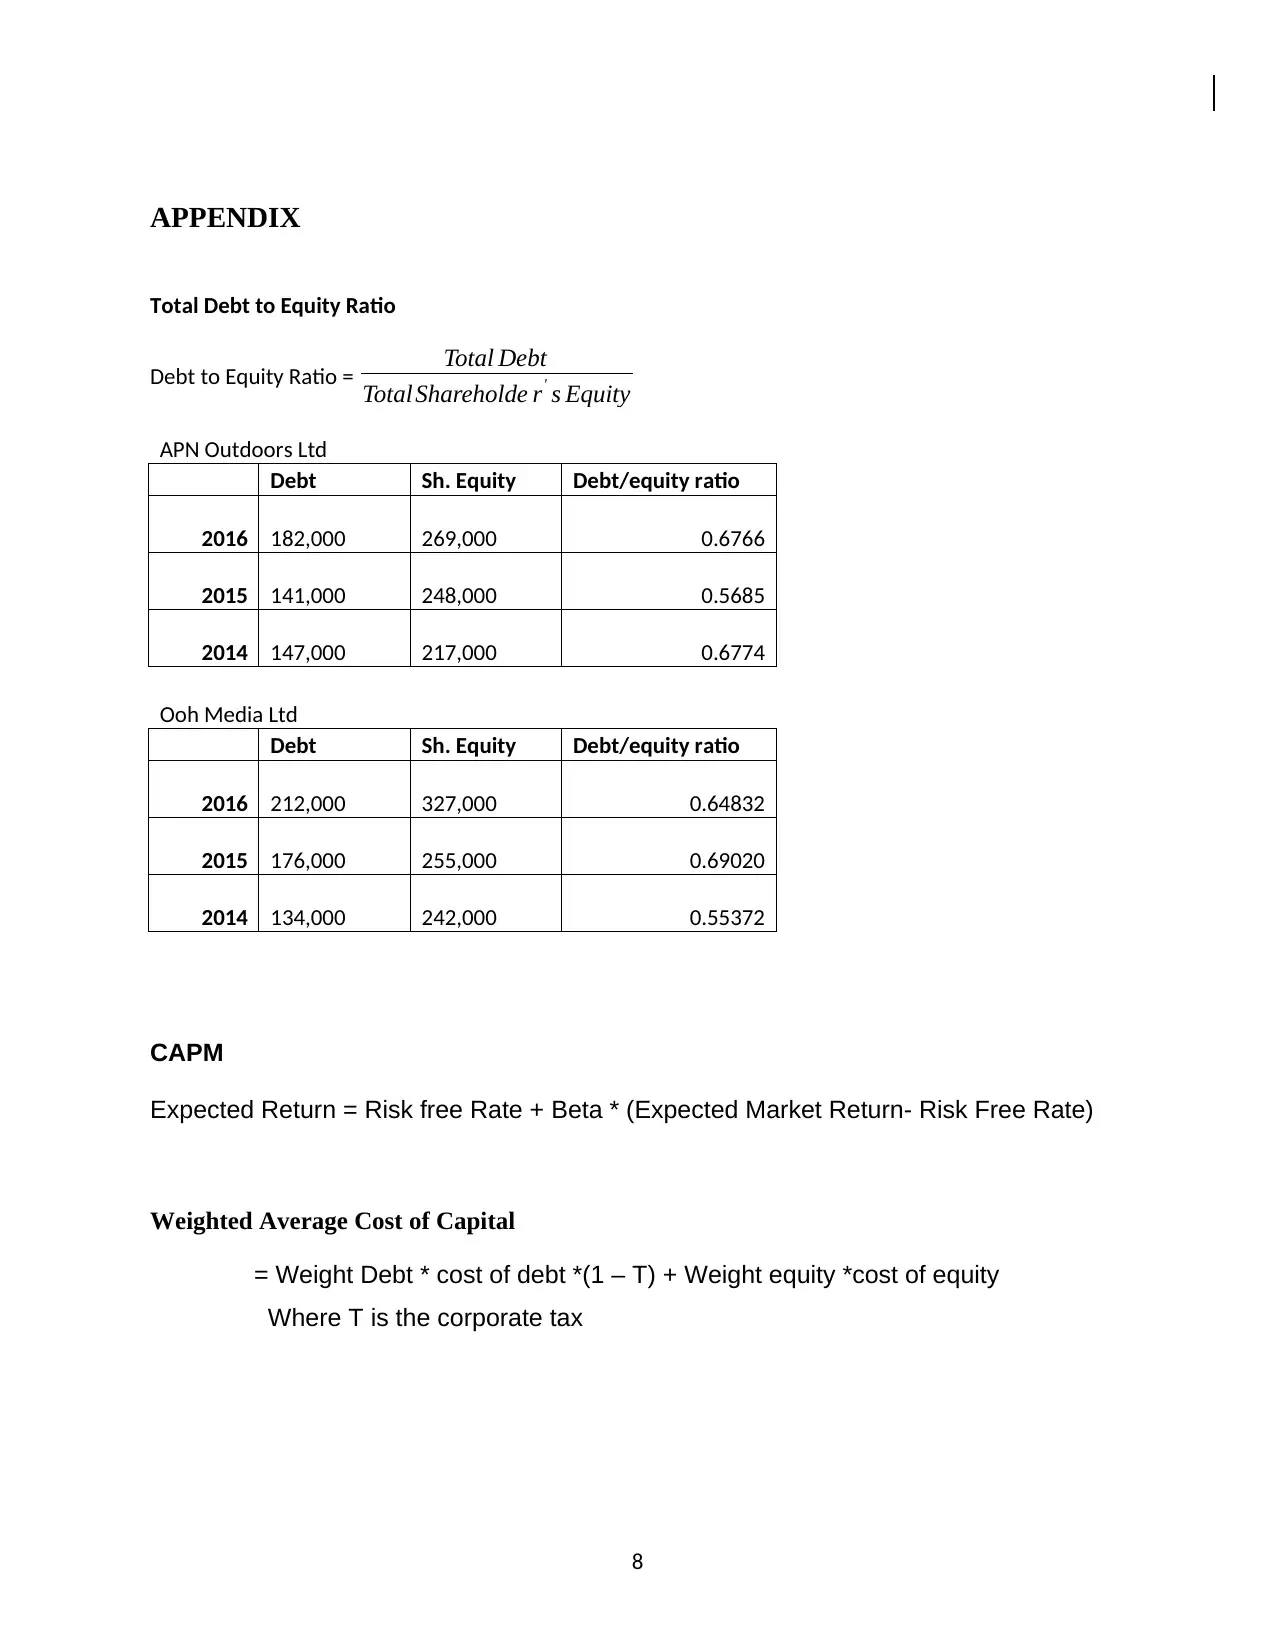
This report analyzes the capital structure of APN Outdoor Group (APO), a company listed on the ASX, to determine its effectiveness in maximizing shareholder wealth. The report examines APN Outdoor's debt-to-equity ratio, comparing it to a similar company, oOH! Media Ltd. It calculates the Weighted Average Cost of Capital (WACC) to identify the optimal capital structure, which is determined to be 10% debt and 90% equity for APN. The analysis also includes other key financial ratios such as liquidity, profitability, and efficiency ratios to assess the company's overall financial health. The conclusion suggests that APN Outdoor could improve shareholder value by optimizing its capital structure and minimizing its cost of capital. The report includes tables and references to support the findings and analysis.
Document Page
Assessment Three- Part B
Report on APN Outdoor’s Capital Structure
[Insert Student Name]
[Insert Student Number]
tabler-icon-diamond-filled.svg

Paraphrase This Document

Need a fresh take? Get an instant paraphrase of this document with our AI Paraphraser
Document Page
EXECUTIVE SUMMARY
A capital structure refers to a company’s sources of finance. Financing can range from
equity to debt, however, in most cases it will usually be a combination of both. The
sources of debt include trade credit, short term debt loans and long term debt. The
sources of equity include retained profits and issuance of shares.
Analyzing the capital structure of a company can provide a lot of valuable information to
investors and creditors regarding its value creation. For example, a company with a
heavy reliance to debt would be considered more aggressive and hence more risky than
a company that is financed via equity. That being said, this company may experience a
higher growth rate.
The goal of many companies is to maximize their shareholder value. One of the ways to
maximize shareholder value is to minimize its cost of debt and equity. The optimal
capital structure of a firm is the mix of equity and debt that minimizes a firm’s cost of
capital.
i
Document Page
TABLE OF CONTENTS
EXECUTIVE SUMMARY..................................................................................................................................i
TABLE OF CONTENTS...................................................................................................................................ii
LIST OF TABLES............................................................................................................................................iii
CHAPTER 1 : INTRODUCTION.......................................................................................................................1
CHAPTER 2 : ANALYSIS OF CAPITAL STRUCTURE.........................................................................................2
CHAPTER 3 : OTHER KEY FINANCIAL RATIOS................................................................................................5
CHAPTER 4 : CONCLUSION- SHAREHOLDER VALUE.....................................................................................6
REFERENCES................................................................................................................................................7
APPENDIX....................................................................................................................................................8
ii
Document Page
LIST OF TABLES
Table 1: Pre Tax Interest Rates......................................................................................................3
Table 2: WACC............................................................................................................................... 4
iii
tabler-icon-diamond-filled.svg

Paraphrase This Document

Need a fresh take? Get an instant paraphrase of this document with our AI Paraphraser
Document Page
CHAPTER 1: INTRODUCTION
The purpose of this report is to provide information on the capital structure of APN
Outdoor Group (APO) which is listed in the ASX and advice whether the firm has been
successful in maximizing wealth generation for its shareholders.
The report is divided four chapters as follows. In chapter one, which is the introduction, I
discuss the layout of the report.
In chapter two, I discuss the approach used to analyze the capital structure of APN
Outdoor Group.
In chapter three, we analyze other financial ratios in respect to the company.
In chapter four, I conclude my analysis by providing information on whether APN’s has
been successful in maximizing wealth generation for its shareholders.
1
Document Page
CHAPTER 2: ANALYSIS OF CAPITAL STRUCTURE
In order to determine the capital structure of APN, we need to analyze the following
information based on the company’s financial reports (Lee, Liang, & Miglo, 2014).
Determine APN Outdoor’s debt to equity ratio.
Perform comparison of debt/equity ratio with other similar companies in the
advertising industry.
Determine APN’s optimal capital structure
Determine APN’s Weighted Average Cost of Capital.
Compare APN Outdoor’s capital structure over past three years.
Total Debt to Equity Ratio
The total debt to equity ratio measures the relationship between equity capital and debt.
A high ratio suggests that a company has taken more debt and consequently, is more
aggressive with a higher risk (Investopedia, 2017).
In 2016, APN outdoor’s debt to equity was 0.67. Thus its total debt was 0.67 times its
equity (Yahoo Finance, 2017).
Comparison of Debt to Equity Ratio to oOH! Media Ltd
A similar company is oOH! Media Ltd (OML). oOH! Media is also an advertising
company that specializes in billboards (oOH! Media Ltd , 2017).
The 2016 debt/equity ratio for oOH! Media was 0.65 which was slightly below APN
Outdoors.
Weighted Average Cost of Capital
Also written as WACC, the Weighted Average Cost of Capital is the expected return on
the securities for a company.
WACC = Weight Debt * cost of debt *(1 – corporate tax) + Weight equity *cost of equity
2
Document Page
Optimal Capital Structure
Let’s assume that APN’s corporate tax, T is 36%. Furthermore, let’s assume the pre-tax
interest rates for each level of debt is given as below.
% financed with debt Pre tax cost of Debt
0% 0%
10% 0%
20% 5%
30% 5%
40% 7%
50% 7%
60% 9%
70% 9%
80% 12%
90% 12%
Table 1: Pre Tax Interest Rates
The cost of equity can be determined from CAPM.
To determine the optimal capital structure of APN Outdoor Ltd, we need to find the level
of debt and equity that will result in lowest WACC. To do this we can use Hamada
equation (Lee, Liang, & Miglo, 2014). I.e. βL= βu*[ 1 + (1-T)(D/E)]
Where βL - beta of firm that uses debt
βu- beta of firm without debt
T- Corporate tax
D/E- debt/ equity
We determine that APN Outdoor’s unlevered βu is 0.8822. We then calculate the WACC
for each level of debt (see Table 2)
3
tabler-icon-diamond-filled.svg

Paraphrase This Document

Need a fresh take? Get an instant paraphrase of this document with our AI Paraphraser
Document Page
% financed with debt Debt/Equity Ratio Beta Cost of Equity
Cost of
Debt-After
Tax WACC
0% - 0.88219 6.46% 0.00% 6.458%
10% 0.1111 0.94492 6.75% 0.00% 6.072%
20% 0.2500 1.02334 7.11% 3.20% 6.326%
30% 0.4286 1.12416 7.57% 3.20% 6.260%
40% 0.6667 1.25859 8.19% 4.48% 6.706%
50% 1.0000 1.44679 9.06% 4.48% 6.768%
60% 1.5000 1.72909 10.35% 5.76% 7.598%
70% 2.3333 2.19959 12.52% 5.76% 7.787%
80% 4.0000 3.14060 16.85% 7.68% 9.513%
90% 9.0000 5.96360 29.83% 7.68% 9.895%
Table 2: WACC
We determine the lowest WACC is 6.072%. Therefore the optimal mix that will
maximize the value of APN Outdoor is 10% debt and 90% equity.
Comparison APN Outdoor’s Capital Structure over Past Three Years
From the financial reports in Yahoo Finance, we note for year 2015 and 2014, the
debt/equity ratios were 0.57 and 0.68 respectively. This suggests the company had
taken little debt in 2015 in comparison to 2016 and 2014. Otherwise the company was
still not at its optimum capital structure.
4
Document Page
CHAPTER 3: OTHER KEY FINANCIAL RATIOS
Liquidity ratio
These ratios determine the liquidity risk for the company. They include current ratio,
quick ratio and cash ratio. In 2016, APN Outdoors had a current ratio of 1.9 and a quick
ratio of 1.89 (The Wall Street Journal, 2017). A high current ratio suggests greater
assurance that APN’s current liabilities can be paid using its current assets, thus the
company does not have a liquidity risk problem (Subramanya & Wild, 2009, p. 530)
Profitability Ratios
These ratios measure the profitability for the company. They include return on asset and
return on equity. In 2016, APN Outdoors had a return on asset of 10.63 and return on
equity of 17.27. Since the ratio is high, APN is doing well (Subramanya & Wild, 2009).
Efficiency Ratios
Efficiency Ratios measure how the company is using its assets. They include inventory
turnover. In 2016, APN Outdoors had inventory turnover of 10.38. A high ratio suggests
strong sales (Subramanya & Wild, 2009).
5
Document Page
CHAPTER 4: CONCLUSION- SHAREHOLDER VALUE
Shareholder wealth maximization involves increasing the share price. One of the ways
to create value in a firm is by utilizing an optimal capital structure.
In the case for APN Outdoor’s, we can see that indeed the company is not at its
optimum capital structure of 10% debt and 90% equity. However, their key ratios
indicate that it is making profits and don’t seem to have any liquidity risk.
In conclusion, APN Outdoor Group does not appear to create maximum value for its
shareholder’s. It should aim to minimize its cost of capital so that the firm’s value is
maximized in the long run. Some of the ways APN can minimize its WACC include
lowering its interest rates and managing its operational risks.
6
tabler-icon-diamond-filled.svg

Paraphrase This Document

Need a fresh take? Get an instant paraphrase of this document with our AI Paraphraser
Document Page
REFERENCES
Investopedia. (2017). Debt/Equity Ratio. Retrieved from Investopedia: http://www.investopedia.com
Lee, Z., Liang, S., & Miglo, A. (2014). Capital Structure of Internet Companies: Case Study. Retrieved from
http://faculty.nipissingu.ca/antonm/files/2014/06
oOH! Media Ltd . (2017). About Us. Retrieved from oOH! Media Ltd : https://www.oohmedia.com.au
Subramanya, K., & Wild, J. (2009). Financial Statement Analysis. New York: McGraw-Hill Irwin.
The Wall Street Journal. (2017). APN Outdoor Group Ltd. Retrieved from The Wall Street Journal:
http://quotes.wsj.com/AU/XASX/APO/financials/annual/balance-sheet
Yahoo Finance. (2017). APN OUTDOORS LTD. Retrieved from Yahoo Finance:
https://au.finance.yahoo.com
7
Document Page
APPENDIX
Total Debt to Equity Ratio
Debt to Equity Ratio = Total Debt
Total Shareholde r' s Equity
APN Outdoors Ltd
Debt Sh. Equity Debt/equity ratio
2016 182,000 269,000 0.6766
2015 141,000 248,000 0.5685
2014 147,000 217,000 0.6774
Ooh Media Ltd
Debt Sh. Equity Debt/equity ratio
2016 212,000 327,000 0.64832
2015 176,000 255,000 0.69020
2014 134,000 242,000 0.55372
CAPM
Expected Return = Risk free Rate + Beta * (Expected Market Return- Risk Free Rate)
Weighted Average Cost of Capital
= Weight Debt * cost of debt *(1 – T) + Weight equity *cost of equity
Where T is the corporate tax
8
chevron_up_icon
1 out of 13
circle_padding
hide_on_mobile
zoom_out_icon
[object Object]