Comprehensive Financial Analysis of APN Outdoor Group (2016)
VerifiedAdded on 2020/03/16
|27
|4324
|37
Report
AI Summary
This report provides a comprehensive financial analysis of APN Outdoor Group (ASX: APO) for the 2016 financial year. It begins with an executive summary and table of contents, followed by an introduction outlining the report's objectives. The shareholder analysis section identifies the types of investors and differentiates between marginal and non-marginal shareholders, with supporting data from the annual report. A detailed risk and return analysis examines APN Outdoor Group's risk profile, return calculations for 2016, and capital projects, including the proposed merger with oOh! Media Ltd. The cost of capital section explores the cost of equity using both the CAPM and dividend growth models, the cost of debt, corporate tax, and the weighted average cost of capital (WACC). The report concludes with a financial statement analysis, including performance and other financial ratios, to assess APN Outdoor Group's overall financial health. The analysis uses data from the 2016 financial statements and stock prices, providing a thorough evaluation of the company's financial performance during that period.
APN Outdoors Group Ltd
Paraphrase This Document
Need a fresh take? Get an instant paraphrase of this document with our AI Paraphraser
EXECUTIVE SUMMARY
APN Outdoor Group (ASX: APO) is an Australian listed firm which specializes in offering
advertising services including static roadside billboards, digital billboards, rail, transit
and airport advertising in both Australia and New Zealand. It was listed in the ASX in
November 2014. 1
The company boasts over 50,000 high impact sites and is committed to be the leaders
in the outdoor advertising industry by constantly investing in cutting-edge digital
innovation and developments to produce quality results.2
1 Quadrant Private Equity, "APN OUTDOOR." Quadrant Private Equity. 2017.
http://quadrantpe.com.au/Investments/Quadrant-Private-Equity-No-3/Portfolio/APN-Outdoors.aspx.
2 APN Outdoors,” About Us.”2017. https://www.apnoutdoors.com.au.
i
TABLE OF CONTENTS
EXECUTIVE SUMMARY..........................................................................................................................i
TABLE OF CONTENTS...........................................................................................................................ii
LIST OF TABLES.....................................................................................................................................iv
CHAPTER 1 : INTRODUCTION.............................................................................................................1
CHAPTER 2 : SHAREHOLDER ANALYSIS.........................................................................................2
2.1 Type of Investors............................................................................................................................2
2.2 Marginal and Non-marginal Shareholders..................................................................................2
CHAPTER 3 : RISK AND RETURN ANALYSIS...................................................................................5
3.1 Risk Profile......................................................................................................................................5
3.2 Returns for 2016 Financial Year...................................................................................................6
3.2.1 Returns- APN Outdoor Group...............................................................................................6
3.2.2 Returns- Australian All Ordinary Index.................................................................................7
3.3 Capital Projects..............................................................................................................................7
CHAPTER 4 : COST OF CAPITAL........................................................................................................9
4.1 Introduction.....................................................................................................................................9
4.2 Cost of Equity..................................................................................................................................9
4.2.1 CAPM Model............................................................................................................................9
4.2.2 Dividend Growth Model........................................................................................................10
4.2.3 Dividend Growth Model Vs CAPM......................................................................................11
4.3 Cost of Debt..................................................................................................................................11
4.4 Corporate Tax...............................................................................................................................11
4.5 Weight of Debt and Equity..........................................................................................................12
4.6 Weighted Average Cost of Capital.............................................................................................12
4.7 Discussion on Cost of Capital.....................................................................................................12
CHAPTER 5 : FINANCIAL STATEMENT ANALYSIS.......................................................................14
5.1 Introduction...................................................................................................................................14
5.2 Performance Ratios.....................................................................................................................14
5.3 Other Ratios..................................................................................................................................16
REFERENCES........................................................................................................................................18
APPENDIX A: Top 20 Security Holders...............................................................................................20
ii
⊘ This is a preview!⊘
Do you want full access?
Subscribe today to unlock all pages.
Trusted by 1+ million students worldwide
APPENDIX B: Weekly Returns- APO.AX and AORD........................................................................21
APPENDIX C: Beta and Cost of Equity...............................................................................................22
iii
APPENDIX C: Beta and Cost of Equity...............................................................................................22
iii
Paraphrase This Document
Need a fresh take? Get an instant paraphrase of this document with our AI Paraphraser
LIST OF TABLES
Table 2-1: Substantial Shareholders................................................................................3
Table 2-2: Marginal Vs Non-Marginal...............................................................................3
Table 4-1: Type of Debt- APN..........................................................................................9
Table 5-1: Financial Ratios- APN Outdoor Group..........................................................11
Table 5-2: Financial Ratios- oOH! Media Ltd.................................................................11
iv
CHAPTER 1: INTRODUCTION
The purpose of this report is to provide an overview of APN Outdoor Group’s
shareholders, its risk return analysis, the weighted average cost of capital and its
financial statement analysis.
The period under investigation was the 2016 financial year. All the calculations are
based on the 2016 financial statements and stock prices.
1
⊘ This is a preview!⊘
Do you want full access?
Subscribe today to unlock all pages.
Trusted by 1+ million students worldwide
CHAPTER 2: SHAREHOLDER ANALYSIS
2.1 Type of Investors
APN Outdoor Group is a leading outdoor advertising company in New Zealand and
Australia (APN Outdoors 2017). The company was listed in the ASX in November 2014
and it has a market share of 27% in Australia and 34% in New Zealand3.
As a result, many investors would be attracted to the company because of its leading
position, premium sites in Australia and New Zealand, attractive industry growth
opportunities and high barriers to entry with long term contracts.
From the chairman’s 2016 report, we observe the dividend policy has been
emphasized, suggesting that investors expect returns in the form of dividends.
Furthermore, he reports on the expected wealth creation through the proposed merger
with oOh! Media and the its increased investment in technology4.
Consequently, we expect the following group of investors would invest in the group.
Institutional Investors
Private Equity Firms
Hedge funds
2.2 Marginal and Non-marginal Shareholders
A marginal shareholder typically owns a significant portion of stock in comparison to a
non-marginal shareholder. Typically they include banks and their nominees. Appendix A
lists the top 20 largest holders of quoted equity securities.
3 Quadrant Private Equity, "APN OUTDOOR." Quadrant Private Equity. 2017.
http://quadrantpe.com.au/Investments/Quadrant-Private-Equity-No-3/Portfolio/APN-Outdoors.aspx.
4 APN Outdoors, “About Us” 2017. https://www.apnoutdoors.com.au.
2
Paraphrase This Document
Need a fresh take? Get an instant paraphrase of this document with our AI Paraphraser
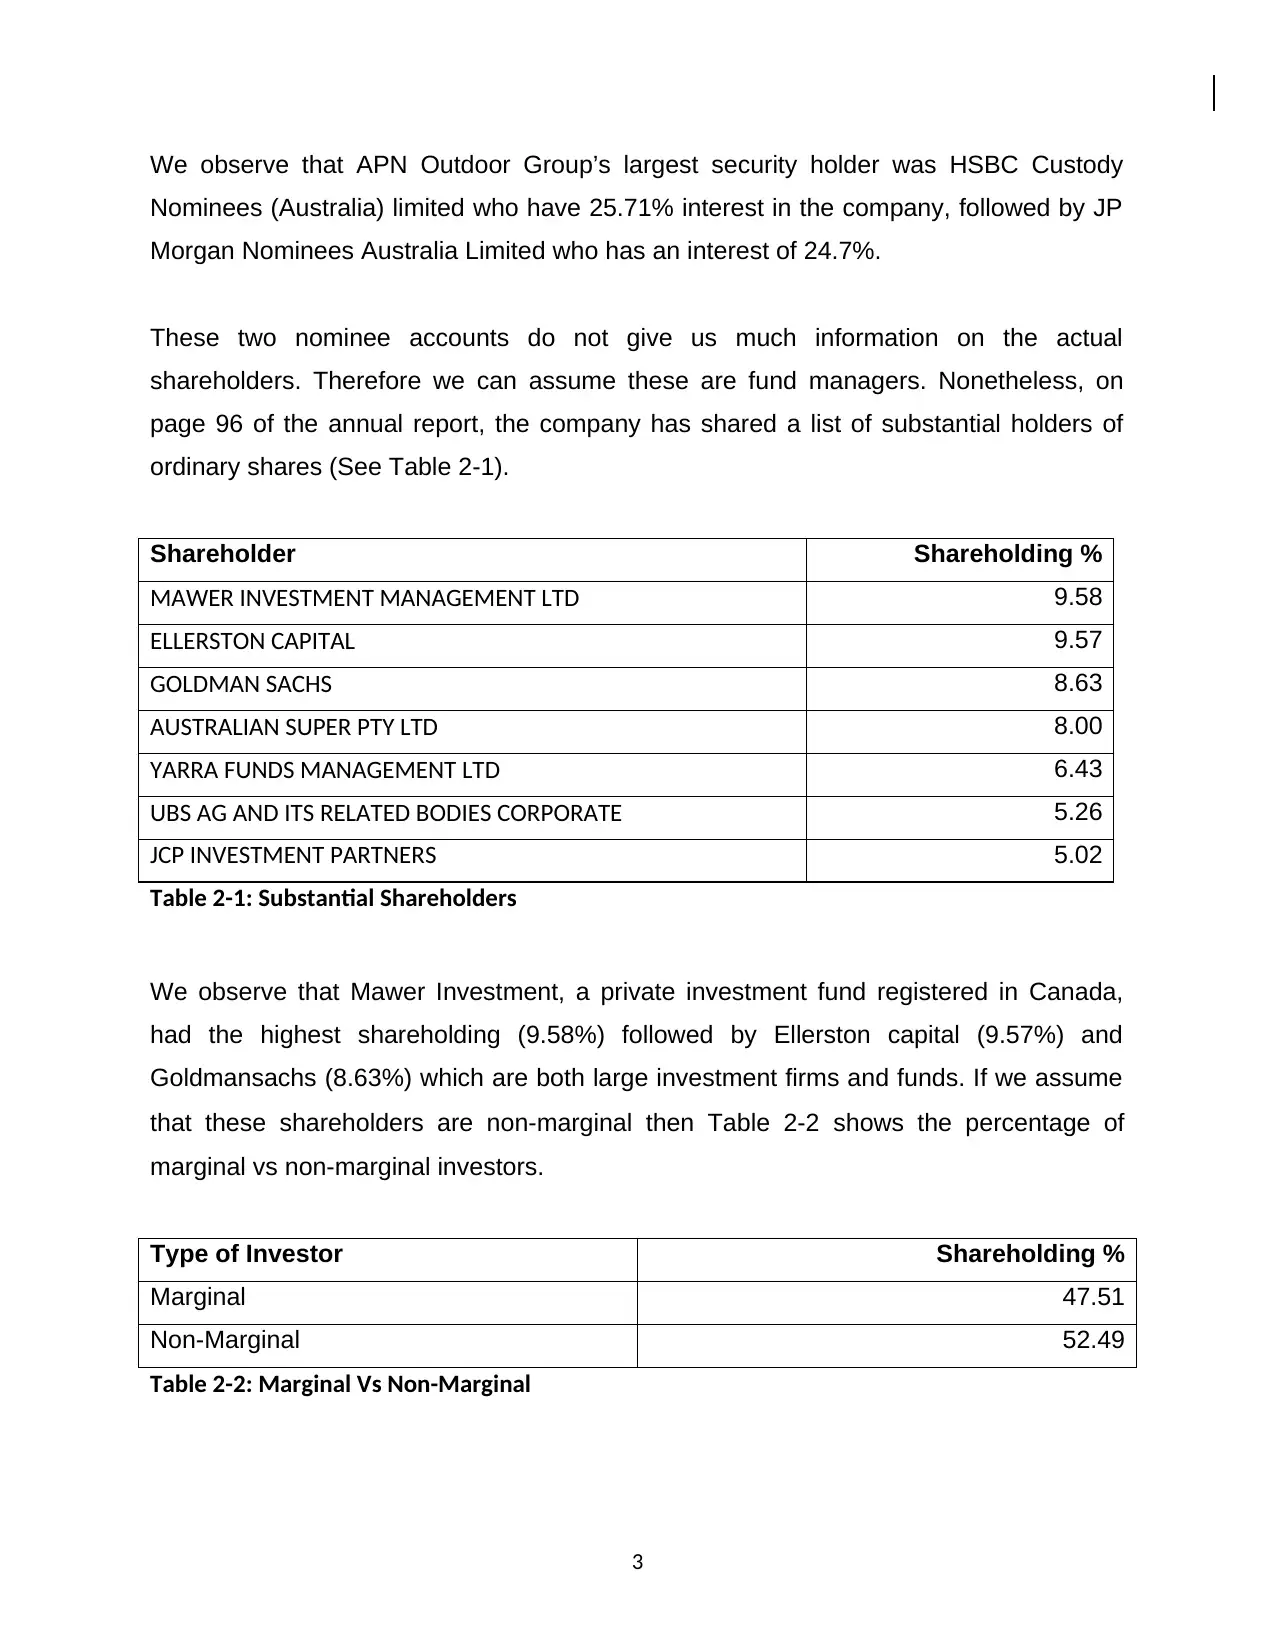
We observe that APN Outdoor Group’s largest security holder was HSBC Custody
Nominees (Australia) limited who have 25.71% interest in the company, followed by JP
Morgan Nominees Australia Limited who has an interest of 24.7%.
These two nominee accounts do not give us much information on the actual
shareholders. Therefore we can assume these are fund managers. Nonetheless, on
page 96 of the annual report, the company has shared a list of substantial holders of
ordinary shares (See Table 2-1).
Shareholder Shareholding %
MAWER INVESTMENT MANAGEMENT LTD 9.58
ELLERSTON CAPITAL 9.57
GOLDMAN SACHS 8.63
AUSTRALIAN SUPER PTY LTD 8.00
YARRA FUNDS MANAGEMENT LTD 6.43
UBS AG AND ITS RELATED BODIES CORPORATE 5.26
JCP INVESTMENT PARTNERS 5.02
Table 2-1: Substantial Shareholders
We observe that Mawer Investment, a private investment fund registered in Canada,
had the highest shareholding (9.58%) followed by Ellerston capital (9.57%) and
Goldmansachs (8.63%) which are both large investment firms and funds. If we assume
that these shareholders are non-marginal then Table 2-2 shows the percentage of
marginal vs non-marginal investors.
Type of Investor Shareholding %
Marginal 47.51
Non-Marginal 52.49
Table 2-2: Marginal Vs Non-Marginal
3
Given that the firm has significant institutional holdings and small insider holdings, we
can assume the marginal investor is almost a diversified, institutional investor5.
5 Andrew Jacobson , "Identifying the Marginal Investor." Andrew Jacobson Financial. May 3, 2017.
https://www.ajjacobson.us/finance-analysis/identifying-the-marginal-investor.html.
4
can assume the marginal investor is almost a diversified, institutional investor5.
5 Andrew Jacobson , "Identifying the Marginal Investor." Andrew Jacobson Financial. May 3, 2017.
https://www.ajjacobson.us/finance-analysis/identifying-the-marginal-investor.html.
4
⊘ This is a preview!⊘
Do you want full access?
Subscribe today to unlock all pages.
Trusted by 1+ million students worldwide
CHAPTER 3 : RISK AND RETURN ANALYSIS
3.1 Risk Profile
The company has been in the media in the past months due to its failed $1.6 billion
merger with Ooh media Ltd, a rival company in the advertising industry (oOH! Media Ltd
2017). As a result, APN reported its net profit after tax fell to $15.8 million for the first
half in 2017, due in part to a $3.4m pre-tax cost from the merger.6
Other potential risks to the company are as follows:-
Slow demand for outdoor media product
Improvement in technology is increasing the number of media choices available to
audiences. These developments and new ways for advertisers to reach consumers
may cause changes in consumer behavior.
Risk of losing major contracts
APN Outdoor holds leases to various site locations. Many of these contracts require
APN Outdoor to participate in a tender at each renewal. Should the company not
have a competitive bidding process, it risks losing its major contract renewals.
Tight Government Regulation
Changes in regulatory controls on outdoor advertising will affect the roll out of new
digital signs which will affect the company’s revenues. 7
3.2 Returns for 2016 Financial Year
Appendix B shows the weekly returns of APN Outdoor and the Australian All Ordinary
Index over financial year 2016. The total return to the shareholder is calculated as the
capital growth plus the dividend received.
6 Stephen Brook, "Failed oOh! merger leaves $3.4m sting in tail for APN Outdoor." The
Australian. August 22, 2017. http://www.theaustralian.com.au/business/media/failed-ooh-merger-
leaves-34m-sting-in-tail-for-apn-outdoor/news-story/53d92d5019fd602c592aadb80a9d8eb8.
7Morgans, "APN Outdoor: Stuck in Transit." Morgans. 21 August, 2017.
https://my.morgans.com.au/research/8D63900F-96B6-454B-BB14-5DD2F2670856.pdf?u=9b6e4620-
b777-4faa-824c-18d547e2ca31.
5
Paraphrase This Document
Need a fresh take? Get an instant paraphrase of this document with our AI Paraphraser
3.2.1 Returns- APN Outdoor Group
The capital growth can be calculated by taking the difference between start and ending
share price for the 2016 financial year and dividing by start price. Hence, the capital
growth (loss) of APN Outdoors is calculated as below:-
-3.115% = $ 5.91−$ 6.1
$ 6.1
The company paid two dividends in the 2016 financial year as follows:
A final dividend for the year ended 31 December 2015 of 11 cents per ordinary
share, fully franked paid on 22 April 2016
Interim dividend for the half year ended 30 June 2016 of 6.5 cents per ordinary
share, fully franked paid on 21 October 2016. 8
To gross up the fully franked dividend, the dividend should be divided by 70%. This is
because the dividend is paid out of after tax earnings which are taxed at 30% for
franking credit purposes.
So, for the APN outdoors the fully franked dividend is as below
A final dividend of 15.71 cents
An interim dividend of 9.29 cents
The dividend yield can be calculated as the total dividend divided by initial share price.
Hence, the dividend yield on APN Outdoors is calculated as below:-
4.537% = $ 0.157+$ 0.929
$ 5.51
Thus the total return to the shareholder is 1.422% (4.537% -3.115%)
8 APN Outdoor,"2016 Annual Report Page 71: APN Outdoor Group Limited ." APN Outdoor.
February 22, 2017.
6
3.2.2 Returns- Australian All Ordinary Index
The Australian All Ordinaries (AORD) will be used as a proxy to the market. The total
return can be calculated by taking the difference between initial and final index for the
2016 financial year and dividing by initial index. Hence, the total returns on the
Australian All Ordinary Index is calculated as
13.263% = 5719.1−5049.4
5049.4
Since the returns on APN are lower than the returns on the market, the company did
not perform well in 2016.
3.3 Capital Projects
In December 14 2016, the company announced plans to merge with Ooh! Media Ltd, a
rival company in the advertising industry. The merger would represent a great
opportunity for shareholders as it would combine two companies to create a leading
media group. Furthermore, it would increase returns and lead to cost synergies9.
Following the announcement in December 2016, we note the company share price
increased to $5.99 in response to the merger news. Figure shows the share price 15
days before and after the announcement in December 14, 2016. This suggests that the
market is semi efficient.
9 APN Outdoor,"2016 Annual Report: APN Outdoor Group Limited ." APN Outdoor. February 22,
2017. http://www.annualreports.com/HostedData/AnnualReports/PDF/ASX_APO_2016.pdf.
7
⊘ This is a preview!⊘
Do you want full access?
Subscribe today to unlock all pages.
Trusted by 1+ million students worldwide
1 out of 27
Related Documents


Your All-in-One AI-Powered Toolkit for Academic Success.
+13062052269
info@desklib.com
Available 24*7 on WhatsApp / Email
![[object Object]](/_next/static/media/star-bottom.7253800d.svg)
Unlock your academic potential
Copyright © 2020–2026 A2Z Services. All Rights Reserved. Developed and managed by ZUCOL.